Where Darwin neglected to explain the human-brain encephalization Part 3: Data of a supportive C57bl6 mouse model following a Systems Biology lipidomics based approach
*Vincent van Ginneken
Blue-Green Technologies, Heelsum, Netherlands.
*Corresponding author: Vincent van Ginneken,Blue-Green Technologies, Heelsum, Netherlands; E-mail: vvanginneken@hotmail.com
Received date: October 12, 2020; Accepted date: August 23, 2021; Published date: September 3, 2021
Citation: Vincent van Ginneken (2021) Evaluating the effect of milling speed and screen size on power consumed during milling operation. J Nerv Syst Vol.5 No.5.
Abstract
In an earlier study we observed at a High-fat diet induced obese C57bl6 mouse model with "overgrown brain" or “brain steatosis”. Here our observations are indicative that mainly unsaturated very long chain fatty acids (TGs) of the C: 50, C: 52 and C: 54 TGs fraction were accumulated in the HF-diet obese C57BL6 whole brain fraction and we found based on LC-MS techniques a close correlation with the nutritional composition of the HF diet with respect to these TGs of the HF feed diet (correlation coefficient r2 = 0.760 compared to control group r2 = 0.264) Thus, from these observations, we concluded that a juvenile rodent study in bovine-induced obesity exhibited an "overgrown brain", primarily through the accumulation of triacylglycerols (TGs). From these observations we suggested and proposed the hypothesis that the specific molecular structure of bovine lard with large amounts of unsaturated C: 50; C: 52 and C: 54 TGs could have played a role in the encephalization of mammals. As a follow-up to this study, our main interest in this study can be defined as similar observations are made in humans. We also described, via the principle of hunter- prey correlation, similarities in migration routes of the ancestors of the herds of the African buffalo (Syncerus caffer), mitochondrial-DNA studies) and these of early hominids (paleontological- & archaeological studies. So, in this third review with mainly data of a C57bl6 mouse model we intend to find an explanation and most important try to unravel any mysteries related to the specific composition of bovine lard or meat in relation to the process of human encephalization.
Key words: Homo sapiens, human brain, neocortex, encephalization, Syncerus caffer, C57bl6, mouse model, encephalization, human brain evolution, Out of Africa, Systems Biology, Lipidomics.
Introduction lipidomics approach
A totally new approach in Evolutionary sciences is that we believe that human evolution is literally engraved in our body and as such we can reconstruct human evolution based on modern biochemical, physiological and biomedical findings. Because the human brain consists for the major part of fat, a System biological lipidomics approach is a new perspective in the Evolutionary sciences.
In the current Natural-sciences more and more subject areas are interrelated to each other. Evolutionary sciences can no longer rely solely on a 'reductionist' approach since paleoanthropology and radioisotope tracer studies have been added together to trace the antiquity of the soil layer where the fossils were found. The discovery of DNA from fossils led to the introduction of genomics techniques in combination with the research into phylogenetic degree of kinship between species, in addition to purely morphological characteristics. For example, we stated in an earlier review that fascinating discoveries in several research fields provide a blending of ecological, anatomical, physiological, biochemical, (bio)medical and nutritional data for evolutionary sciences. Their interconversions and their evolving conclusions bring us closer to a single innovative and comprehensive evolutionary theory about human brain growth or encephalization. In understanding the difficulty of complex biological systems research like e.g. complex evolutionary processes -for example human brain encephalization- one has to be directed to the components of a biological system, their interactions and the behaviors and properties of the whole system. This is the basis for a Systems-biology approach which aims to understand phenotypic variation to assemble comprehensive data and models of cellular organization and biochemical function, and to elucidate interactions and pathways for e.g. metabolites. The progress made in this new research area of Systems-Biology is also related to the progress made the last decade in other research area’s like: Molecular Biology, Computational Science, Statistics, Chemistry, and Mathematics.
The human brain is often seen as ‘omnipotent’ in mammalian brains: the most cognitive, the largest than expected in body size, endowed with an overdeveloped cerebral cortex representing more than 80% of brain mass and reportedly containing 100 billion neurons and 10x more glial cells. However, the biochemical composition of this “mystery of mysteries” remains elusive. Recently, following a lipidomics based approach, we have largely clarified in great extent the biochemical composition of the human brain; a requirement set by the supporters of the “Aquatic Phase Theory”. To see it all in a historical context: the end of the 20th century was marked by the genomics revolution, and you could say that the beginning of the 21st century is characterized by efforts to improve our knowledge about the proteins of a cell, known as proteomics, equal to our growing knowledge of the transcripts of a cell, also called transcriptomics. Many of us believe that the next evolution of the "omics" revolution will be to map all the metabolites of a cell, known as metabolomics. Leading in these efforts, many laboratories are working on one subset of the metabolome, the ‘lipidoma’, aimed at mapping all lipids from a cell, known as lipidomics. The ultimate goal is to evolve into an integrated “-omics” image (the 'interactome') of genes, transcripts, proteins and metabolites that fully describe cellular functioning.
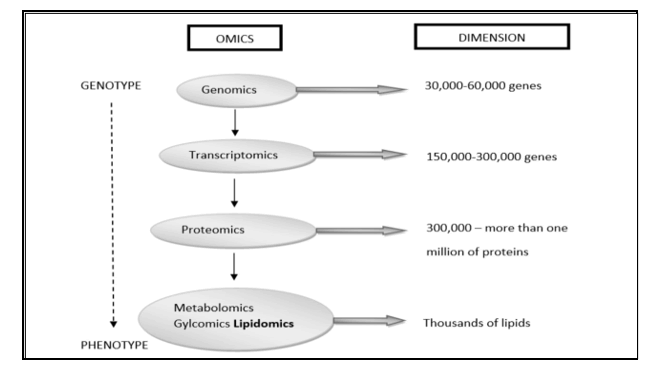
Figure 1: Systems biology is the computational and mathematical analysis and modelling of complex biological systems. It is a biology-based interdisciplinary field of study that focuses on complex interactions within biological systems, using a holistic approach (holism instead of the more traditional reductionism) to biological research. We followed a lipidomics based approach which is the newest promising direction and member of the Metabolomics group.
Estimates vary, but e.g. in the Human Metabolome Database (HMDB) -Canada (Human Metabolome Project): currently contains ~ 6,500 individual small molecule metabolites, considerably less than the estimate of 25,000 genes, 100,000 transcripts and 1,000,000 proteins. estimated that the human genome encodes more than 30,000 genes and is responsible for generating more than 100,000 functionally different proteins. Metabolomics measures chemical phenotypes that are the net result of genomic, transcriptomic and proteomic variability, giving the most integrated profile of biological status. Metabolomics is theoretically an accurate tool for distinguishing mechanisms of action in metabolic processes involved in brain growth or encephalization. Lipidomics is a subset of metabolomics that aims to identify and quantify a large number of lipids simultaneously. To achieve this, a lipidomics analysis involves several processes: extraction of lipids from a biological sample, purification, composition, quantification, separation, detection and data analysis. LC-MS separation of lipid molecules is based on mass and polarity, while lipidomics based on these principles is aimed at quantitatively defining lipid classes, including their molecular species, in biological systems. Thus, lipidomics is a recent study of lipidomas using the principles and techniques of analytical chemistry, and appeared in 2003 as an approach to study the metabolism of the cellular ‘lipidoma’. The lipidomics technique offers a powerful tool for the development of lipid biomarkers to study disease states but has never been used to study human evolution with an emphasis on human brain growth (encephalization). This seems illogical because the human brain contains the highest concentration of lipids after white fatty tissue, immediately after fatty tissue (white adipose tissue ≈WAT). Many thousands of lipid types exist and their metabolism is intertwined through countless pathways and networks. These networks can also change in response to changes in the cellular environment due to evolutionary Darwinian triggers such as exercise or altered diet (≈ nutritional intervention). Measuring such changes and understanding the pathways involved is crucial to fully understand cellular metabolism that leads to fundamental evolutionary mechanisms. Such demands have catalyzed the emergence of lipidomics, which enables the large-scale study of lipids using the principles of analytical chemistry.
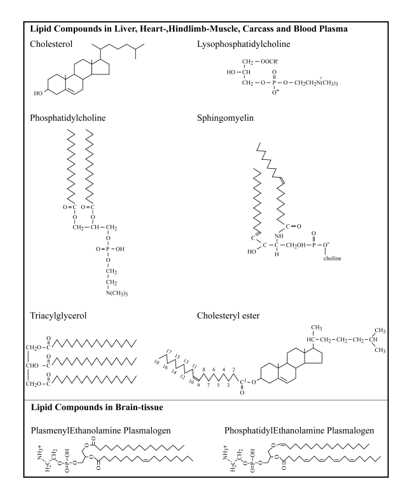
Mass spectrometry, largely due to the analytical power and the rapid development of new tools and techniques, is widely used in lipidomics and significantly accelerated progress in the field. LC-MS analysis of lipids in post-mortem human brain (neocortex) homogenates was performed according to the previously published method of using a Thermo LTQ. A Thermo LTQ is a linear ion-trap LC-MS instrument (Thermo Electron, San Jose, USA). With the described LC-MS techniques we were able to separate on the basis of mass and polarity around ≈125 individual lipid compounds from the seven major lipid classes: lyso-phosphatidylcholines (LPC); phosphatidyl cholines (PC); sphingomyelins (SPM); phosphatidylethanolamines (PE); triacyl glycerols (TG) and cholesteryl esters (ChE) in human post-mortem neocortex material. Because there are no standards for plasma halves, mass lists were determined using chemical atmospheric pressure (APCI) and electrospray ionization (ESI) mass spectrometry (MS) techniques. These mass lists were published on the internet at www.byrdwell.com/plasmogens and www.byrdwell.com/-Phosphatidyl Ethanolamine.
Figure 2: A lipidomics analysis involves multiple processes: extraction of lipids from a biological sample, purification, composition, quantitation, separation, detection, and data analysis with a new application in studying human brain encephalization.
This review summarizes previously conducted research according to a LC-MS based lipidomics System Biology approach of a supportive Control -Chow C57bl6 mouse group (n ≈ 5-7), an insulin resistant (IR) High-Fat (HF) diet induced obese C57bl6 mouse group (n ≈ 5-7) and a 24-h starvation C57bl6 mouse group (n ≈ 5-7) for whole brain homogenate and blood plasma. In lipidomics research the number of objects / subjects is often small and therefore a frequently used statistical method is classification: the assignment of subjects to individual categories. The essence of this Systems Biology lipidomics based approach at human brain of donors from the “Netherlands Brain Bank” is new and innovative and is supported by similar LC-MS research studies at a juvenile C57bl6 mouse model.
To place this approach in a new evolutionary framework, I make a modified explanation for the evolutionary sciences as a replacement for the holistic perception of that he explained for medicine: “To understand evolutionary biology at the system level, we investigate the structure and dynamics of cellular and organistic function, rather than the characteristics of isolated parts of a cell or organism. Characteristics of such systems, such as robustness, are central and understanding these characteristics can have an impact on the future of evolutionary sciences. In this first section we will introduce lipidomics and describe a number of common but important new tools, such as calculating enzymatic activity based on product / precursor ratio - which have led to an exciting revolution in enzymology- will be applied and can help us gain insight into metabolic pathways of fatty acids. The awareness that human evolution is literally engraved into our bodies is an important new approach in human evolutionary sciences and will add valuable information towards the development of theories based on the human-like fossil record and has joined thousands of other fossils that human unambiguously documenting evolution. This in combination with geological tracer studies that gave the awareness of the fundamental course of human evolution and the time frame over millions of years”.
Figure 3: Depending on the process or disease example gratia for metabolic diseases like IR/T2DM we selected a “Systems Biology” Lipidomics approach. A Thermo-LTQ (linear ion-trap) LC-MS Instrument (Thermo-Electron, San Jo) in combination with a Thermo-LTQ equipped with a Thermo Surveyor HPLC pump were used. Using internal standards for quantification and qualification the different lipid compounds could be detected. Separation of each individual lipid compound (up to ≈ 136 lipid compounds) was based on mass and polarity and consisted of six dominant lipid classes: a). Lysophosphatidylcholines (LPC), b). Phosphatidylcholines (PC), c). Sphingomyelins (SPM), d). Phosphatidylethanolamines (PE), e). Cholesterylesters (ChE), f). Triacylglycerols (TGs).
Mono-unsaturated fatty acids (MUFAs) are the precursors of the PUFAs and are a component of the phospholipids in cell membranes and help maintain membrane fluidity. Phospholipids contain a variety of unsaturated fatty acids, but not all of these can be synthesized in the body. Fatty acid desaturase, an enzyme in the endoplasmic reticulum, introduces double bonds between carbons 9 and 10 in Palmitic acid (C16:0, ω -7) and in Stearic acid (C18:0; ω -9; SA) (C18:0, ω -9), producing Palmitoleic acid (C16:1, ω -7) and Oleic acid (C18:1, ω -9), respectively. Fatty acid desaturase requires O2 and either NAD+ or NADPH. Humans lack the enzymes necessary to introduce double bonds beyond carbon 9. Thus Linoleic acid (C18:2, ω -6; LA) and α-Linolenic acid (C18:2, ω 3; ALA) cannot be synthesized. These are called essential fatty acids.
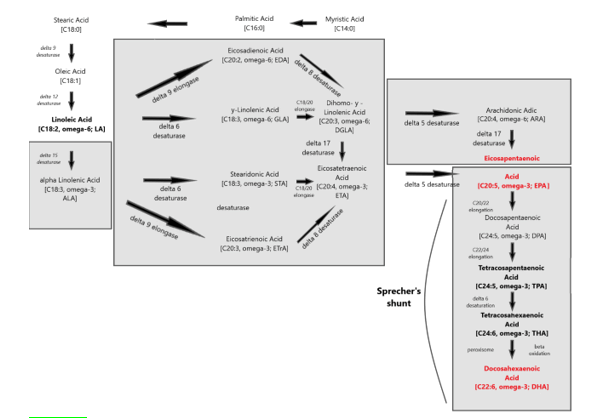
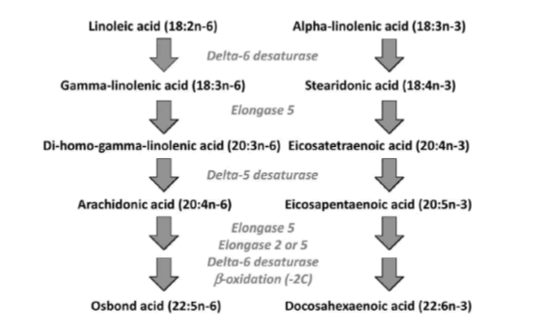
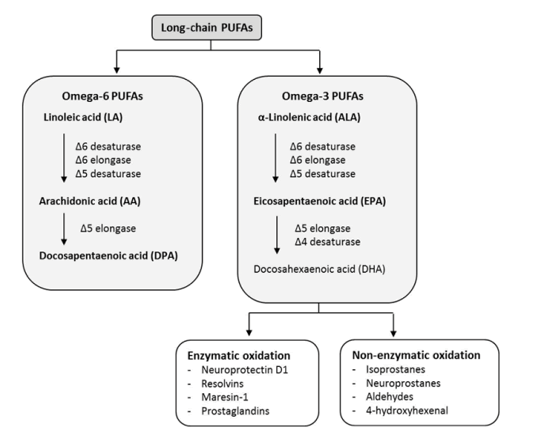
Figure 4: The two main families of PUFAs are the ω -3 (starting at α-Linolenic acid (C18:3, ω -3)) and ω -6 (starting at Linoleic acid (C18:2, ω -6)) families and the interconversions of PUFAs towards Eicosapentaenoic acid (C20:5, ω -3; EPA) and via “Sprecher’s shunt” towards Docosahexaenoic acid (C22:6, ω -3; DHA). The enzymatic conversion from EPA (Eicosapentaenoic acid; C20:5, ω -3; EPA) towards DHA (Docosahexaenoic acid; C22:6, ω -3; DHA) takes partly place in the peroxisome. This pathway -instead of an earlier stipulated â??4 desaturase is called ‘Sprecher’s shunt’.
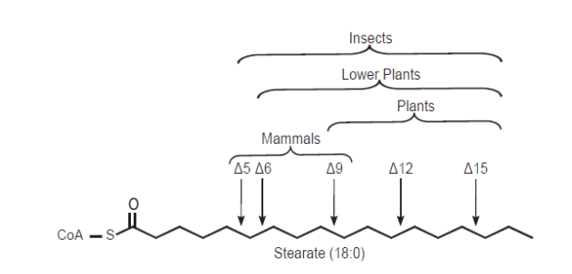
Mammals lack Δ12 and Δ15-desaturase activities, so they cannot synthesize Linoleic acid (C18:2, ω -6; LA) and α-Linolenic acid (C18:3, ω -3; ALA) from the precursor Oleic acid (18:1, Δ9).
Linoleic acid (C18:2, ω -6; LA) and α-Linolenic acid (C18:3, ω -3; ALA) are, therefore, considered essential dietary nutrients and named as essential fatty acids (EFAs). This metabolism involves insertion of additional double bonds into the aliphatic chain (a process termed desaturation) and addition of further carbon atoms to the acyl chain (a process termed elongation).
Essential fatty acids (EFA) are important components of structural lipids and contribute to the regulation of membrane properties like fluidity, flexibility, permeability and modulation of membrane-bound proteins. Linoleic acidï?¨ (LA, 18:2 ω 6) and α-Linolenic acid (ALA, 18:3 ω 3) are the two parent EFA (figure 4).
The term 'essential' implies that they must be supplied in the diet because they are required by the human body and cannot be endogenously synthesised. The balance between ω 3- and ω 6-FA in the diet is important because of their competitive nature and their different biological roles. Both parent EFAs are metabolised to long chain polyunsaturated fatty acids (LC-PUFAs) of 20- and 22- carbon atoms. EFAs and LC-PUFAs may together be referred to as polyunsaturated fatty acids (PUFAs). Once obtained from the diet, Linoleic acid (C18:2, ω -6; LA) and α-Linolenic acid (C18:3, ω -3; ALA) are further metabolized by â??-6 desaturation, elongation, and â??-5 desaturation to form Arachidonic acid (C20:4, ω -6; ARA) and Eicosapentaenoic acid (C:20:5, ω –3, EPA), respectively (figure 4). The â??-5 desaturase and subsequent steps in the pathway are found in animal but not in plant cells (figure 5).
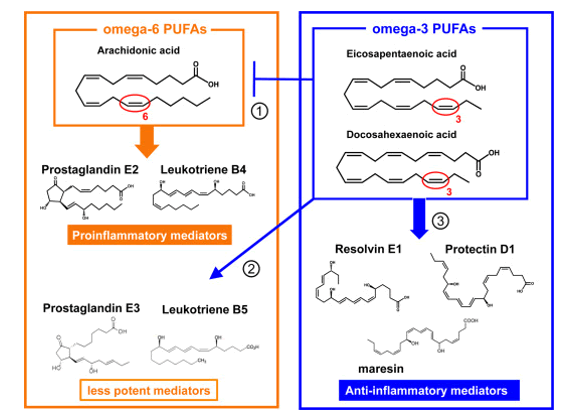
Some LC-PUFAs, notably Dihomo-γ-linolenic acid (C20:3, ω 6; DGLA), Arachidonic acid (C20:4, ω 6; ARA), and Eicosapentaenoic acid (C20:5, ω 3; EPA) are precursors of a wide variety of short-lived regulatory molecules such as prostaglandins (PG), thromboxanes (TX) and leukotrienes (LT), together called ‘eicosanoids’. They are involved in inflammatory and anti-viral reactions, endothelial integrity and many more (figure 6).
Figure 6: Balance between omega-6 PUFAs (≈Proinflammatory mediators) derived from Arachidonic acid (C20:4, ω -6; ARA) and omega-3 PUFAs which produce anti-inflammatory and protective compounds (Resolvins and Neuroprotectins) derived from Docosahexaenoic acid (C22:6, ω -3, DHA).
LC-PUFAs and the brain
In order to provide a better understanding about the brain’s critical dependence on specific essential fatty acids (EFA’s) so that we are ultimately able to unlock the “mystery of mysteries” and how fatty acids exert their effect on the human brain in order to be able to understand the process of human brain encephalization we should concentrate on the polyunsaturated fatty acids (PUFAs).
There are two distinct families of polyunsaturated fatty acids, the ω -6 fatty acids, such as Linoleic acid (C18, 18: 2, ω 6; LA), and the ω -3 fatty acids, such as α-Linolenic acid (C18: 3 ω 3; LA). LA and ALA are essential nutrients such as the human body cannot synthesize or convert them into one another. They were both collectively in the past designed as vitamin F, before their chemical structure was determined. The term “omega-3 fatty acids” is plural as there are five main ones that have increasing numbers of double bonds and carbon atoms: i). α-Linolenic acid (C18:3 ω 3; ALA) is the precursor of ii). Stearidonic acid (18:4 ω 3, SA), which gives rise to iii). Eicosapentaenoic acid (EPA, 20:5 ω 3) and iv). Docosahexaenoic acid (C22:6 ω 3) and the recently ‘new discovered’ v). Docosapentaenoic acid (C22:5, ω 3; DPA).
Once in the body, Linoleic acid and α-Linolenic acid can be converted to ω -6 and ω -3 PUFAs, respectively. This conversion includes a series of desaturation and elongation reactions. Desaturation occurs at carbon atoms below carbon number 9 of the acyl chain (counted from the carboxyl carbon). Linoleic acid can be converted to γ-linolenic acid (18: 3n-6) by Δ6-desaturase and then γ-linolenic acid can be extended by the enzyme elongase-5 to dihomo-γ-linolenic acid (20: 3n-6; DGLA). DGLA can be further desatured by â??5 desaturase to yield arachidonic acid (20: 4n-6; ARA). With the same set of enzymes used to metabolize ω -6 PUFAs, α-Linolenic acid is converted to Eicosapentaenoic acid (20: 5n-3; EPA). In mammals, the path of desaturation and prolongation occurs primarily in the liver. The desaturation enzymes use NADPH and molecular oxygen and are located on the endoplasmic reticulum. The genes encoding â??6 and â??5 desaturase are known as fatty acid desaturase â??2 and â??1 (FADS2 and FADS1), respectively. The route shown in Figure 8 & 31 shows that there is competition between the ω -6 and ω -3 PUFA families for metabolism. The â??6 desaturase reaction is rate limiting in this route. The preferred substrate for â??6 desaturase is α-Linolenic acid (ALA), but because Linoleic acid is much more common in most human diets than α-Linolenic acid, the metabolism of ω -6 PUFAs is quantitatively the most important. The activities of Δ6 and Δ5 desaturases are regulated by nutritional status, hormones (e.g. Insulin) and feedback inhibition by end products. Polymorphisms in the FADS1 and FADS2 genes are associated with differences in status of either ω -6 and ω -3 PUFAs, presumably due to the polymorphisms that result in different activities of the desaturase enzymes. Further conversion of ARA to Osbond acid (C22: 5, ω -6) and of EPA to Docosahexaenoic acid (22: 6n-3; DHA) takes place through a complex route. This includes chain elongation catalyzed by elongase-5, a second chain extension catalyzed by elongase-2 or -5, desaturation by Δ6 desaturase and then removal of two carbon atoms as acetyl-CoA by limited β-oxidation in peroxisomes; see earlier Sprecher’s shunt figure 4.
The most important “omega-6 fatty acids “are a fourfold i). Linoleic acid (C18:2, ω -6, LA); ii). â?½-Linolenic acid (C18:3, ω -6; GLA) converted via a C18/20 elongase towards Dihomo-â?½-Linolenic acid (C20:3, ω -6; DGLA); followed by the strong inflam-matory one iii). Arachidonic acid (C20:4, ω -6; ARA) and iv). Osbond acid (C22:5, ω -6; OA). The major ω -6 inflammatory is Arachidonic acid (C20:4, ω -6; ARA) which is needed for the production of pro-inflammatory eicosanoids which comprise the prostaglandins, thromboxanes, leukotrienes, etc. see figure 6 & 7).
A lipid is logically saturated when most of its fatty acids are saturated. The most important saturated fatty acids are Palmitic acid (C16:0) and Stearic acid (C18:0; ω -9; SA), the main fatty acid in myelin is Lignocic acid (C24:0).
A lipid is considered to be monounsaturated if it contains mainly monounsaturated fatty acids, such as Oleic acid (C18, a double binding, (C18: 1, ω -9). Oleic acid (C18:0) is the precursor of the extremely important Linoleic acid (C18:2, ω -6; LA). Myelin has a high content of Nervonic acid (C24: 1≈Nervonate).
LC-PUFAs, especially docosahexaenoic acid (C22:6, ω -3; DHA), play important roles in the development of the central nervous system. Docosahexaenoic acid (C22:5, ω -3; DHA) is the most abundant omega-3 fatty acid in the brain and retina. DHA comprises 40% of the polyunsaturated fatty acids (PUFAs) in the brain and 60% of the PUFAs in the retina. Fifty percent of the weight of a neuron's plasma membrane is composed of DHA. In addition, DHA is the predominant structural fatty acid in the brain which is mostly distributed in the cerebral cortex, membranes of synaptic communication centres, mitochondria and photoreceptors of the retina. Other functions of DHA are the modulation of the carrier-mediated transport of choline, glycine, and taurine, the function of delayed rectifier potassium channels, and the response of rhodopsin contained in the synaptic vesicles. These lipids participate directly in the structure and hence the function of cerebral membranes.
An important fraction of the Cholesteryl Esters (ChE) are the Polyunsaturated Acids (PUFAs) which are Essential Fatty acids (EFAs), which means that they cannot be synthesised and must come from the diet. The two main families of PUFAs are the ω -3 (starting at α-Linolenic acid (C18:3, ω -3)) and ω -6 (starting at Linoleic acid (C18:2, ω -6)) families (figure 8).
Annex 3: gives a list of omega-3 fatty acids found in nature; Annex 4: gives a list of common omega-6 fatty acids and Annex 5: shows other polyunsaturated fatty acids.
MouseFeed
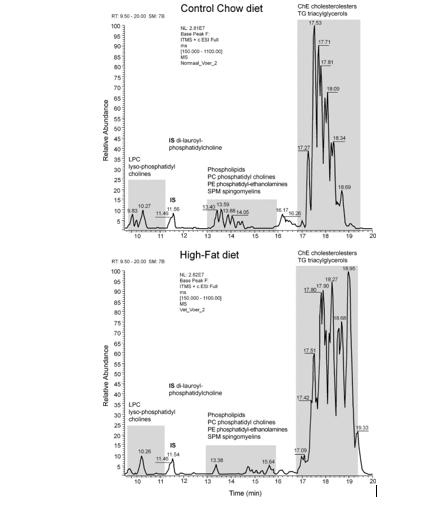
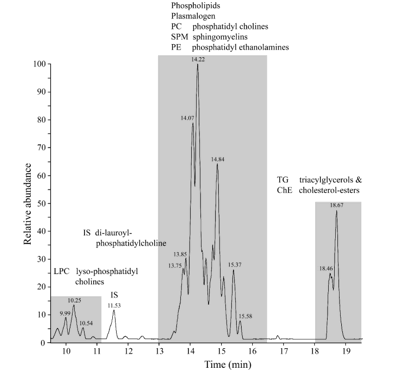
An example of an LC-MS chromatogram of Control-chow (top) and High-fat diet (bottom) is displayed in figure 9. Three groups of chemical compounds can be clearly distinguished in these figures: A). After 9-11 minutes retention time the Lysophosphatidylcholines (LPC) become visible with at 12 minutes the Internal Standard Di-lauroyl-phoshatidylcholine (IS); B). After 13-16 minutes the Phosphatidylcholines (PC), Sphingomyelins (SPM), Diacylglycerols (DG) and Phosphatidylethanolamines (PE) become visible; and C). After 17-19 minutes the Triacylglycerols (TG) and Cholesteryl-esters (ChE). In figure 11A & B these figures are reflected in a 3D plot. In table 1 is the Food constitution of the mice chow versus the High-fat Diet given based on 24.0% bovine lard!! and 0.25% Cholesterol.
| Proximate Analysis | Control-Chow (SDS.3) | Proximate Analysis | High-Fat Diet (4032.05) |
|---|---|---|---|
| Moisture (%) | 10.00 | Moisture (%) | 5.74 |
| Crude Oil (%) | 4.25 | Crude Fat(Bovine Lard) (%) | 24.00 |
| Crude Protein (%) | 22.39 | Crude Protein (%) | 21.44 |
| Crude Fiber (%) | 4.21 | Crude Fiber (%) | 6.16 |
| Minerals | 7.56 | Minerals | 2.25 |
| Nitrogen Free Extract | 51.20 | Nitrogen Free Extract | 36.19 |
| -------- | ------- | Cholesterol | 0.25 |
| TOTAL | 99.61 | TOTAL | 96.03 |
| Measured Energy byBomb calorimetry [kJ/g dm] | 16.86 | Measured Energy byBomb calorimetry [kJ/g dm] | 21.46 |
Table 1. Food constitution of the mice chow: Normal-chow for the Control group (Special Diet Services, SDS No.3, Witham, UK; n=6) and the High-fat Diet (Arie Blok, food-code 4032.05, Woerden, The Netherlands; n=6) based on 24.0% bovine lard and 0.25% Cholesterol.
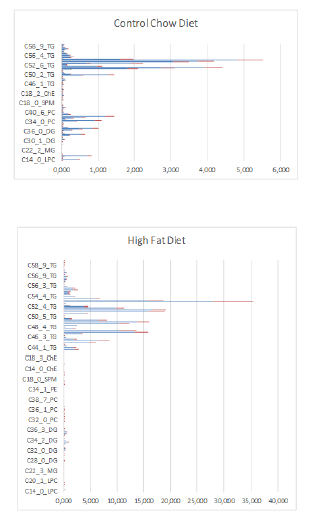
In Figure 10 are factor spectra of Excell LC-MS data of a Control-chow (Special Diet Services, SDS No.3, Witham, UK) and a High-fat diet (Arie Blok, food-code 4032.05, Woerden, The Netherlands) depicted.
Figure 10: Factor spectrum of dietary lipid composition of mouse feeds determined by LC-MS techniques of a Control group with a fat content based on vegetable oil of 4.25% (Special Diet Services, SDS No.3, Witham, UK) and a High-fat diet with a fat content based on 24.0% bovine lard and 0.25% Cholesterol (Arie Blok, food code 4032.05, Woerden, The Netherlands). Blue is mean value of 6 samples and Red is Standard Deviation of 6 samples for Control-Chow diet and a High-Fat Diet. The Diet contained approximately the same caloric content: Control-Chow 17 kJ/ g dm versus High-Fat diet 21 kJ/ g dm.
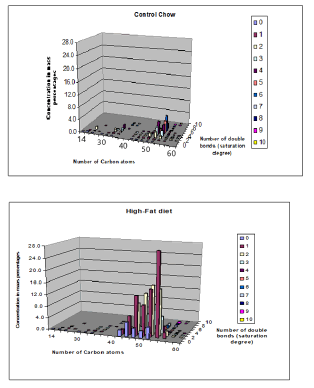
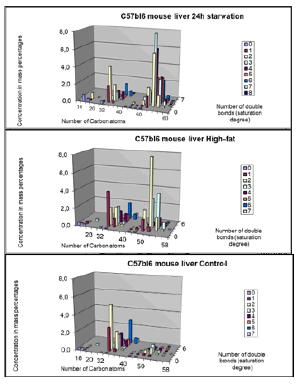
While in figure 11, 3D-images are depicted of Control and High-Fat diet for ([ Carbon atoms]≈ X-axis; [ double bonds] = saturation degree≈ Z-axis and [Concentration] ≈ y-axis).
14-22 C atoms: lyso-phosphatidylcholines
32-40 C atoms: phosphatidylcholines
46-60 C atoms: triacylglycerols
The total fat composition of the two diets is summarized in Table 2.
| Food composition for the mouse groups | ||||
|---|---|---|---|---|
| Control Chow | High-Fat diet | T-test | Change (%) | |
| LPC | 1.241 ± 0.226 | 0.279 ± 0.052 | 0.000*** | 22.48 |
| MG | 0.003 ± 0.000 | 0.004 ± 0.001 | 0.090* | 133.33 |
| DG | 2.758 ± 0.596 | 2.719 ± 0.531 | 0.907 | 98.59 |
| PC | 4.018 ± 0.810 | 0.336 ± 0.016 | 0.000*** | 8.36 |
| PE | 0.231 ± 0.055 | 0.094 ± 0.006 | 0.002** | 40.69 |
| SPM | 0.053 ± 0.016 | 0.101 ± 0.006 | 0.000*** | 190.57 |
| Che | 0.193 ± 0.020 | 0.043 ± 0.004 | 0.000*** | 22.28 |
| TG | 30.300 ± 4.612 | 191.913 ± 41.810 | 0.000*** | 633.38 |
| EPA | 0.0227 ± 0.0041 | 0.000364 ± 0.00023 | 0.00001*** ↓ | 1.61 |
| DHA | 0.0397 ± 0.00497 | 0.00936 ± 0.00031 | 0.00001*** ↓ | 2.36 |
| AA | 0.00729 ± 0.000863 | 0,00000 | - ↓ | - |
| DHG | 0.02642 ± 0.003734 | 0.000248 ± 0.00019 | 0.00001*** ↓ | 0.937 |
| ω 6/ ω 3 | 28.73 ± 21.007 | 4.03 ± 2.032 | 0.0168** ↓ | 14.017 |
Table 2: Summarized relative concentration of the different lipid compounds in the two different mouse foods: Control Chow (n=5, Mean ± SD); High-Fat diet (n=5, Mean ± SD). Trivial name of lipid compound and abbreviation: Lyso-phosphatidylcholines (LPC), Monacylglycerols (MG), Diacylglycerols (DG), Phosphatidylcholines (PC), Phosphatidylethanolamine (PE), Sphingomyelins (SPM), Cholesteryl-esters (ChE) and Triacylglycerols (TG). Measured values of Eicosapentaenoic acid (EPA, C20:5), Docosahexaenoic acid (DHA, C22:6), Arachidonic acid, (AA, C20:4), and di-homo-γ-linolenic acid (DHG, C20:3) and the involved enzymes will be discussed in the text. Omega 6 / Omega 3 ration = C18:2 n6/C18:3 n3 or Linoleic acid (LA) / α-linolenic acid (ALA).
From figures 10 & 11 and table 2 we can clearly see that in the High-Fat diet mainly the increase of the TG’s accounts for the increase in fat composition (TG’s increase with 633%). If we summarize the total lipid content (no unit: relatively measured with LC-MS), we find for the Control Chow vs. High-Fat diet a value of 38.8 vs. 195.5 respectively (table 2). So, we can calculate that the increase in ∑(lipid) in% in the High-Fat diet is 503.8 %. We also calculated the Saturation Index for the two different diets given in table 3. There is no general tendency linked to a specific lipid compound. Some lipid compounds are responsible for an increase of the saturation degree (increase C:0 compounds in the numerator) like: LPC C:18, DG C:34, DG C:36, PC C:32, PC C:34, SPM C:24, TG C:44, TG C:46, TG C:50 and TG C:52. Others are responsible for a decrease of the Saturation Degree (decrease C:0 compounds in the numerator) like: LPC C:16, DG C:28, PE C:34, ChE C:16, SPM C:18 and TG C:48. From these observations (table 3) we conclude that the number of lipid compounds in the High-Fat diet have a higher Saturation Degree and that the relative percentages are extremely higher in comparison to the lipid compounds which decrease the Saturation Degree. So, we conclude that the Saturation Degree of the High-Fat diet is higher in comparison to the Control Chow diet. The most important PUFAs from the elongase / desaturase array all decreased strong significantly in the High-fat diet induced by bovine lard.
| Lipid Compound | C atoms | Control Chow (n=5)(mean ± SD, in %) | High-Fat (n=5)(mean ± SD, in %) | Δ HF/Co(δ %) | P-value |
|---|---|---|---|---|---|
| LPC | C:16 | 4274.39 ± 1824.95 | 2785.34 ± 251.17 | 65.16 ↓ | 0.102 |
| C:18 | 1.58 ± 0.133 | 3.89 ± 1.251 | 246.20 ↑ | 0.006** | |
| DG | C:28 | 1196.71 ± 465.554 | 220.61 ± 40.310 | 18.43 ↓ | 0.004** |
| C:30 | 212.29 ± 37.403 | 219.61 ± 6.244 | 103.45 | 0.655 | |
| C:32 | 114.45 ± 10.800 | 108.72 ± 1.849 | 94.99 | 0.254 | |
| C:34 | 2.14 ± 0.167 | 19.97 ± 0.433 | 933.18 ↑ | 0.000*** | |
| C:36 | 0.224 ± 0.028 | 6.34 ± 0.373 | 2830.36 ↑ | 0.000*** | |
| PC | C:32 | 96.90 ± 4.012 | 260.48 ± 12.415 | 268.81 ↑ | 0.000*** |
| C:34 | 0.894 ± 0.167 | 13.95 ± 0.636 | 1560.40 ↑ | 0.000*** | |
| PE | C:32 | 30.31 ± 2.853 | 40.04 ± 18.179 | 132.10 | 0.249 |
| C:34 | 11.77 ± 2.30 | 3.84 ± 2.483 | 32.63 ↓ | 0.000*** | |
| SPM | C:18 | 279.27 ± 132.693 | 102.33 ± 36.035 | 36.64 ↓ | 0.021* |
| C:24 | 7.68 ± 1.570 | 441.48 ± 123.959 | 5748.43 ↑ | 0.000*** | |
| ChE | C:16 | 101.08 ± 45.733 | 36.07 ± 30.345 | 35.68 ↓ | 0.018* |
| C:18 | 79.14 ± 5.843 | 82.09 ± 11.404 | 103.73 | 0.589 | |
| TG | C:44 | 76.85 ± 3.773 | 95.34 ± 2.596 | 125.22 ↑ | 0.000*** |
| C:46 | 29.54 ± 3.761 | 60.10 ± 7.647 | 203.45 ↑ | 0.000*** | |
| C:48 | 19.48 ± 0.824 | 12.61 ± 1.873 | 64.73 ↓ | 0.000*** | |
| C:50 | 0.85 ± 0.064 | 7.97 ± 1.754 | 937.65 ↑ | 0.000*** | |
| C:52 | 0.11 ± 0.020 | 8.84 ± 3.301 | 8036.36 ↑ | 0.001** |
Table 3:Saturation degree: [(C-atoms with double bonds) / (C-atoms with single bonds)]*100% calculated for the different feed (Control Chow vs. High-Fat diet) for seven lipid components: LPC, DG, PC, PE, SPM, ChE and TG. An increase ( ↑) is more saturated a decrease ( ↓) is more unsaturated. Saturation degree calculated according.
From table 3 we can see from the (δ %) between the High-Fat diet and the Control Chow diet that ten compounds are strongly saturated ( ↑) while six compounds are to some extent more unsaturated ( ↓). So, we conclude based on these observations that the High-Fat diet is in general more saturated.
C57bl6 Mouse model
The brain contains about 100 billion brain cells interrelated by axons and dendrites leading electrical impulses coding for information from or to the periphery. Lipids cover about 60% of the brain’s dry weight making brain tissue the second most lipid-dense tissue after adipose tissue.
Besides cholesterol, phospholipids are the main lipid component of the neurons. Phospholipids (PL) are phosophodiesters linked to a base, in the brain usually ethanolamine, as phosphatidylethanolamine (PE). PE binds two different types of fatty acids, namely unsaturated (Palmitic acid (C16:0, ω -9; PA) and Stearic acid (C18:0, ω -9; SA) ) and polyunsaturated fatty acids (Arachidonic acid (C20:4, ω -6; AA) and Docosahexaenoic acid (C22:6, ω -3; DHA).
The fatty acid pattern differs inside the brain with different concentrations in the gray and white matter. The gray matter, localised to the grain cortex with mainly brain cells, contains more saturated fatty acids and Docosahexaenoic acid (C22:6, ω -3; DHA) compared to the white matter. The white matter is located in the sub-cortical region and contains more Oleic acid (C18:1, ω -9; OA) and Docosatetraenoic acid (C22:4, ω -6; DTA). The myelin sheet covering the nerve axon, is very rich in polyunsaturated fatty acids (PUFAs) which helps conduction of electrical impulses along the axons. This conductivity is about 50 times higher compared to unmyelinated axons. Degenerative diseases of the myelin sheat such as Multiple-Sclerosis may therefore cause serious neurological defect.
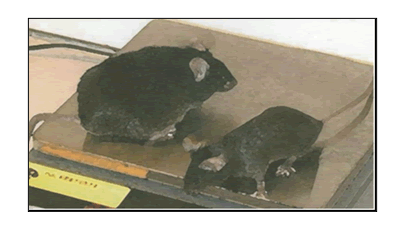
Lipids play a key role in determining membrane fluidity, and changes in lipid and fatty acids composition have been reported to alter important cellular functions. We hypothesize that a High-fat diet may have functional and structural consequences in the brain. In order to investigate these important questions, we used a mouse model after a period of 24 hours starvation or 40 days of High Fat diet in comparison to a Control group (Control chow). A photo of an obese versus a lean C57bl6 individual mouse are given on a weigher (figure 12).
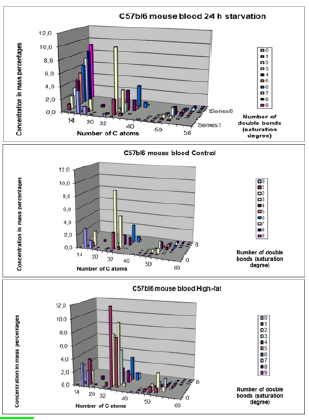
a). 24h starvation (top); b). Control-chow diet (middle); c). High-fat diet (bottom).
Data obtained byLC-MS measurements (for each group mean (n=6-7 animals) ± STD). Clearly visible is that there are mainly three lipid compounds:
14-22 C atoms: Lysophosphatidylcholines
32-40 C atoms: Phosphatidylcholines
46-60 C atoms: Triacylglycerols
a). 24h starvation (top); b). Control-chow diet (middle) c). High-fat diet (bottom).
Data obtained byLC-MS measurements (for each group mean (n=6-7 animals) ± STD). Clearly visible is that there are mainly three lipid compounds:
14-22 C atoms: Lysophosphatidylcholines
32-40 C atoms: Phosphatidylcholines
46-60 C atoms: Triacylglycerols
With LC-MS techniques -as earlier described in §1- we measured the major lipid fraction in the whole brain of this C57bl6 mouse model. We investigated with LC-MS techniques, measuring approximately 109 lipid compounds, in mouse brain after 24 hours of starvation and a High-fat diet if brain lipid composition changed. We measured Cholesteryl-esters (ChE), Lyso-phosphatidylcholines (LPC), Phosphatidylcholine (PC), Sphingomyelin (SPM), Triacylglycerols (TG) and Plasmalogens for brain tissue (figure 15).
Figure 15: Chromatogram of the whole brain of a C57bl6 mouse out of the Control group. Three groups of chemical compounds can be clearly distinguished in this figure: A): after 9-11 minutes retention time the Lysophosphatidylcholines (LPC) become visible with at 11.5 minutes the Internal Standard di-lauroyl-phoshatidylcholine (IS); B): after 13-16 minutes the Plasmalogens, Phosphatidylcholines (PC), Sphingomyelins (SPM) and Phosphatidylethanolamines (PE) become visible; and C): after 18-19 minutes the Triacylglycerols (TGs) and Cholesteryl-esters (ChE).
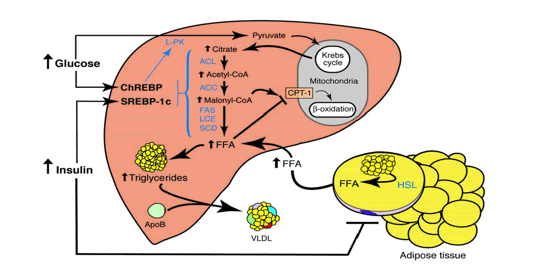
In the experimental design a juvenile Male C57bl6 mice (age 8-12 weeks) were exposed to three treatments: A: They were fed a Control-chow diet (for a period of approximately 40 days (Control group) (SDS.3, Special Diet Services, Witham, UK) containing about 4.3 energy percent fat (Table 1).; B: They were fed a High-fat diet, containing 0.25% cholesterol (Ch) and 24% energy from bovine lard for a period of approximately 40 days model until they became Insulin Resistant (IR). The High-fat diet consisted out of 21.4 % protein, 36% carbohydrates, 24% fat, 6% fibers and 5.7% water (weight-percentages). Before the experiment started animals of both the Control-chow group and the High-fat diet treatment group received unrestricted amounts of food and water. The diet contained approximately the same caloric content: Standard 17 kJ/ g dm versus fatty diet 21 kJ/ g dm (Table 1). C: Or they were exposed to 24 hours of starvation. The C57bl6 mice strain was used as it has extensively been studied as model of control of environmental induced starvation and the determination of blood composition with the lipid blood transport proteins as described earlier in a metabolic chapter related to the global “Hunger-Obesity paradox” and is depicted in figure 1.
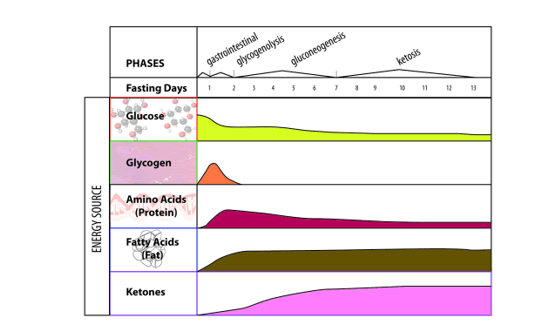
Under fed conditions carbohydrates are burned to generate ATP and the surplus of carbohydrates are converted into fatty acids, which are stored as TG in adipose tissue. When starvation occurs in an animal, there are many physiological changes as the animal attempts to satisfy its energy requirements. At the cellular level, catabolism continues to supply the substances required for anabolism and to continue vital functions. Reserve stores of nutrients are utilized. Energy is generated from the utilization of proteins, fats, and carbohydrates. The most readily usable material, the carbohydrate glycogen, is utilized first. However, the energy derived from glycogen stored in the liver and is exhausted within a few hours. This is followed by stored fat from the various subcutaneous deposits, around the kidney, and in the mesentery and omentum tissue. Fat deposits in the parenchymatous organs are utilized next. The last area of the body to lose its fat deposits is the marrow of the bones. The final source of energy available is the protein comprising the cytoplasm of the cells.
When glucose availability is low during periods of starvation, the TG stored in the adipose tissue are hydrolyzed to free fatty acids (FFA's) and mobilized into plasma to reach the liver where they play a major role in energy production. In the liver, the in-fluxed fatty acids are oxidized by the b-oxidation system, leading to the production of acetyl coenzyme A (acetyl-CoA), which then condenses with itself to form ketone bodies. Ketone bodies generated in the liver are transported out of the liver to serve as fuels for other tissues such as the skeletal-, cardiac- and brain tissue during starvation.
When not used for b-oxidation in mitochondria, FFA’s can undergo re-esterification into TG, that can subsequently be deposited in the cytoplasm of the hepatocyte (hepatic steatosis). During starvation the liver represents the major sink of fatty acids in the form of TG. The fat constitution and composition of the liver after a period of starvation is largely unknown. We hypothesize that the concentration of lipid compounds in the liver has been changed, quantitatively and qualitatively, due to the rearrangement and repartitioning of the adipose stores.
The liver takes up free fatty acids (FFA) from plasma, which are transported by lipoproteins as triacylglycerols (TG). Lipoproteins are water-soluble protein complexes, which consist of a hydrophobic core, containing triacylglycerols (TG) and cholesterol esters (CE), and a hydrophilic monolayered shell, composed of phospholipids (PL), free cholesterol (FC), and specific proteins (apolipoproteins).
Five major classes of lipoproteins can be distinguished in blood plasma, such as chylomicrons, very low-density lipoproteins (VLDL), medium-density lipoproteins (IDL), low density lipoproteins (LDL) and high-density lipoproteins (HDL).
These proteins have their own specific function VLDL protein transport triacylglycerols and cholesterol from the liver for redistribution to different tissues, while HDL is involved in a process referred to as reverse cholesterol transport. In this process, HDL absorbs the cholesterol from peripheral tissues and then transports it to the liver for excretion. LDL represents the end product of VLDL catabolism and is the major cholesterol-transporting lipoprotein in plasma.
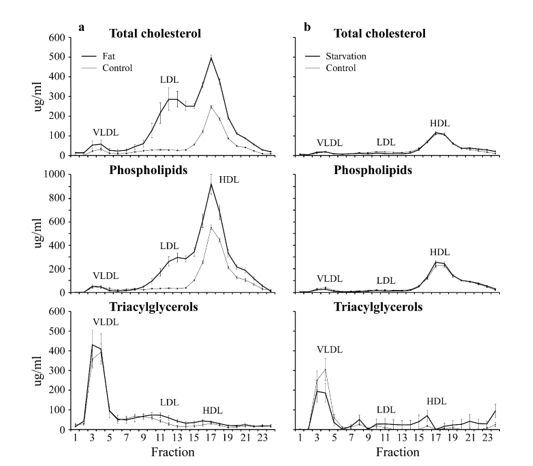
In figure 17 are the Lipoprotein distribution-profiles of a C57bl6 mouse model depicted with on the left the effect of a High-fat diet on Cholesterol-, Phospholipids- and Triacylglycerols levels in plasma and the effect on the distribution of those lipids over different lipoproteins in plasma while this is the case on the right for the same Lipoprotein distribution-profiles of a 24 hours C57bl6 starvation rodent group.
Figure 17: Lipoprotein distribution-profiles. Effect of starvation and a High-fat diet on Cholesterol-, Phospholipids- and Triacylglycerols levels in plasma and the effect on the distribution of those lipids over different lipoproteins in plasma. Fractions 3-7 represent: Very Low-Density Lipoproteins (VLDL) fractions 8-15: Low Density Lipoproteins (LDL) and fractions 15-19 represent High Density Lipoproteins (HDL) (Mean ± SD). Number of animals Control A (n=6), Treatment A (n=6), Control B (n=6), Treatment B (n=7).
Five major classes of lipoproteins can be distinguished in blood plasma (figure 17), such as chylomicrons, very low-density lipoproteins (VLDL), medium-density lipoproteins (IDL), low density lipoproteins (LDL) and high-density lipoproteins (HDL). these proteins have their own specific function VLDL protein transport triacylglycerols and cholesterol from the liver for redistribution to different tissues, while HDL is involved in a process referred to as reverse cholesterol transport. In this process, HDL absorbs the cholesterol from peripheral tissues and then transports it to the liver for excretion. LDL represents the end-product of VLDL catabolism and is the major cholesterol-transporting lipoprotein in plasma.
| Blood-parameter | Control A | Treatment A | P-value |
|---|---|---|---|
| 6 mice | 6 mice | ||
| Insulin (ïg/l) | 0.41 ± 0.24 | 0.36 ± 0.16 | P ≤ 0.679 n.s |
| Glucose (mmol/l) | 8.96 ± 0.19 | 4.96 ± 0.35 | P £ 0.0001*** |
| Phospholipids (ïg/ml) | 1885 ± 114 | 1632 ± 119 | P £ 0.004** |
| Free fatty acids (mmol/l) | 1.58 ± 0.16 | 1.47 ± 0.21 | P ≤ 0.338 n.s |
| Triacylglycerols (ïg/ml) | 943 ± 151 | 672 ± 82 | P £ 0.003** |
| Total Cholesterol (ïg/ml) | 877 ± 72 | 634 ± 52 | P £ 0.0001*** |
| Free Cholesterol (ïg/ml) | 205 ± 9.6 | 120 ± 8.8 | P £ 0.0001*** |
| Ketone-bodies | 0.447 ± 0.183 | 4.305 ± 0.460 | P £ 0.004** |
Table 4: Blood plasma parameters from the starvation experiment (Control A vs. Treatment A) (Means ± SD) (P ≤ 0.05 is significant).
| Blood-parameter | Control B | Treatment B | P-value |
| 6 mice | 7 mice | ||
| Insulin (ïg/l) | 0.25 ± 0.07 | 1.09 ± 0.89 | P £ 0.042* |
| Glucose (mmol/l) | 9.01 ± 0.12 | 9.2 ± 0.34 | P ≤ 0.352 n.s |
| Phospholipids (ïg/ml) | 1541 ± 187 | 3884 ± 500 | P £ 0.0001*** |
| Free fatty acids (mmol/l) | 1.54 ± 0.13 | 1.67 ± 0.23 | P ≤ 0.261 n.s |
| Triacylglycerols (ïg/ml) | 631.9 ± 103 | 723.9 ± 300 | P ≤ 0.491 n.s |
| Total Cholesterol (ïg/ml) | 802.2 ± 81.2 | 2309 ± 564.8 | P £ 0.0001*** |
| Free Cholesterol (ïg/ml) | 151.7 ± 29.3 | 508.5 ± 174.2 | P £ 0.0001*** |
| Ketone-bodies | Not determined | Not determined | Not determined |
Table 5: Blood plasma parameters from the High-fat diet experiment (Control B vs. Treatment B) (Means ± SD) (P ≤ 0.05 is significant)
A very important research topic -related to our measurement of the free FFA in blood plasma (NEFA pool; table 4 & 5)- is that there are indications this NEFA pool can directly fuel the brain. This research area is hardly investigated and the low use of long-chain, high-energy fatty acids (LCFAs) in the energy metabolism of the brain is not well understood. Therefore, it remains puzzling that hydrogen-rich fatty acids are poorly used as fuel in the brain. The longstanding belief that a slow passage of fatty acids through the blood-brain barrier could be the reason. However, this has been corrected by experimental results. Otherwise, accumulated non-esterified fatty acids or their activated derivatives may exert adverse activities on the mitochondria, which could cause the mitochondrial pathway of apoptosis.
Here we highlight three specific problems: (1) ATP generation linked to β-oxidation of fatty acids requires more oxygen than glucose, increasing the risk for neurons to become hypoxic (2) β-oxidation of fatty acids generates superoxide, which, together with the poor antioxidant defenses in neurons, causes severe oxidative stress (3) the rate of generating ATP from fatty tissue derived fatty acids is slower than that using blood glucose as a fuel. So, in periods of prolonged continuous and rapid neuronal firing, fatty acid oxidation cannot guarantee rapid ATP generation in neurons. It is suspected that the drawbacks associated with using fatty acids as fuel have caused evolutionary pressure to reduce the expression of the β-oxidation enzyme equipment in the brain mitochondria to prevent extensive fatty acid oxidation and glucose oxidation in the brain.
Unlike the brain, other organs with a high energy turnover, such as the heart and kidneys, largely oxidize fatty acids.
The route of non-esterified fatty acids from the blood to the mitochondrial breakdown in the brain is as follows. After dissociation of albumin-bound non-esterified fatty acids (NEFA) from albumin, NEFA migrates across the blood-brain barrier (BBB). NEFA neural cells then enter and are activated to form acyl CoA derivatives in the cytosolic compartment.
In the activated form, NEFA supports the biosynthesis of membrane lipids or the re-acylation of LysoPhosphatidylcholine (LPC)-lipids. Alternatively, β-oxidation of acyl-CoA derivatives in the mitochondria provides the reducing equivalents nicotinamide adenine dinucleotide (NADH) and flavin adenine dinucleotide (FADH2) for feeding the electron transport chain (ETC), which generates the electrochemical proton gradient for energy-dependent ATP synthesis. CO2 and H2O are ultimately formed as degradation products of the β-oxidation of acyl-CoA derivatives.
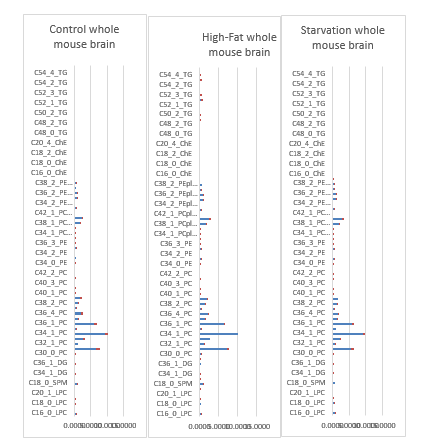
Figure 18: Factor-spectrum mean ± std of a C57bl6 whole mouse brain of a Control-chow group (n=5), a 40 days High-Fat diet group (n=5) and a 24 h starvation (n=5) C57bl6 rodent group.
Figure 18 shows factor spectra of whole mouse brain (strain C57bl6), a Control group, High-fat diet group and 24-hr Starvation group. What is immediately noticeable is that the most important lipid fraction is the Phosphatidylcholines and the Plasmalogens lipid fraction.
Although the functions of plasmalogens have not yet been fully elucidated, it has been demonstrated that they can protect mammalian cells against the damaging effects of reactive oxygen species. In addition, they have been implicated as being signalling molecules and modulators of membrane dynamics
Furthermore, it is noticeable -in comparison with post-mortem human neocortex- that in the Control group and 24-hr Starvation group of whole mouse brain nearly no Triacylglycerols are detected. An important result -and major theme of this review- is the observation that Triacylglycerols (VLCFAs) are observed in the mouse whole brain in the 40-day High Fat diet-induced Insulin Resistant obese C57bl6 mouse model. The described HF-diet with 24.0% bovine lard resulted in a highly significant increase of Lyso-phosphatidylcholine, a preferred carrier as a by-product of PUFAs through the blood-brain barrier. This latest study with rodent models is indicative that Fatty acids (FAs) can pass the Blood Brain Barrier (BBB).
These important observations were found by happenstance and possibly gave an indication of the role of bovine lard in human encephalization during course of evolution.
Furthermore, it is extremely important to notice that the High-Fat diet consisted for 24% out of bovine lard. From this results we came to our evolutionary model that the African Buffalo Syncerus caffer could have played as most abundant herbivores grazer at the African savannah the most important role in human brain encephalization. This is our first observation of diet induced brain growth or 'encephalization' in a mouse model. This observation has been discussed in another document and in the discussion section of this manuscript.
| Mouse-model C57bl6Whole mouse brain using LC-MS | COMean(std) | HFMean(std) | STARVMean(std) | T-TestCO-HF | T-TestCO-STARV | T-Test HF-STARV |
|---|---|---|---|---|---|---|
| Palmitic acidC16:0 | 0.003(0.0004) | 0.005(0.0013) | 0.004(0.0009) | P≤0.03* | P≤.0.016* | P≤0.251 |
| PalmitoleateC16:1 | 0.006(0.0009) | 0.010(0.0030) | 0.006(0.0003) | P≤0.029* | P≤0.0618 | P≤0.036* |
| Stearic acid (C18:0; ω -9; SA) C18:0 | 0.015(0.0009) | 0.016(0.0031) | 0.016(0.0012) | P≤0.176 | P≤0.059 | P≤0.957 |
| Oleic acidC18:1 | 0.023(0.0018) | 0.031(0.0054) | 0.025(0.0026) | P≤0.019* | P≤0.087 | P≤0.066 |
| Linoleic acid [C18:2, ω -6] (LA) | 0.004(0.0018) | 0.009(0.0035) | 0.005(0.0014) | P≤0.040* | P≤0.371 | P≤0.080 |
| Dihomo-γ-Linolenic acid[C20:3, ω -6] (DGLA) | 0.001(0.0004) | 0.003(0.0012) | 0.001(0.0003) | P≤0.010* | P≤0.096 | P≤0.023* |
| Arachidonic acid[C20:4, ê¥-6] (ARA) | 0.011(0.0042) | 0.020(0.0044) | 0.014(0.0024) | P≤0.011* | P≤0.268 | P≤0.030* |
| Docosahexaenoic acid[C22:6, ω -3] (DHA) | 0.005(0.0019) | 0.007(0.0012) | 0.007(0.0013) | P≤0.039* | P≤0.036* | P≤0.923 |
Table 6: Comparison between a Control (CO), High-Fat (HF) diet and 24 h Starvation (STARV) C57bl6 mouse model whole mouse brain for Cholesteryl-ester (ChE) lipid fractions of the elongase /desaturase array. All three groups 5 individuals.
In Table 6 are in whole mouse brain -with exception of Myristic acid (C14:0)- all MUFAs present: Palmitic acid (C16:0), Palmitoleate (C16:1), Stearic acid (C18:0; ω -9; SA) (C18:0) and Oleic acid (C18:1). And for the PUFAs the ω -6 members such as Linoleic acid (C18:2, ω -6) LA, Dihomo-γ-Linolenic acid (C20:3, ω -6) DGLA, Arachidonic acid (C20:4, ω -6) ARA and the important ω -3 ‘fish oil’ Docosahexaenoic acid (C22:6, ω -3) DHA. In the comparison Control-High Fat Diet are all earlier mentioned lipids -with exception of the MUFA Stearic acid (C18:0; ω -9; SA) (C18:0) (P≤0.176)- significantly different. In addition, in the comparison Control-Starvation all earlier mentioned lipids -with exception of the MUFA Palmitic acid (C16:0) Acid (P≤0.016*)- are not significantly different. Furthermore, in the comparison for the MUFAs in the comparison High-Fat Diet - Starvation are -with exception of Palmitoleate (C16:1) (Annex 2), which is significantly different (P≤0.036*)- all lipid comparisons not significantly different. For the earlier mentioned two PUFAs in the comparison High Fat Diet vs. Starvation the following observations are significantly different Dihomo-γ-Linolenic acid (C20:3, ω -6) DGLA and Arachidonic acid (C20:4, ω -6) ARA with respectively (P≤0.023*) and (P≤0.030*). The other measured PUFAs Linoleic acid (C18:2, ω -6; LA) and Docosahexaenoic acid (C22:6, ω -3; DHA) are not significantly different.
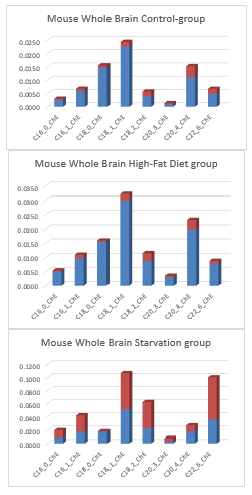
We were one of the first who measured by LC-MS measurements PUFAs in whole mouse brain. From these observations we can clearly see in figure 19 that the MUFAs have a slow ascending order from Palmitic acid (C16: 0) towards Oleic acid (C18: 1) for the Control and High-Fat diet group. For the starvation group solely Oleic acid (C18:1) is with a large standard deviation the largest compound. For the PUFAs for Control and High-Fat diet group Arachidonic acid (C20:4, ω -6; ARA) is the largest compound while again for the starvation group with large standard deviation the ω -3 PUFA Eicosapentaenoic acid (C20:5, ω -3; EPA) has the highest value.
Solely one very recent LC-MS study measured eicosanoids and PUFAs in liver and brain, like we earlier performed for PUFAs in liver and brain, This 2019 study at whole mouse brain also observed the eicosanoids (eicosatetraenoic acids (ETEs), 11,12-epoxyeicosatrienoic acid (11,12-EET), 12-hydroxyeicosapentaenoic acid (12-HEPE), and 12-hydroxyheptadecatrienoic acid (12-HHT) where the major brain lipid fraction together with PUFAs -ARA arachidonic acid, DHA docosahexaenoic acid, DHET dihydroxyeicosatrienoic acid, DHGLA dihomo-γ-linolenic acid, EET epoxyeicosatrienoic acid, EPA eicosapentaenoic acid, ETE eicosatetraenoic acid, HEPE hydroxyeicosapentaenoic acid, HETE hydroxyeicosatetraenoicAcid, HHT hydroxyheptadecatrienoic acid, HODE hydroxyoctadecadienoicAcid, HpETE hydroperoxyeicosatetraenoic acid, LA linoleic acid,α-/γ-LAα-/γ-linolenic acid. PGF2α prostaglandin F2α, TxB2thromboxane B2- in whole mouse brain.
Figure 19: Biomarkers from the Cholesteryl-ester (ChE) fraction based on LC-MS-measurements at whole mouse brain for three different groups: a). Control Chow; b). High-Fat Diet; 24 h Starvation. Oleic acid [C18:1] is the major Mono-unsaturated Fatty acid (MUFA) and can based on measured arbitrary amounts [dimensionless] (table 1), be indicated as a biomarker for this ChE major lipid class. Per group depicted the Mean ± Std of 5 individuals. Blue colour is ‘Mean’ while red colour is ‘Standard Deviation’.
Table 7: Enzymatic activity calculated based on product-precursor ratio following the elongase-desaturase array as depicted in the previous figure 19 for the Cholesteryl fraction measured by LC-MS-techniques of C57bl6 mouse whole brain material.
| Enzymatic Activity | Control (n=5) Mean ± std | High-Fat(n=5)Mean ± std | 24h-starvation(n=5)Mean ± std | CO-HFP-value | CO-STARVP-value | HF-STARVP-value |
|---|---|---|---|---|---|---|
| C14/16 elongase | 51.21 ± 12.711 | 10.76 ± 4.443 | 65.86 ± 12.216 | P≤0.0011* | P≤0.090 | P≤0.0001*** |
| C16:1/C16:0 SCD1, â??9 desaturase | 2.66 ± 0.532 | 8.71 ± 1.233 | 2.37 ± 0.412 | P≤0.0.0001*** | P≤0.363 | P≤0.0001*** |
| Hexadecadienoic acid/ palmitoleateC16:2/C16:1 | 0.020 ± 0.002 | 0.015 ± 0.001 | 0.015 ± 0.004 | P≤0.0042** | P≤0.0475* | P≤0.865 |
| C18:0/C16:0Elongase ELOVL1,3,6 | 4.444 ± 0.789 | 2.136 ± 0.7777 | 8.655 ± 2.189 | P≤0.0016** | P≤0.010* | P≤0.0015** |
| C18:1/C18:0Stearoyl-CoA desaturase, SCD5, â??9 desaturase | 25.237 ± 4.495 | 76.354 ± 23.246 | 23.234 ± 2.658 | P≤0.0071** | P≤0.422 | P≤0.007** |
| C18:2/C18:1‘Chilling enzyme’â??12-desaturase | 10.752 ± 0.889 | 1.803 ± 0.104 | 7.892 ± 1.186 | P≤0.0001*** | P≤0.0031** | P≤0.0003*** |
| C18:3/C18:2â??6 desaturase | 0.031 ± 0.001 | 0.089 ± 0.004 | 0.030 ± 0.003 | P≤0.0.00001*** | P≤0.3841 | P≤0.00001*** |
| C20:3/C18:3C18/20 elongase | 1.046 ± 0.092 | 3.234 ± 0.674 | 1.234 ± 0.256 | P≤0.0017** | P≤0.1830 | P≤0.0014** |
| C20:4/C20:3â??5-desaturaseD5D or FADS1 | 12.751 ± 0.629 | 3.988 ± 0.833 | 15.377 ± 1.262 | P≤0.00001*** | P≤0.0062** | P≤0.00001*** |
| C20:5/C20:4â??17-desaturase | 0.425 ± 0.016 | 0.094 ± 0.031 | 0.209 ± 0.051 | P≤0.0.00001*** | P≤0.0.0004*** | P≤0.0039** |
| C22:6/C20:5C20/22 elongase & â??4-desaturase | 0.903 ± 0.043 | 3.759 ± 0.925 | 1.612 ± 0.312 | P≤0.0013** | P≤0.0066**. | P≤0.0047** |
Table 9: Enzymatic activity calculated based on product-precursor ratio following the elongase-desaturase array as depicted in the previous Figure for the Cholesteryl fraction measured by LC-MS-techniques on collected C57bl6 mouse blood plasma material.
In conjunction with the “â??12-desaturase chilling enzyme theory for protection of the brain”, in adult humans, 18F-FDG-PET/CT scans have identified active Brown Adipose Tissue (BAT) depots in the cervical, supra-clavicular, axillary, and paravertebral regions. From an evolutionary point of view, BAT around the neck of adult humans and non-human primates may evolve to protect the brain by warming up the blood supplied to the brain.
Very Long Chain Fatty acids (VLC-FAs) in a C57bl6 mouse model with “brain steatosis”.
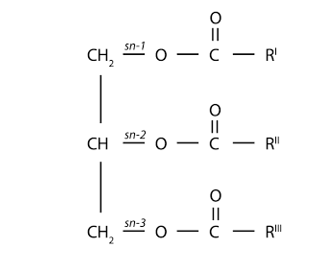
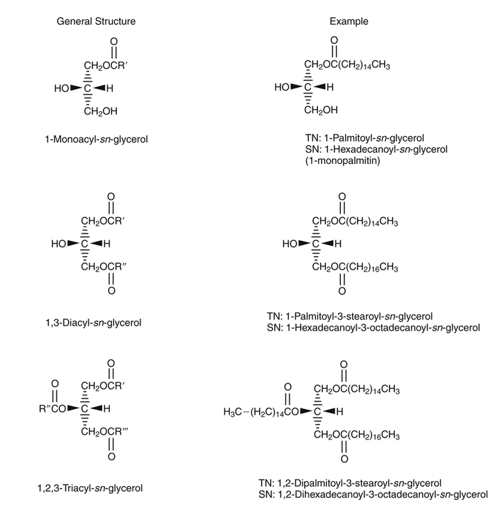
Mono-, Di-, Triacylglycerols: The structural organization of fatty acids in food and in the body is mainly determined by the binding to glycerol by ester bonds. The reaction of a hydroxyl group of glycerol, in one of its three groups, with a fatty acid lead to a mono-acyl glycerol. The coupling of a second fatty acid, which may be similar or different to the existing fatty acid, gives rise to a diacylglycerol. If all three hydroxyl groups of glycerol are linked by fatty acids, then this is a triacyl glycerol (figure 22).
Figure 22: Triacylglycerol (TG) molecule with glycerol backbone and stereospecific numbering of sn-1, -2 and -3. In the small intestine, ’pancreatic lipase’ catalyses the hydrolysis of dietary triacylglycerols to 2-monoacylglycerols by removing fatty acids from the sn-1 and sn-3 positions. The 2-monoacylglycerol molecule is further hydrolysed to release the last fatty acid from the sn-2 position (87. Wang et al 2013).
Monoacyl glycerols, by having free hydroxyl groups (two), are relatively polar and therefore partially soluble in water. Various monoacyl glycerols linked to fatty acids of different lengths are used as emulsifiers in the food and pharmaceutical industries. The less polar diacyl glycerides that have only one free hydroxyl group are less polar than monoacyl glycerols and less soluble in water. Finally, triacyl glycerols, which do not lack any free hydroxyl groups, are completely non-polar, but highly soluble in non-polar solvents, which are often used for their extraction from vegetable or animal tissues, since they constitute the energy reserve in these tissues. Diacyl glycerides and monoacyl glycerols are important intermediates in the digestion and absorption process of fats and oils in animals. In turn, some of these molecules also perform other metabolic functions, such as diacylglycerols that can act as "second messengers" at the intracellular level and also form part of the composition of a new generation of oils that are nutritionally designed as "low-calorie oils". When glycerol forms mono-, di- or triacylglycerols, the carbon atoms are not chemically and structurally equivalent. Thus, carbon 1 of the glycerol is referred to as carbon (a) or sn-1 (from "stereochemical number"); carbon 2 is referred to as carbon (β) or sn-2 and carbon 3 as (γ) or sn-3. It is important to note that the "sn" notation is currently used the most. This spatial structure (or conformation) of mono-, di-, triacylglycerols is relevant in the digestion process of fats and oils. Figure 23 shows the structure of a monoacyl glycerol, a diacyl glycerol and a triacyl glycerol, indicating the "sn" notation.
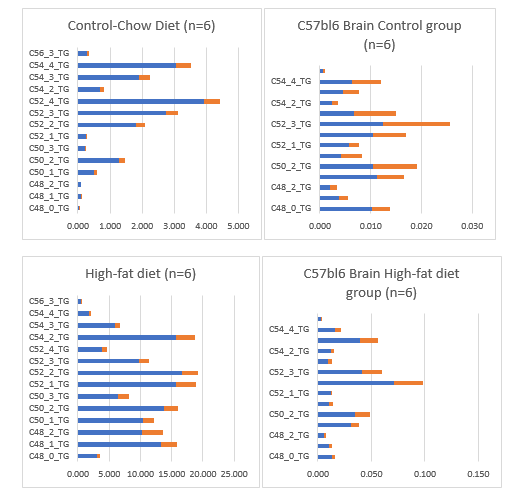
Because an important part of this review is related to the observation in a juvenile C57bl6 mouse model raised for 40 days at a High-fat diet based on bovine lard 24% with 0.25% cholesterol (table 1) which resulted in the accumulation of very long chain fatty acids (VLCFAs) with large amounts of unsaturated TGs C50:1; C:50-2; C:52-2; C:54-3; C:54-4 and C:56-3 TGs might have played a role in mammalian encephalization in the whole brain of this mouse model (figure 24).
This observation was found by serendipity and in this review part-3 we will attempt to explain this important observation of "brain steatosis" in a mouse model, to our awareness never observed before. In the human brain, just as in the retina, VLC-PUFA is esterified at the sn-1 position of the glycerol backbone of PC, with saturated, mono-Unsaturated and LC-PUFA molecules that take the sn-2 position. They are also present in neutral lipids, primarily in cholesteryl esters, with smaller amounts in the non-esterified FA and triacylglycerols. The monounsaturated FA in the brain are mainly n7 and n9 isomers with the double bond in the cis configuration. The concentration of C24 - C38 VLC-PUFA in brain sphingomyelin increases during development. Significant amounts of SPM? (C34:4, ω 6) and (C36: 4, ω 6) have been found in rat brains, although Docosahexaenoic acid (C22: 6, ω -3; DHA), Adrenic acid (C24: 4, ω -6; AA) and Tetracosahexaenoic acid (C24: 6, ω -3) are the most common PUFA. The healthy human brain also contains (C30 - C38, ω -6) with (C34: 4, ω -6) and (C34: 5, ω -6) as the major VLC-PUFA. Developmental and age-dependent changes in composition and concentration of this FA occur in both brains of rats and humans. VLC-PUFA exists at relatively higher concentrations in the brains of young rats and humans, in which (C34: 4, ω -6) and (C34: 5, ω -6) predominate, but are replaced by (C36: 4, ω -6) in adults. Glycerophospholipids containing C28-C32 saturated and monounsaturated FA, as well as cerebrosides and sulfatides containing VLC-FA, have been found in bovine brains. Age-dependent increases in both saturated and monounsaturated C24 - C28, including Pentacosanoic acid (C25: 0; PA) and (C25: 1), have been found in cerebrosides, gangliosides, sphingomyelin and total FA in the developing brain of rabbits. It has been suggested that these developmental changes are due to specific incorporation of this FA into myelin lipids. Neonates' brains are capable of prolongation and desaturation [1-14C] (C26: 4, ω -6) to C28 - C36 tetraenoic and C26 - C38 pentaenoic VLC-PUFA that can undergo peroxisomal β-oxidation.
Fatty acids with greater than 22 carbon atoms (very-long chain fatty acids, VLCFA) are present in small amounts in most animal tissues including human brain. Saturated and monoenoic VLCFA are major components of brain.
Our High-fat diet based on 24% bovine lard with 0.25% cholesterol were composed of VL-CFAs and because mitochondria are unable to oxidize VLCFA because they lack a specific VLCFA coenzyme A synthetase, -the first enzyme in the βâ?oxidation pathway it is logical we found an accumulation in the C57bl6 mouse brain within one generation (tabel 10).
VLCFA accumulate in the tissues of patients with inherited abnormalities in peroxisomal assembly like we will describe for the mutation ‘adrenoleukodystrophy’ in Darwin part 4 of this series or in peroxisome-deficient Zellweger’s syndrome brain. In the latter mutation polyenoic VLCFA are present in the neutral lipids predominantly in cholesteryl-esters (ChE), with smaller amounts in the non-esterified fatty acid (NEFA) and triacylglycerol fractions (TGs). It has been postulated that the polyenoic VLCFA may play an important role in normal brain and accumulate in Zellweger syndrome brain because of a deficiency in the peroxisomal β-oxidation pathway, although a possible peroxisomal role in the control of carbon-chain elongation cannot be discounted
But it is also observed in individuals with defects in enzymes catalysing individual reactions along the βâ?oxidation pathway.
It is our general believe that the accumulation of VLCFA in brain of early hominids at the African savannah -which had Syncerus caffer as prey animal-is the ultimate evolutionary mechanism in order to explain human brain encephalization ‘the mysteries of mysteries’ along the lineage from Homo erectus towards Homo sapiens. However, little is known of the role of VLCFA in normal cellular processes, and of the molecular basis for their contribution to the human brain encephalization and increase of intelligence. Biosynthesis of VLCFA occurs by carbon chain elongation of shorter chain fatty acid precursors while βâ?oxidation takes place, almost exclusively in peroxisomes.
The origin of the ‘brain steatosis’ remains puzzling. Clearly visible is an accumulation in the TGs fraction. The n -6 tetra- and pentaenoic fatty acids with carbon chain lengths > 32 found in normal brain are located predominantly in a separable species of phosphatidylcholine.
A similar phospholipid is found in increased amounts in the brain of peroxisome-deficient (Zellweger's syndrome) patients, but the fatty acid composition differs in that penta- and hexaenoic derivatives predominate. Our data strongly suggest that the polyenoic very long chain fatty acids are confined to the sn-1 position of the glycerol moiety, while the sn-2 position is enriched in saturated, monounsaturated and polyunsaturated fatty acids with < 24 carbon atoms. In a rodent model of rat brain Polyenoic VLCFA phosphatidylcholine in neonatal rat brain is enriched with ω -6 pentaenoic and ω -3 hexaenoic VLCFA with up to 36 carbon atoms whereas the corresponding phospholipid in adult rat brain mainly contains ω -6 tetraenoic and ω -3 pentaenoic VLCFA with up to 38 carbon atoms which appears to be predominantly confined to nervous tissue in rats.
Only one study with domestic cats (feline) was comparable to our rodent study and gave also an indication of VLCFA accumulation in the brain after feeding meat for a six-month period. This also from evolutionary perspectives exciting report demonstrates that â??6-desaturase activity does exist in the feline. The liver produced deuterium-labelled polyunsaturated fatty acids up to (C22:4; ω -6) and Docosapentaenoic acid (C22:5, ω -3; DPA). The brain was found to accumulate the deuterium-labelled polyunsaturated fatty acids, i). Osbond Acid (C22:5, ω -6; OA); ii). Docosahexaenoic acid (C22:6, ω -3; DHA; iii). C24:4 ω -6; iv). C24:5 ω -6; v). Tetracosapentaenoic acid (C24:5 ω -3; TPA) and vi). Tetracosahexaenoic acid (C24:6, ω -3; THA). These products exactly correspond to these of Sprecher’s shunt, very earlier in detail described in this review manuscript (figure 4).
- So, this is an exciting discovery that in another nutritional intervention diet (meat for six months to domestic cats), than in our nutritional intervention experiment with a High Fat diet based on bovine lard (24%) and 0.5% Cholesterol these had a similar impact on the brain development with the deposition of VLCFA like these of the Sprechers shunt (figure 4).
- The study of gave awareness of the importance of the liver-brain axis (table 11; figure 28), so I will evaluate and reconsider again my LC-MS data from liver tissue obtained from this C57bl6 mouse model raised for 6 weeks at a High-Fat diet with 24% Bovine Lard.
In a C57BL6 mouse model fed for 40 days a High-Fat diet based on 24% bovine lard we found in the HF diet group (n=7) significant increased levels of the ω -6 PUFAs Linoleic acid (C18:2, ω -6; LA); Arachidonic acid (C20:4, ω -6; ARA), the MUFA Palmitoleic (C16:1) Acid (C16:0), the SFA Oleic acid (C18:1) (Table 11; figure 24). This is a clear indication the ω -6 pathway is followed via the non-EFA unsaturated fatty acid of the ω -7 family Palmitoleic acid (C16:1) via â??9 desaturase activity towards the SFA of the ω -9 family Oleic acid (C18:1) via â??12 desaturase activity towards the ω -6 family Linoleic acid (C18:2, ω -6; LA), and further the ω 6 route towards the inflammatory Arachidonic acid (C20:4, ω -6; ARA). However, no EPA or DHA could be detected which was the case in the study of the liver produced deuterium-labelled polyunsaturated fatty acids up to (C22:4; ω -6) and Docosapentaenoic acid (C22:5, ω -3; DPA).
| PUFA | Control-Chow (n=6) | High-Fat diet (n=7) | P≤0.05 | |
|---|---|---|---|---|
| Palmitoleic acid (C16:1, ω -7) | 0.009 ± 0.004 | 0.070 ± 0.024 | 0.00007*** | |
| â??9 desaturase | 6.39 ± 2.354 | 1.130 ± 0.185 ↓ | 0.00068*** | |
| Oleic acid (C18:1, ω -9) | 0.036 ± 0.005 | 0.263 ± 0.005 | 0.00004*** | |
| â??12 desaturase | 0.750 ± 0.056 | 3.359 ± 0.361 ↑ | 0.0001*** | |
| Linoleic acid (C18:2, ω -6) | 0.049 ± 0.008 | 0.078 ± 0.019 | 0.00594** | |
| â??6 + â??5 desaturase | 0.478 ± 0.081 | 0.181 ± 0.048 ↓ | 0.00004*** | |
| Arachidonic acid (C20:4, ω -6) | 0.017 ± 0.004 | 0.045 ± 0.008 | 0.00001*** |
Table 11 Pre-trajectory in the liver elucidating the liver-brain axis of VLCFA’s deposition in the brain after a nutritional intervention of a High-Fat diet C57bl6 mouse model raised for 6 weeks on a HF-diet with 24% bovine lard.
Conclusions and Perspectives: “Explore the mysteries of mysteries, the unexplained evolutionary mechanism behind the overgrown human brain”, data of a supportive C57bl6 mouse model.
The Savanna Dry Land (SDL) hypothesis assumes that the African savannah would have supplied all nutritional elements and other chemical compounds to explain the uniqueness of the human brain with its overgrown neocortex. On the other side of this scientific paradigm we have the ≈60-year-old 'Aquatic Phase Hypothesis' (APH) or Hardy / Morgan hypothesis which states that our ancestors are evolutionary and have entered a water phase. The followers of the APH evolution model ask the SDL supporters for a biochemical explanatory model for large human brains.
Here we will provide this biochemical model based on LC-MS measurements of a juvenile High Fat (HF) -diet obese C57bl6 mouse model, raised on bovine fat-mainly unsaturated fatty acids with very long chains (VLC-FA; C48-C56 Triacylglycerols, (TGs)) - that accumulate throughout the brain. The described HF-diet with 24.0% bovine lard resulted in a very significant increase of Lyso-phosphatidylcholine, a preferred carrier as a by-product of PUFAs through the blood-brain barrier. This latest study with rodent models is indicative that Fatty acids (FAs) can pass the Blood Brain Barrier (BBB). These important observations were found by happenstance and possibly gave an indication of the role of bovine lard in human encephalization during the course of evolution.
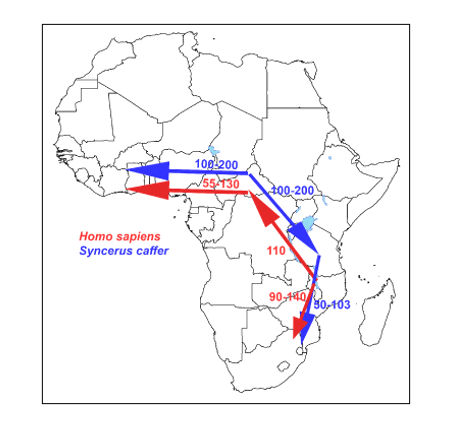
Secondly, the similarity of migration routes of early African bovines -ancestors of Syncerus caffer (based on mitochondrial DNA studies)- and early hominids (hunter-prey correlation; figure 31) which gave us supportive evidence for the “Out of Africa” hypothesis. This map earlier published in gave awareness of a hunter-prey correlation.
Here we present the 'African Buffalo Savannah hypothesis' ('ABS hypothesis') that provides strong evidence that the meat and bovine lard of early buffalo herds of the African buffalo on the African savannah in the Pleistocene had such a specific biochemical composition that they could have been the evolutionary driving force for encephalization of the early hominids. Another finding that supports the 'ABS hypothesis' is the previously published map of migration routes of early African cattle (ancestors of Syncerus caffer) and early hominids -hunter versus prey correlation- that provides us with supporting evidence for the 'ABS hypothesis'.
The African buffalo Syncerus caffer is the most common herbivore of the African savannah. This ruminant can go on the vast African savannah with 'biomes' of thousands of square kilometers. This African savannah mainly from West Africa to South Africa can contain herds of the enormous Cape buffalo of up to a thousand animals weighing between 400 and 800 kg each. See enclosed map -figure 31- with the corresponding migration routes between ancestors of African buffalo and early hominids.
Figure 31: Similarity of migration routes of early hominids with those of the African buffalo (Syncerus caffer) –hunter-prey correlation- which most likely expanded and diverged in the late to middle Pleistocene (145,000 to 449,000 years ago), from an ancestral population located around the current-day Central African Republic with the Cape buffalo undertaking successive colonization events from Eastern toward Western and Southern Africa.
The specific molecular structure of bovine lard could have played a role in the encephalization of early hominids and early Homo sapiens during course of evolution which was confirmed by the characteristic biochemical composition of bovine lard and meat of the African buffalo (Syncerus caffer).
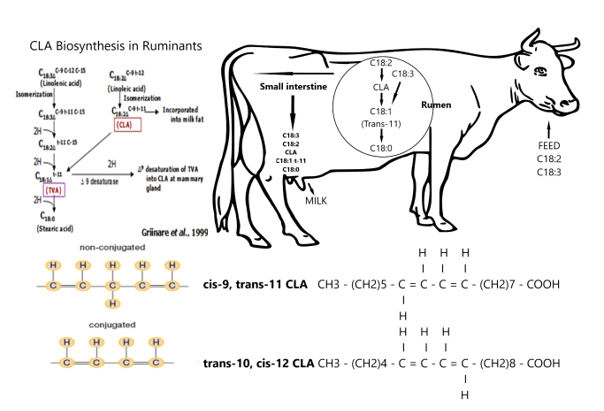
So, we hypothesize, a large ruminant of the African savannah possibly played a prominent role in the evolution of the human brain (figure 29). From figure 29 we can see Rumenic acid plays a central role in our evolutionary hypothesis with a central role of the largest herbivorous (and ruminant) of the African savannah Syncerus caffer. In the rumen Conjugated Linoleic Acid (CLA) LA is a mixture of positional and geometric isomers of Linoleic Acid (C18: 2, ω -6; LA) for which the predominant isomer is Rumenic acid, a cis-9 trans-11 isomer. In order to understand the ‘driving forces’ behind our SDL-hypothesis we have to understand the metabolic pathways and in general terms the ‘metabolism’ of Rumenic acid (see figure 29 & 30).
Meat products from ruminants contain relatively high concentrations of CLA (0.5–1.5% of the total fatty acids), while meat from simple stomach animals is a poor source (0.1–0.2% of the total fatty acids). CLA has been shown to regulate energy metabolism and energy redistribution in a range of animals, significantly reducing body fat while increasing lean body mass. As previously shown, the major isomer of CLA in ruminant products is 18: 2 cis-9, trans-11 (rumen acid) (see figure 29). The metabolism of rumen acid is as follows: β-oxidation, both in mitochondria and in peroxisomes, is the major metabolic fate of CLA, discussed here with the example of Rumenic acid (cis9, trans11-linoleic acid; ω 7; RA) (Figure 30). Enoyl-CoA isomerase (ECI) moves the double bond to the 2 position. Of the three isomerases, ECI is the most preferred for this reaction. Completion of this round of β- oxidation generates the saturated intermediate octanoyl-CoA and three more rounds complete the breakdown of rumen acid into nine 2-carbon fragments. The acetyl-CoA units released with each cycle continue to be used throughout the Krebs cycle. Like other long chain fatty acids, CLA can be modified by extending the chain length and adding double bonds. The 18: 3, 20: 3 and 20: 4 derivatives have been found in adipose tissue. In particular, the arachidonic acid analogues can preferably be incorporated into phospholipids. The 20 carbon metabolites can also give rise to eicosanoid-like compounds like Eicosatrienoic acid (C20:3, ω -3; ETrA) and Eicosatetraenoic acid (C20:4, ω -3; ETA) with at present unknown properties.
Next, we have to explain in our ‘ABS’ biochemical model: how the two important ω 3 ‘fish-oils’ PUFAs EPA (C20:5, ω -3) and DHA (C22:6, ω -3) are produced by the African buffalo? How significant amounts of TGs are produced for the developing human brain?
The African buffalo forage at the African savannah and have access to seed material from both grasses such as African bromegrass grass (Bronus biebersteinii) and higher savannah vegetation. The most important fatty acid of grass meadow is the α-linolenic acid (C18: 3, ω 3; ALA, while the seed material is usually a rich source of linoleic acid (C18: 2, ω 6; LA). LA is during isomeration reactions due to microbiome in the rumen converted into isomer cis-9, trans-11 conjugated linoleic acid (CLA) which is reduced to Vaccenic acid (C18:1, ω -7; VA) fatty acid. In the next stage VA is changed into Stearic acid (C18:0; ω -9; SA). For LNA via biohydrogenation a similar pattern is observed by isomeration reaction, followed by a sequence of reductions and ends with the formation of Stearic acid (C18:0; ω -9; SA) (C18:0). In the tissues Δ-9 desaturate converts the Stearic acid (C18:0; ω -9; SA) (C18:0) into C18:1 (Oleic acid). These C:18 MUFAs are required as a FA ‘tail’ for the glycerol C-backbone in order to produce VLCFAs (TGs). After leaving the rumen, the free fatty acids (FFAs) from the food and bacteria particles are desorbed by lysolecithin and bile salts. The micelles are formed and taken up by the epithelial cells of the jejunum. The FFAs are released from the small amounts of triacylglycerols and glycolipids that reach the intestines. The metabolism of fatty acids in the human body is then started. However, despite the described conversions of the two EFAs in the rumen, ruminants may have the ability to dehydrogenate and extend linoleic acid (C18: 2, ω -6; LA) (C18: 2, ω -6; LA) in Docosahexaenoic acid (C22: 6, 1-3; DHA). The main PUFA in the meat of Syncerus caffer was docosapentaenoic acid (C22: 5, ω 3; DPA). Conversion of docosapentaenoic acid (C22: 5, ω -3, DPA) towards the important brain ‘fish oil’ DHA (22: 6, ω -3) was earlier suggested by â??4 desaturation activity in these species. However, this â??4 desaturation model has been replaced by another biochemical model with a role for peroxisomes via the path nowadays also known as the "Sprecher path". So, the biohydrogenation of Docosahexaenoic acid (C22: 6, 3-3; DHA) of eicosapentaenoic acid (C20: 5, ω -3; EPA) follows the shunt of Sprecher in the perixosome. These PUFA conversion routes in the tissues of the African buffalo including its feed, needs to be confirmed by robust LCMS measurements.
By describing our ‘ABS hypothesis’ in this way to the proponents of the APH, we have provided the required biochemical model for supportive action of the SDL hypothesis with which the encephalization of the human brain purely with molecular building materials from the African savannah can be explained. An outline of targeted experiments related to this topic is given in table 12.
Recently I made a literature search what conditions a high-fat diet induced mouse model with "brain steatosis" (overgrown brain) must meet in terms of dietary conditions, age, gender and other experimental conditions before it is effective and doesn't lead to inflammation of the brain tissue. This example, related to ‘brain steatosis’ in a mouse model, clearly defines the conditions for a driving force "up" the evolutionary ladder for "encephalization", (as a counterpart to the second law of thermodynamics that everything falls back into chaos (entropy)). The behavior / high-fat diet studies listed in table 12 are only a limited representation of the available literature. Just like a small laboratory setting how ‘evolution’ could work with its so mystified ‘favorable traits’, here clearly defined, for natural selection. For a more extensive overview of literature, see the review of. However, table 12 provides sufficient experimental design information to initiate the process of evolutionary encephalization, in combination with a positive effect on behavior in some very incidental cases. General speaking, a high-fat diet results in inflammatory responses in the brain such as ceramide generation, β-amyloid accumulation, as well as neural apoptosis under the insulin resistant conditions. This can be prevented by following the experimental design as in our mouse model (were found by happenstance):
- For example, to choose a young growing mouse model 6 weeks old ;
- Only take males because the estrogenic component has an inflammatory effect;
- Do not expose the experimental animals to a high-fat diet for too long, for example, until this young mouse model has become insulin resistant (IR) after 40 days
- Not to take extremely high fat concentrations like 121. Morrison et al 2010 & 122. Pistell et al 2010 performed in their experimental design with 41% fat, but instead chose intermediate levels for example 24% fat
- Take not just a high-fat diet with any composition but more specific consisting of bovine lard with the following biochemical peculiarity with especially high levels of Arachidonic acid (C20: 4, ω -6; ARA) and Docosapentaenoic acid (C22: 5, ω -3; DPA) for which the need for this is described in detail in;
- Use a high-fat diet containing a high amount of unsaturated very long chain poly unsaturated fatty acids (VLCPUFAs) such as performed in our high-fat diet but also in the study of
- Adding compound like a type 2 diabetes (T2DM) drug -such as Liraglutide- that helps the lipids pass through the blood brain barrier (BBB)
- Administration of brain inflammation inhibitors such as melatonin.
- Because different saturated fatty acids (FAs) but also several mono unsaturated fatty acids (MUFAs) such as Palmitic acid (C16:0; PA), Myristic acid (C14:0; MA), and Lauric acid (C12:0; LA) have a blood plasma cholesterol raising potential and cholesterol is a major constituent of the human neocortex, the high-fat diet should also contain cholesterol, like in our formulated diet 0.25% cholesterol.
- In addition, oral intake of EPA: DHA at a ratio of 6: 1 by middle-aged rats for one week improved age-related endothelial dysfunction in both the femoral artery and vein and has possibly a stimulating effect at blood vessel formation which is an important evolutionary trait for human brain encephalization.
Briefly summarized, we hypothesize all these ten research variables should result in a better memory performance and cognitive functioning in these rodent models (table 12). Reflecting it towards the evolutionary sciences, “the ladder up” or are these ten preconditions (‘favorable traits’) just a matter of staggering incomprehensible statistics (chances to meet each other) or more comprehensible algorithmic mathematics (a set of rules that precisely defines a sequence of operations)? Or nevertheless the hand of a “Benevolent Supreme Being”? It can be defined as the complexity (≈Adonai) behind the complexity (≈evolution). Bringing together all these favorable traits, in a countless series of ‘breedings’ and ‘eatings’, together it finally resulted in the overgrown brain of Homo sapiens of 1500 cm3 at the eastern-African savannah
So, in summary, going back to our small evolutionary laboratory setting, review-like (table 12). Most high-fat diets based on a westernized eating profile results in brain inflammation. Only under specific high-fat conditions which are mainly based on bovine lard given to a juvenile rodent model containing many unsaturated FAs we have indications of ‘brain steatosis’ without brain inflammation together with improved cognitive function.
If these mouse models with "brain steatosis" are a reflection of what happened to the first hominids about 2.4 million years ago in the East African savannah, then it is amazing that precisely those biochemical conditions occurred in terms of lipid composition of the meat of prey animals - especially the ancestors of the African buffalo (Syncerus caffer) - which enabled human brain growth. And by this we can explain the exponential growth spurt of Homo habilis with its 800 cm3 brain to that of modern man Homo sapiens with its 1500 cm3 brain.
| Study | Type HF-diet exposure | Rodent model | Behavioural Changes | Source | |
|---|---|---|---|---|---|
| 1). | High saturated fat diet; 20% (w/w) fat (lard) | Long-Evans rats | Learning and memory impairment | 131.Greenwood & Winocur 1990 | |
| 2). | Fructose & High-fat diet induced IR | Middle-aged Rats | Impaired hippocampal synaptic plasticity and cognition | 132.Stranahan et al 2008 | |
| 3). | High-fat diet induced obesity3 weeks to 9-12 months | Mice C57bl/6J | Metabolic alterations and deficits of learning and hippocampal synaptic plasticity | 133.Hwang et al 2010 | |
| 4). | Western diet (41% fat) & very high fat lard diet (60% fat) | Aged mice, 20-month old male C57BL/6 | Increased hippocampal oxidative stress and cognitive impairment implications for decreased Nrf2 signalling | 121. Morrison et al 2010; | |
| 5). | Western diet (41% fat) & very high fat lard diet (60% fat) | Mice C57BL/6 | Cognitive impairment associated with brain inflammation | 122. Pistell et al 2010; | |
| 6). | High-fat dietary-induced obesity & IR for 20 days | Four weeks administration of Liraglutide in young Swiss TO mice | Improves memory and learning as well as glycaemic control | 134. Porter et al 2010 | |
| 7). | High-fat diet (45 kcal% from fat) vs. Control (10 kcal% from fat) | Mice C57BL/6J | Impair spatial learning in the radial-arm maze | 135.Valladolid-Acebes et al 2011; | |
| 8). | High-fat diet;Control (10% fat) vs. HF (45% fat) | Juvenile Swiss TO Mice (6-8 weeks old) | Actions of incretin metabolites on locomotor activity, cognitivefunction and in vivo hippocampal synaptic plasticity | 134. Porter et al 2012; | |
| 9). | a). Moderately high-fat (MHF) of 35%; b). Obesity resistant lean mice; c) Genetic model of obesity (MC4R). | Mice C57BL6/J(MHF) for 6 months | Olfactory ability and object memory | 136. Tucker et al 2012 | |
| 10). | High-fat diet-induced obesity:HF: (524 kcal per 100 g feed); Co: (346.8 kcal per 100 g feed) | Male C57BL/6J mice (6 weeks old) | Impairment of fear-conditioning responses and changes of brain neurotrophic factors (BDNF and NT-3 content in the brain and | 137. Yamada-Goto et al 2012 | |
| 11). | High-fat diet induced obese IR 24% bovine lard and 0.25% cholesterol | Juvenile mouse (6 weeks) C57bl6 | LCMS determined “Brain steatosis” no behavioural testsPerformed | 37.;38, van Ginneken et al 2011, 2017 | |
| 12). | Very high-fat diet (60% kcal by fat) for 17 days; moderate high fat diet (HFD, 45% kcal by fat) for 8 weeks | Juvenile C57BL/6J male 8 weeks mice | Deleterious effects on synaptic integrity and cognitive behaviour | 138. Arnold et al 2014 | |
| 13). | High-fat diet (HFD) 25% total fat including 11% unsaturated; Control 5% total fat including 2% unsaturated | Adult male Wister rats 160-200 g | Consumption of high-fat diet (HFD) induces oxidative stress in the hippocampus thatleads to memory impairment. Melatonin has antioxidant and neuroprotective effects. | 139. Alzoubi et al 2018 |
Table 12: Behavioural changes in rodent models after exposure to a high-fat diet.
In this manuscript we have described a mouse model with excessive brain growth (encephalization). This unique composition of this high-fat diet with 24% bovine lard and 0.25% cholesterol. We need besides the nutritional conditions tabulated in table 12 and resulting either in brain inflammation either brain growth, a test after several generations for improved cognitive functioning. This is from evolutionary perception extremely important to investigate so that in addition to encephalization (an increase in brain mass) there is also an increase in intelligence (IQ), which was the case with the first hominids to the current Homo sapiens. In addition, these two dietary fat conditions -24% bovine lard & 0.25% cholesterol- can also be given to rats because they are much more intelligent than mice and there can be tested for improved cognitive functioning e.g. increased intelligence or memory with the two choice Maze-test.
In conjunction with our observation of excessive brain growth in our C57bl6 mouse model raised for 6 weeks on an 24% bovine lard & 0.25% cholesterol high-fat diet a similar observation was performed at domestic cats (feline) fed excessive meat for a period of 6 months also resulted in VLCFA accumulation in the brain.
Meat has been considered as extremely important in human brain encephalization (from Homo habilis towards Homo erectus towards Homo sapiens. Meat fat comprises mostly monounsaturated (MUFAs) and saturated fatty acids, with Oleic (C18:1), Palmitic (C16:0), and Stearic acid (C18:0; ω -9; SA) being the most ubiquitous. Meat and meat products are considerable sources of cholesterol in the diet so a high meat intake contributes to a higher than recommended total and saturated fat and cholesterol intake.
In an earlier study we observed at a High-fat diet induced obese C57bl6 mouse model with "overgrown brain" or “brain steatosis”, Here our observations are indicative that mainly unsaturated very long chain fatty acids (TGs) of the C: 50, C: 52 and C: 54 TGs fraction were accumulated in the HF-diet obese C57BL6 whole brain fraction and we found based on LC-MS techniques a close correlation with the nutritional composition of the HF diet with respect to these TGs of the HF feed diet (correlation coefficient r2 = 0.760 compared to control group r2 = 0.264) Thus, from these observations, we concluded that a juvenile rodent study in bovine-induced obesity exhibited an "overgrown brain", primarily through the accumulation of triacylglycerols (TGs). From these observations we suggested and proposed the hypothesis that the specific molecular structure of bovine lard with large amounts of unsaturated C: 50; C: 52 and C: 54 TGs could have played a role in the encephalization of mammals. As a follow-up to this study, our main interest in this study can be defined as similar observations are made in humans. We also described, via the principle of hunter-prey correlation, similarities in migration routes of the ancestors of the herds of the African buffalo (Syncerus caffer), mitochondrial-DNA studies) and these of early hominids (paleontological- & archaeological studies) So, in this paragraph we intend to find an explanation and most important try to unravel any mysteries related to the specific composition of bovine lard or meat in relation to the process of human encephalization.
Convinced by the importance of our observations of the lipid accumulation with a central role for the largest ruminant of the African savannah Syncerus caffer we hope by these observations to contribute to a valuable contribution to one of the most intriguing and complex questions in the biological sciences - what makes us human? The amount of brain mass that exceeds that of the body mass of an animal is called "encephalization". In studying so, modern analytical laboratory techniques - based on a system biology approach - according to modern analytical LC-MS biochemical techniques based on a lipidomics approach have never been applied in human evolution studies and can hopefully support archaeological and paleontological field observations.
Furthermore, in post-mortem brains from human donors, we found that Triacylglycerols (TGs) were the most important fraction in human brain neocortex (≈68,32% (CO) -75,97% (T2DM) white versus ≈75,96% (CO) -80,90% (T2DM) gray matter; table 7), suggesting the importance of this lipid fraction in brain encephalization (38. van Ginneken et al 2017).
We will further elaborate LC-MS data of brain donors of the “Netherlands Brain Bank” in the following “Darwin review-4” session.
| Common Name | Systematic Name | Structural Formula | Lipid Numbers |
|---|---|---|---|
| Propionic acid | Propanoic acid | CH3CH2COOH | C3:0 |
| Butyric acid | Butanoic acid | CH3(CH2)2COOH | C4:0 |
| Valeric acid | Pentanoic acid | CH3(CH2)3COOH | C5:0 |
| Caproic acid | Hexanoic acid | CH3(CH2)4COOH | C6:0 |
| Enanthic acid | Heptanoic acid | CH3(CH2)5COOH | C7:0 |
| Caprylic acid | Octanoic acid | CH3(CH2)6COOH | C8:0 |
| Pelargonic acid | Nonanoic acid | CH3(CH2)7COOH | C9:0 |
| Capric acid | Decanoic acid | CH3(CH2)8COOH | C10:0 |
| Undecylic acid | Undecanoic acid | CH3(CH2)9COOH | C11:0 |
| Lauric acid | Dodecanoic acid | CH3(CH2)10COOH | C12:0 |
| Tridecylic acid | Tridecanoic acid | CH3(CH2)11COOH | C13:0 |
| Myristic acid | Tetradecanoic acid | CH3(CH2)12COOH | C14:0 |
| Pentadecylic acid | Pentadecanoic acid | CH3(CH2)13COOH | C15:0 |
| Palmitic acid | Hexadecanoic acid | CH3(CH2)14COOH | C16:0 |
| Margaric acid | Heptadecanoic acid | CH3(CH2)15COOH | C17:0 |
| Stearic acid | Octadecanoic acid | CH3(CH2)16COOH | C18:0 |
| Nonadecylic acid | Nonadecanoic acid | CH3(CH2)17COOH | C19:0 |
| Arachidic acid | Eicosanoic acid | CH3(CH2)18COOH | C20:0 |
| Heneicosylic acid | Heneicosanoic acid | CH3(CH2)19COOH | C21:0 |
| Behenic acid | Docosanoic acid | CH3(CH2)20COOH | C22:0 |
| Tricosylic acid | Tricosanoic acid | CH3(CH2)21COOH | C23:0 |
| Lignoceric acid | Tetracosanoic acid | CH3(CH2)22COOH | C24:0 |
| Pentacosylic acid | Pentacosanoic acid | CH3(CH2)23COOH | C25:0 |
| Cerotic acid | Hexacosanoic acid | CH3(CH2)24COOH | C26:0 |
| Carboceric acid | Heptacosanoic acid | CH3(CH2)25COOH | C27:0 |
| Montanic acid | Octacosanoic acid | CH3(CH2)26COOH | C28:0 |
| Nonacosylic acid | Nonacosanoic acid | CH3(CH2)27COOH | C29:0 |
| Melissic acid | Triacontanoic acid | CH3(CH2)28COOH | C30:0 |
| Hentriacontylic acid | Hentriacontanoic acid | CH3(CH2)29COOH | C31:0 |
| Lacceroic acid | Dotriacontanoic acid | CH3(CH2)30COOH | C32:0 |
| Psyllic acid | Tritriacontanoic acid | CH3(CH2)31COOH | C33:0 |
| Geddic acid | Tetratriacontanoic acid | CH3(CH2)32COOH | C34:0 |
| Ceroplastic acid | Pentatriacontanoic acid | CH3(CH2)33COOH | C35:0 |
| Hexatriacontylic acid | Hexatriacontanoic acid | CH3(CH2)34COOH | C36:0 |
| Heptatriacontylic acid | Heptatriacontanoic acid | CH3(CH2)35COOH | C37:0 |
| Octatriacontylic acid | Octatriacontanoic acid | CH3(CH2)36COOH | C38:0 |
| Nonatriacontylic acid | Nonatriacontanoic acid | CH3(CH2)37COOH | C39:0 |
| Tetracontylic acid | Tetracontanoic acid | CH3(CH2)38COOH | C40:0 |
Annex 1: List of Saturated Fatty acids
| Name | Carbon Atoms and Double Bond Positions | Series | Location |
|---|---|---|---|
| Palmitoleate | 16:1;9 | ω 7 | Found in most fats |
| Oleate | 18:1;9 (cis) | ω 9 | Common in natural fats |
| Elaidate | 18:1;9 (trans) | ω 9 | Ruminant fats |
| Vaccenate | 18:1;11 | ω 7 | Formed by bacteria |
| Linoleate | 18:2;9,12 | ω 6 | Plants and animals |
| γ-Linolenate | 18:3;6,9,12 | ω 6 | Plants and animals (Derived from linoleate) |
| α-Linolenate | 18:3;9,12,15 | ω 3 | Fish oils |
| Eicosatrienoate (Dihomo γ-Linolenate) | 20:3;8,11,14 | ω 6 | Derived from dietary linoleate and γ-linolenate |
| Arachidonate (Eicosatetraenoate) | 20:4;5,8,11,14 | ω 6 | Animal phospholipids (Derived from Eicosatrienoate) |
| Timnodonate (Eicosapentaenoate) | 20:5;5,8,11,14,17 | ω 3 | Fish oils |
| Eruate | 22:1;13 | ω 9 | Mustard seed oil |
| Clupanodonate (Docosapentaenoate) | 22:5;7,10,13,16,19 | ω 3 | Fish oils, brain phospholipid |
| Cervonate (Docosahexaenoate) | 22:6;4,7,10,13,16,19 | ω 3 | Fish oils, brain phospholipid |
| Nervonate | 24:1;15 | ω 9 | Cerebrosides |
Annex 2: Naturally Occurring Unsaturated Fatty acids (a partial listing)
| Common name | Lipid number | Chemical name |
|---|---|---|
| Hexadecatrienoic acid (HTA) | 16:3 (n-3) | all-cis-7,10,13-hexadecatrienoic acid |
| α-Linolenic acid (ALA) | 18:3 (n-3) | all-cis-9,12,15-octadecatrienoic acid |
| Stearidonic acid (SDA) | 18:4 (n-3) | all-cis-6,9,12,15-octadecatetraenoic acid |
| Eicosatrienoic acid (ETE) | 20:3 (n-3) | all-cis-11,14,17-eicosatrienoic acid |
| Eicosatetraenoic acid (ETA) | 20:4 (n-3) | all-cis-8,11,14,17-eicosatetraenoic acid |
| Eicosapentaenoic acid (EPA) | 20:5 (n-3) | all-cis-5,8,11,14,17-eicosapentaenoic acid |
| Heneicosapentaenoic acid (HPA) | 21:5 (n-3) | all-cis-6,9,12,15,18-heneicosapentaenoic acid |
| Docosapentaenoic acid (DPA), Clupanodonic acid |
22:5 (n-3) | all-cis-7,10,13,16,19-docosapentaenoic acid |
| Docosahexaenoic acid (DHA) | 22:6 (n-3) | all-cis-4,7,10,13,16,19-docosahexaenoic acid |
| Tetracosapentaenoic acid | 24:5 (n-3) | all-cis-9,12,15,18,21-tetracosapentaenoic acid |
| Tetracosahexaenoic acid (Nisinic acid) | 24:6 (n-3) | all-cis-6,9,12,15,18,21-tetracosahexaenoic acid |
Annex 3: This table lists several different names for the most common omega−3 fatty acids found in nature.
| Common name | Lipid name | Chemical name |
|---|---|---|
| Linoleic acid (LA) | 18:2 (n−6) | all-cis-9,12-octadecadienoic acid |
| Gamma-linolenic acid (GLA) | 18:3 (n−6) | all-cis-6,9,12-octadecatrienoic acid |
| Calendic acid | 18:3 (n−6) | 8E,10E,12Z-octadecatrienoic acid |
| Eicosadienoic acid | 20:2 (n−6) | all-cis-11,14-eicosadienoic acid |
| Dihomo-gamma-linolenic acid (DGLA) | 20:3 (n−6) | all-cis-8,11,14-eicosatrienoic acid |
| Arachidonic acid (AA, ARA) | 20:4 (n−6) | all-cis-5,8,11,14-eicosatetraenoic acid |
| Docosadienoic acid | 22:2 (n−6) | all-cis-13,16-docosadienoic acid |
| Adrenic acid | 22:4 (n−6) | all-cis-7,10,13,16-docosatetraenoic acid |
| Osbond Acid | 22:5 (n−6) | all-cis-4,7,10,13,16-docosapentaenoic acid |
| Tetracosatetraenoic acid | 24:4 (n−6) | all-cis-9,12,15,18-tetracosatetraenoic acid |
| Tetracosapentaenoic acid | 24:5 (n−6) | all-cis-6,9,12,15,18-tetracosapentaenoic acid |
Annex 4: List of common Omega-6 fatty acids.
| Common name | Lipid name | Chemical name |
|---|---|---|
| Pinolenic acid | 18:3 (n-6) | (5Z,9Z,12Z)-octadeca-5,9,12-trienoic acid |
| Podocarpic acid | 20:3 (n-6) | (5Z,11Z,14Z)-eicosa-5,11,14-trienoic acid |
Annex 5: Other polyunsaturated fatty acids.
| Common name | Lipid name | Chemical name |
|---|---|---|
| hypogeic acid | 16:1 (n−9) | (Z)-hexadec-7-enoic acid |
| oleic acid | 18:1 (n−9) | (Z)-octadec-9-enoic acid |
| elaidic acid | 18:1 (n−9) | (E)-octadec-9-enoic acid |
| gondoic acid | 20:1 (n−9) | (Z)-eicos-11-enoic acid |
| mead Acid | 20:3 (n−9) | (5Z,8Z,11Z)-eicosa-5,8,11-trienoic acid |
| erucic acid | 22:1 (n−9) | (Z)-docos-13-enoic acid |
| nervonic acid | 24:1 (n−9) | (Z)-tetracos-15-enoic acid |
| ximenic acid | 26:1 (n−9) | ---- |
Annex 6: List of common Omega-9 fatty acids
| Common name | Lipid name | Chemical name |
|---|---|---|
| none | 12:1 (n−7) | 5-Dodecenoic acid |
| none | 14:1 (n−7) | 7-Tetradecenoic acid |
| Palmitoleic acid | 16:1 (n−7) | 9-Hexadecenoic acid |
| Vaccenic acid | 18:1 (n−7) | 11-Octadecenoic acid |
| Rumenic acid | 18:2 (n−7) | Octadeca-9,11-dienoic acid |
| Paullinic acid | 20:1 (n−7) | 13-Eicosenoic acid |
| none | 22:1 (n−7) | 15-Docosenoic acid |
| none | 24:1 (n−7) | 17-Tetracosenoic acid |
Annex 7: The monounsaturated omega-7 fatty acids have the general chemical structure CH3-(CH2)5-CH=CH-(CH2)n-CO2H.
| Conjugated fatty acids have two or more conjugated double bonds | ||
|---|---|---|
| Common name | Lipid name | Chemical name |
| Conjugated Linoleic acids (two conjugated double bonds) | ||
| Rumenic acid | 18:2 (n-7) | 9Z,11E-octadeca-9,11-dienoic acid |
| 18:2 (n-6) | 10E,12Z-octadeca-10,12-dienoic acid | |
| Conjugated Linolenic acids (three conjugated double bonds) | ||
| α-Calendic acid | 18:3 (n-6) | 8E,10E,12Z-octadecatrienoic acid |
| β-Calendic acid | 18:3 (n-6) | 8E,10E,12E-octadecatrienoic acid |
| Jacaric acid | 18:3 (n-6) | 8Z,10E,12Z-octadecatrienoic acid |
| α-EleoStearic acid (C18:0; ω -9; SA) | 18:3 (n-5) | 9Z,11E,13E-octadeca-9,11,13-trienoic acid |
| β-EleoStearic acid (C18:0; ω -9; SA) | 18:3 (n-5) | 9E,11E,13E-octadeca-9,11,13-trienoic acid |
| Catalpic acid | 18:3 (n-5) | 9Z,11Z,13E-octadeca-9,11,13-trienoic acid |
| Punicic acid | 18:3 (n-5) | 9Z,11E,13Z-octadeca-9,11,13-trienoic acid |
| Other | ||
| Rumelenic acid | 18:3 (n-3) | 9E,11Z,15E-octadeca-9,11,15-trienoic acid |
| α-Parinaric acid | 18:4 (n-3) | 9E,11Z,13Z,15E-octadeca-9,11,13,15-tetraenoic acid |
| β-Parinaric acid | 18:4 (n-3) | all trans-octadeca-9,11,13,15-tetraenoic acid |
| Bosseopentaenoic acid | 20:5 (n-6) | 5Z,8Z,10E,12E,14Z-eicosapentaenoic acid |
Annex 8: Conjugated fatty acids
| Conjugated double bonds |
| -C=C-C=C- |
References
- Gibbs RA, Weinstock GM, Metzker ML, Muzny DM, Sodergren EJ, Scherer S, et al. 2004 Genome sequence of the brown Norway rat yields insights in to mammalian evolution. Nat.;428:493â??521.
- Sollner JF, Leparc G, Hildebrandt T, Klein H, Thomas L, Stopka E, et al. 2017 An RNA-Seq atlas of gene expression in mouse and rat normal tissues. Sci Data.;4:170â??85.
- Shimoyama M, Smith JR, Bryda E, Kuramoto T, Saba L, Dwinell M. 2017 Rat genome and model resources. ILAR J.;58:42â??58.
- Shimoyama M, Laulederkind SJ, De Pons J, Smith JR, Tutaj M, Petri V, Hayman GT, et al. 2016 Exploring human disease using the rat genome database. Dis Model Mech.;9:1089â??95.
- Meek S, Mashimo T, Burdon T. 2017 From engineering to editing the rat genome. Mamm Genome.;28:302â??14.
- Tatreault M, Bareke E, Nadaf J, Alirezaie N, Majewski J. 2015 Whole-exome sequencing as a diagnostic tool: current challenges and future opportunities. Expert Rev Mol Diagn.;15:749â??60.
- Wang Q, Shashikant CS, Jensen M, Altman NS, Girirajan S. 2017 Novel metrics to measure coverage in whole exome sequencing datasets reveal local and global non-uniformity. Sci Rep.;7:885â??96.
- Yoshihara M, Saito D, Sato T, Ohara O, Kuramoto T, Suyama M. 2016 Design and application of a target capture sequencing of exons and conserved non-coding sequences for the rat. BMC Genomics.;17:593.
- Karolchik D, Barber GP, Casper J, Clawson H, Cline MS, Diekhans M, et al. 2014 The UCSC genome browser database: 2014 update. Nucleic Acids Res.;42:D764â??70.
- Li H, Durbin R. 2009 Fast and accurate short read alignment with burrows-wheeler transform. Bioinformatics.;25:1754â??60.
Open Access Journals
- Aquaculture & Veterinary Science
- Chemistry & Chemical Sciences
- Clinical Sciences
- Engineering
- General Science
- Genetics & Molecular Biology
- Health Care & Nursing
- Immunology & Microbiology
- Materials Science
- Mathematics & Physics
- Medical Sciences
- Neurology & Psychiatry
- Oncology & Cancer Science
- Pharmaceutical Sciences
