ISSN : 2321-2748
American Journal of Phytomedicine and Clinical Therapeutics
Panax Ginseng Extract Inhibits Triple Negative Breast Cancer Xenograft Tumor Growth in Immunodeficient Mice
Zhimin Tim Cao1,2*, Tao Zhang3,4,5* and Yahong Wang3
1Department of Pathology, SUNY Upstate Medical University, NY, USA
2USA Chengcheng Life Science Technology Institute, Inc, NY, USA
3Harbin ChengCheng Life and Material Research Institute, Harbin, China
4School of Materials Science and Engineering, Beihang University, Beijing, China
5School of Materials Science and Engineering, Zhengzhou University, Zhengzhou, China
- *Corresponding Author:
- Zhimin Tim Cao
Department of Pathology, SUNY Upstate Medical University, Syracuse, NY. USA
E-mail: USACCAO@gmail.com
Tao Zhang
School of Materials Science and Engineering, Beihang University, Beijing, China
E-mail: zhangtao@buaa.edu.cn
Received date: March 05, 2025, Manuscript No. IPAPCT-25-20301; Editor assigned date: March 07, 2025, PreQC No. IPAPCT-25-20301(PQ); Reviewed date: March 21, 2025, QC No. IPAPCT-25-20301; Revised date: March 28, 2025, Manuscript No. IPAPCT-25-20301(R); Published date: April 04, 2025, DOI: 10.36648/2321-2748.13.1.292
Citation: Cao ZT, Zhang T, Wang Y (2025) Panax Ginseng Extract Inhibits Triple Negative Breast Cancer Xenograft Tumor Growth in Immunodeficient Mice. Am J Phytomed Clin Ther Vol.13 No.1: 292.
Abstract
Background: Triple negative breast cancer (TNBC) is the most aggressive subtype of breast cancer with the worst prognosis. Treatments for patients with TNBC in early stage mainly include surgery in combination with chemotherapy, with or without radiation therapy. These treatments are often associated with side effects and some are severe. Alternative therapeutic agents for TNBC treatment are urgently needed. Panax Ginseng has been used as a traditional Chinese medicine, and its anti-cancer property is increasingly recognized.
Objective: This study was to investigate effects of Panax Ginseng extract in a form of drinking solution containing ultrafine particle of Ginseng powder on TNBC xenograft tumor growth.
Methods: TNBC xenograft tumors were developed by implanting MDA-MB-231-Luc cells into immunodeficient female nude mice. The mice (n=20) were sorted to four groups (5/group) and treated once-a-day without (as control) or with Panax Ginseng root extract (GRD) in drinking solution at doses of 3 mL (4.4 mg), 6 mL (8.8 mg) and 12 mL (17.6 mg) per kilogram body weight, respectively, for 27 days. The tumor volume in vivo was measured using a caliper and estimated by in vivo imaging analysis. The tumor mass dissected at terminal experiment was weighed using an analytical balance. Differential gene expression analysis was performed on the dissected tumors.
Results: Tumor growth reductions were observed in the GRD-solution treated mice in a dose-dependent manner. The high-dose (12 mL/kg) treatment reduced tumor volume to 6.8% of the control mice and showed a total inhibition of the tumor growth on the terminal experiment. Differential gene expression analysis revealed 475 up-regulated and 591 down-regulated genes (>1.5-foldchange, p<0.05) from the GRD-solution treated mice when compared to the control. Regulatory effect analysis based on the gene expression data suggested a prediction mode indicating the GRD-solution’s inhibition of the TNBC tumor growth via inhibitions of tumor cell invasion and/or migration.
Conclusion: Panax Ginseng extract in drinking solution significantly reduced triple negative breast cancer xenograft growth in the immunodeficient mice. The level of reduction was dose dependent. The mechanisms of action involved inhibition of the tumor cell invasion and migration.
Keywords
Ginseng; Triple negative breast cancer; Mouse model; Xenograft.
Abbreviations
GRD: Ginseng Root Extract Drink; IPA: Ingenuity Pathway Analysis; TNBC: Triple Negative Breast Cancer; IVIS: In vivo Imaging System
Introduction
Breast cancer is the leading cause of death in women in the US. Cancer Statistics, 2024, revealed an estimation of 313,510 new cases with diagnosis of breast cancer and approximate 42,780 deaths in the US. Heterogeneity of breast cancer in genomic alterations, gene expression, metastasis, histological morphology, responses to therapy and intra-tumoral diversity complicates diagnosis, prognosis assessment and treatment. Triple Negative Breast Cancer (TNBC) is the most aggressive subtype of breast cancer with the worst prognosis, and accounts for about 15- 20% of all breast cancers [1]. TNBC is characterized by the lack of expression of the receptors for estrogen and progesterone, and lack of overexpression of Human Epidermal Growth Factor Receptor (HER2) in the tumor tissue [2-6]. These characteristics render TNBC resistant to hormone therapies and therapeutic agents targeting HER2 like Trastuzumab for treatment [7].
Conventional treatments for patients diagnosed with TNBC in early stages mainly include surgical treatment in a combination with adjuvant or neoadjuvant chemotherapy, and with or without radiation therapy [7,8]. For patients with TNBC in advanced stages, the initial treatment can be neoadjuvant chemotherapy or immunotherapy to decrease tumor mass prior to surgery [8- 10]. Drugs commonly used for chemotherapy include, though not limited to anthracyclines, taxanes, capecitabine, gemcitabine, and eribulin. Patients under treatment with these chemotherapy or immunotherapy agents often develop resistance to the drugs and unwanted toxic side effects, that hinder chemotherapeutic treatment [10,11]. Effective therapeutic agents with less sideeffects for TNBC treatment are lacking and urgently needed.
Panax Ginseng is a naturally existing plant and has been used as a traditional Chinese medicine. It is listed by the USA National Institutes of Health [12] as a complementary and alternative medicine and is considered safe as a dietary supplement. Ginseng’s anti-cancer functions are being increasingly recognized [13]; however, the information is lacking on if Panax Ginseng has effects upon TNBC growth and the underlying mechanisms of effects at molecular level. In this study, we investigated effects of Panax Ginseng extract on orthotropic TNBC xenograft tumor growth from MDA-MB-231-Luc cells implanted to breast anatomic area of immunodeficient mice. We also performed gene expression analysis to study the mechanism of action at molecular level.
Materials and Methods
Cell lines, cell Culture and reagent
Human breast adenocarcinoma cell line, MDA-MB-231-Luc cells, were obtained from ATCC (Manassas, VA) and cultured in RPMI 1640 medium (Thermo Fisher Scientific) containing 10% fetal bovine serum, 5 % penicillin and 1% streptomycin. The cells were cultured at 37°C to sub-confluence and harvested after a treatment with 0.25% (w/v) trypsin/ethylene diaminetetraacetic acid de-attaching the cells from culture flask. The harvested cells were washed with the culture medium in the absence of phenol red and fetal bovine serum, and counted using Nucleocounter (New Brunswick Scientific, Edidon, NJ).
The roots of Panax Ginseng which naturally grew in northeast region of China were purchased from ShiYi Tang Pharmacy for Chinse Medicine. The lateral roots were separated from the main root and used for the preparation of Ginseng Root Extract Drink (GRD) solution which is also known as Life Wave Ginseng Root Drink (ç??å?½æ³¢äººåÂ?æ ¹é¥®æ¶²). The GRD solution was produced and kindly provided by Qitaihe Cheng Cheng Carbon Quantum Dots Science and Technology Products Manufacturing Co., Ltd. using Carbon Quantum Dots technology [14]. Briefly, Panax Ginseng lateral roots were thoroughly washed to clearness using oxygen saturated-distilled and deionized water, followed by steamcooking, dehydration, and processing to powder form to particle size <3 micrometer using an instrument Micro-nano particles collider. The powder of the Ginseng lateral roots was aliquoted to 0.14 g that was dissolved in 95 mL of oxygen-saturated distilled and deionized water to bring the GRD concentration to 1.5 mg/mL. The oxygen-saturated distilled and deionized water was produced using Life Wave SMB Commercial Drinking Water Device (Qitaihe ChengCheng Amorphous Alloy Development Co., Ltd., Heilongjiang, China).
Animals
Immunodeficient female NCr nude homozygous (sp/sp) mice with T cell function deficiency in their 5-6 weeks age and body weight of 20-25 g were purchased from Taconic Biosciences, Inc. (Germantown, NY, USA). The experiments involved with the immunodeficient mice were conducted at the animal facility of the Veteran Affairs Medical Center (Albany, NY, USA) in accordance with the institutional guidelines for humane animal treatment and according to the NIH guidelines and was approved by Institutional Animal Care and Use Committee (IACUC) of Albany College of Pharmacy and Health Sciences. The experimental mice were maintained in a pathogen-free environment under controlled temperature (20-24°C), humidity (60-70%) and 12-hr light/dark cycle with ad libitum access to water and food. The mice were allowed to acclimatize for 5 days prior to commencing the study.
Triple negative breast cancer xenograft mice and treatment
MDA-MB-231-Luc cells were cultured, harvested and suspended in 100 μL of medium containing serum free Dulbecco’s Modified Eagle’s Medium (DMEM) (Sigma-Aldrich, MO) and Matrigel®(Corning, NY) (1:1, v/v). Two × 106 cells in 100 μL of the DMEM and Matrigel (1:1) medium were orthotopically implanted to the 3rd mammary fat pad on each side of anesthetized nude mouse to achieve two independent tumors per mouse [15]. On the 5th day of post-implantation when the tumor mass became palpable, and the experimental mice (n=20) were randomly sorted into four groups (5 mice/group). The mice of group-1 were treated, on day “0” of the experiment, by orally feeding with 0.3 mL of Phosphate buffered saline (Millipore Sigma, MO) as control group; the group-2 mice were treated with the Ginseng extract GRD-solution at 3 mL (4.4 mg) GRD/kg body weight, as Low-Dose group; the group-3 mice were fed with the GRD-solution at 6 mL (8.8 mg) GRD/kg body weight as Mid-Dose group; and the group-4 mice were given with the GRD solution at 12 mL (17.6 mg) GRD/kg body weight as High-Dose group. The volume of the feeding solutions was adjusted to 0.3 mL with distilled and deionized water before feeding each mouse. The feeding solution was administered once a day via mouth feeding using syringe-flexible plastic feeding tubes for 27 days. The animals were humanely sacrificed on the 27th day of treatment, and tumors and other organ tissues (lung/heart, liver and kidney) were harvested and processed for further analysis.
Measurements of tumor volume and weight, and mouse body weight
The tumor volume in vivo of each experimental mouse was estimated by measurements using a Vernier caliper at day “0” and once with a 3-day interval throughout the experiment. The tumor volume was calculated based on the standard formula (0.5 × W × L2). The weight of the tumor tissue was determined using an analytical balance (sensitivity of 0.01 g) after dissection. Mouse body weights were weighed once in every three days during the experiment using a top-loading balance ( ± 0.1 g).
In vivo Imaging System (IVIS) analysis of tumor growth
The TNBC Xenograft-bearing mice were anesthetized using isoflurane, and subsequently injected subcutaneously with 50 μL D-luciferin (Perking Elmer, MA) (30 mg/mL). The mice were then imaged using the Xenogen IVIS Spectrum Imaging system. Photographic and luminescence images were taken at constant exposure time for 2 minutes. Xenogen IVIS Living Image software was used to quantify non-pixels-saturated bioluminescence in Regions of Interest (ROI). Bioluminescence was quantified as photons per second for each ROI and used for monitoring in vivo tumor kinetic growth and metastasis.
Preparation of tumor and organ tissues for histological examination
Tumor tissue and several other organ tissues were collected at necropsy and transferred into plastic histology cassettes which were then merged in 10% buffered formalin overnight for fixation. The tissues were paraffin embedded overnight. Five- μm sections were cut and placed on microscopy slides. For Hematoxylin and Eosin (H and E) staining, the slides were prepared using a Shandon Gemini Varistain ES Automated Stainer according to the manufacturer’s protocol and customary dyes. The stained slides were examined using a microscope at 4 × and 10 × objectives.
Gene expression analysis
Total RNA was isolated from the freshly frozen breast tumor tissue using a standard TRI zol™ isolation protocol followed by cleanup on a RN Easy Plus micro column. Total RNA (100 ng) was processed for reverse transcription using the Whole Transcript WT Plus reagent kit (Affymetrix, Santa Clara, CA). Sense-stranded cDNA targets were generated using the standard Affymetrix WT protocol and hybridized to Affymetrix scanner using Affymetrix Gene Chip Command Console Software (AGCC). Transcriptome Analysis Console Software (TAC v4.0.1.36) was used to identify differentially expressed genes. Briefly, the Cell Intensity File (CEL) files were summarized using the SST-RMA (Signal Space Transformation-Robust Multi-Array Average algorithm) in TAC and the normalized data were subjected to one-way ANOVA with a Benjamin Hochberg False Discovery Rate correction included (p<0.05). A 1.5-fold change was used to select entities that were statistically and differentially expressed between the control and GRD-treated mice. These differentially expressed gene data were subsequently mapped to cellular pathways using Ingenuity Pathway Analysis (IPA) to delineate the probable mechanism of action. Only those samples that passed QC criteria were further analyzed as describe above, i.e., criteria for the PCR array reproducibility were set as the average Positive PCR Control (PPC) CT is 20 ± 2 and no two arrays have average PPC CT are >2 away from one another, and a minimum level of RNA yield ≥ 0.1 micro gram.
Statistical Analysis
GraphPad Prism 7 software (GraphPad, San Diego, CA) was used for statistical analysis. p-values <0.05 indicates statistically significant difference.
Results
Effect of the Ginseng root extract (GRD-solution) on triple negative breast cancer xenograft and body weight of the experimental mice
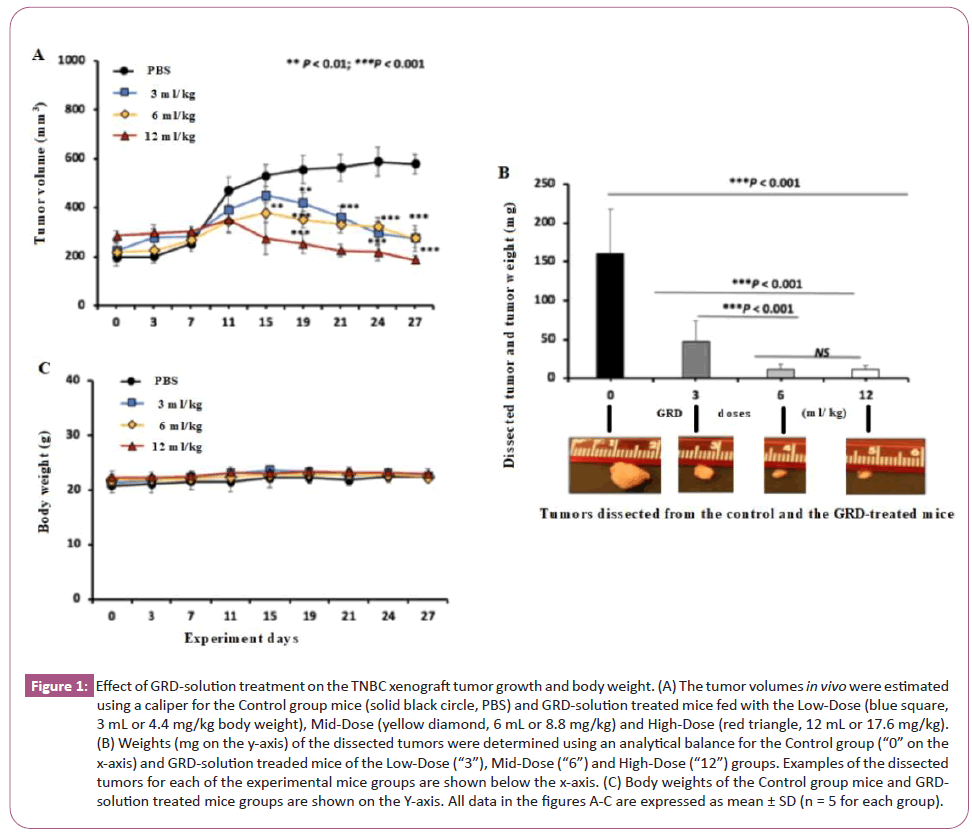
All experimental mice developed TNBC tumors at the breast anatomic location. For the Control group (Figure 1A black line), the tumor volume increased slightly in the first 7 days, followed by a rapid increase from day 7 to 11, and continued to increase slowly in the remaining experiment of 27 days. For the GRD-solution treated group, the tumor volume increased similarly to the control group in the first 7 days. Afterwards, however, the tumor volumes of the GRD-solution treated groups were significantly lower than the control group starting from day 11 for the High-Dose group and from day 15 for both of the Mid-Dose and Low-Dose groups. On day 27, the terminal day of the experiment the Low-Dose, Mid-Dose and High-Dose groups had the tumor volumes reduced to 48% (275 ± 53 mm3, volume ± SD,), 47% (274 ± 34) and 32% (186 ± 18) of the control group (578 ± 40), respectively (Figure 1A).
Figure 1: Effect of GRD-solution treatment on the TNBC xenograft tumor growth and body weight. (A) The tumor volumes in vivo were estimated using a caliper for the Control group mice (solid black circle, PBS) and GRD-solution treated mice fed with the Low-Dose (blue square, 3 mL or 4.4 mg/kg body weight), Mid-Dose (yellow diamond, 6 mL or 8.8 mg/kg) and High-Dose (red triangle, 12 mL or 17.6 mg/kg). (B) Weights (mg on the y-axis) of the dissected tumors were determined using an analytical balance for the Control group (“0” on the x-axis) and GRD-solution treaded mice of the Low-Dose (“3”), Mid-Dose (“6”) and High-Dose (“12”) groups. Examples of the dissected tumors for each of the experimental mice groups are shown below the x-axis. (C) Body weights of the Control group mice and GRD-solution treated mice groups are shown on the Y-axis. All data in the figures A-C are expressed as mean ± SD (n = 5 for each group).
The dissected tumors were weighed on the terminal day of the experiment and their masses (mean ± SD in mg) from the Low-Dose, Mid-Dose and High-Dose group mice were 29.2% (47 ± 26), 7.4% (12 ± 6) and 6.8% (11 ± 6) of the control group (161 ± 56) respectively (Figure 1B). Results of a longitudinal comparison between day 0 and 27 within the control group mice showed that the tumor volume increased by 195%, from 196 ± 35 (mean ± SD mm3) as determined on day 0 to 578 ± 40 on day 27. In contrast, the tumor volumes of the GRD-solution treated group increased by 22% (225 ± 35 on day 0 vs 275 ± 53 on day 27) and 25% (218 ± 38 vs 274 ± 34) for the Low-Dose and Mid-Dose groups, respectively. For the High-Dose group, the tumor volume was instead decreased by 35% (284 ± 20on day 0 vs 186 ± 18 on day 27) over the 27 day experimental period (Figure 1A red line).
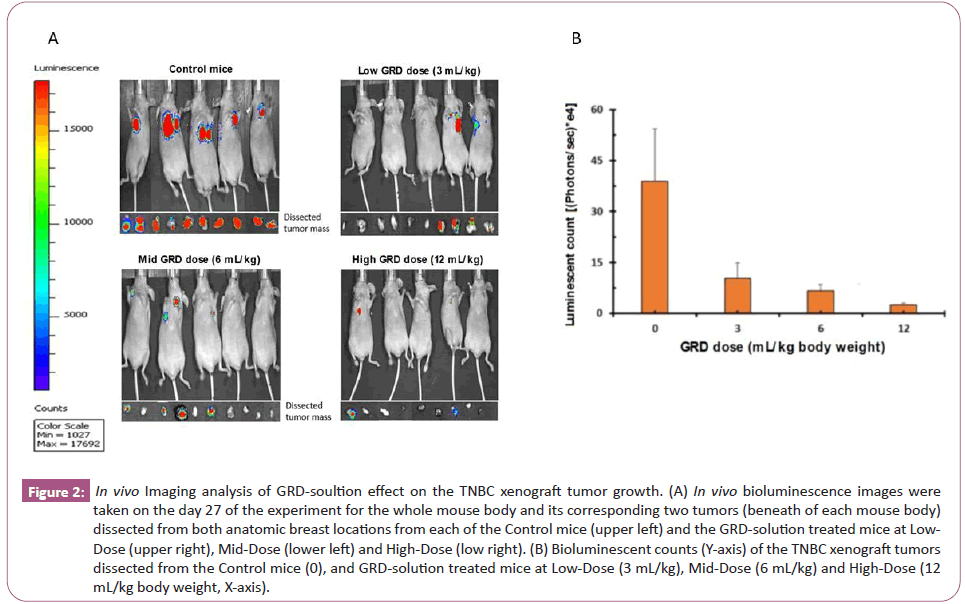
No significant difference in the body weights was observed between the control group and the GRD-solution treated groups (Figure 1C). No apparent abnormalities were observed in overall condition of all experimental mice and anatomical appearance of their liver, lung, kidney and heart. Bioimaging analysis did not reveal the tumor metastasis in these dissected organs of the control and GRD-solution treated groups. The in vivo imaging analysis revealed bioluminescent signals in the orthotropic breast tumors in all of the control and GRD-treated groups (Figure 2A); the dissected tumor tissues from GRD-solution treated groups had significant lower levels of luminescence than the control groups (Figure 2A and 2B).
Figure 2: In vivo Imaging analysis of GRD-soultion effect on the TNBC xenograft tumor growth. (A) In vivo bioluminescence images were taken on the day 27 of the experiment for the whole mouse body and its corresponding two tumors (beneath of each mouse body) dissected from both anatomic breast locations from each of the Control mice (upper left) and the GRD-solution treated mice at Low-Dose (upper right), Mid-Dose (lower left) and High-Dose (low right). (B) Bioluminescent counts (Y-axis) of the TNBC xenograft tumors dissected from the Control mice (0), and GRD-solution treated mice at Low-Dose (3 mL/kg), Mid-Dose (6 mL/kg) and High-Dose (12 mL/kg body weight, X-axis).
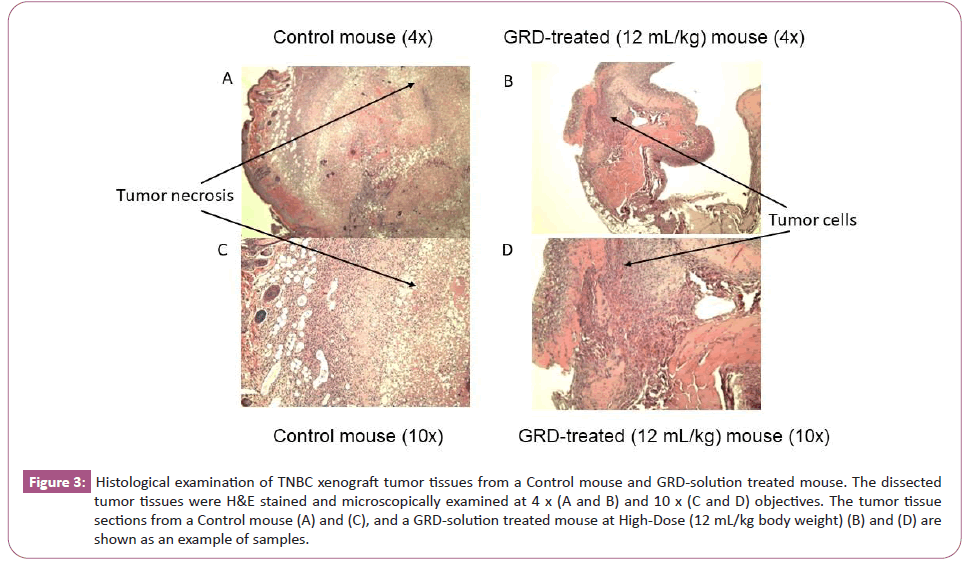
The histological analysis revealed hyper cellular carcinoma cells invading the surrounding tissue with tissue necrosis in the dissected breast tumors from both of the control and GRD-solution treated groups. The GRD-solution treated groups had significantly smaller affected areas than that of Control group (Figure 3); however, the tumor tissue of the GRD-solution treated mice still showed existence of viable tumor cells.
Figure 3: Histological examination of TNBC xenograft tumor tissues from a Control mouse and GRD-solution treated mouse. The dissected tumor tissues were H&E stained and microscopically examined at 4 x (A and B) and 10 x (C and D) objectives. The tumor tissue sections from a Control mouse (A) and (C), and a GRD-solution treated mouse at High-Dose (12 mL/kg body weight) (B) and (D) are shown as an example of samples.
Gene expression analysis
Of the 20 mice used in the experiment, 9 had tumors that yielded a sufficient amount of RNA molecules that passed the quality control criteria for gene expression analysis. Of the 9 samples, 2 were from the control group, 4 from the Low-Dose and 3 from Mid-Dose groups of GRD-solution treated mice. For the High-Dose GRD-treated group, gene expression analysis was not performed because the tumor tissues isolated from the mice of this group were so little that insufficient RNA could be extracted to pass the QC criteria, given that a portion of the tumor tissue had already been used for histological examination.
Principle Component Analysis (PCA) was done using the transcriptome data from a total of 2400 genes expressed in the tumor tissues isolated from these 9 experimental mice. The top 3 most significant variations as captured by PCA plot were 23.0% (PCA1), 16.6% (PCA2) and 13.3% (PCA3). The PCA plot showed distinct levels of gene expressions in the tumor tissues between control, Low-Dose, and Mid-Dose GRD-solution treated mice (Data not shown).
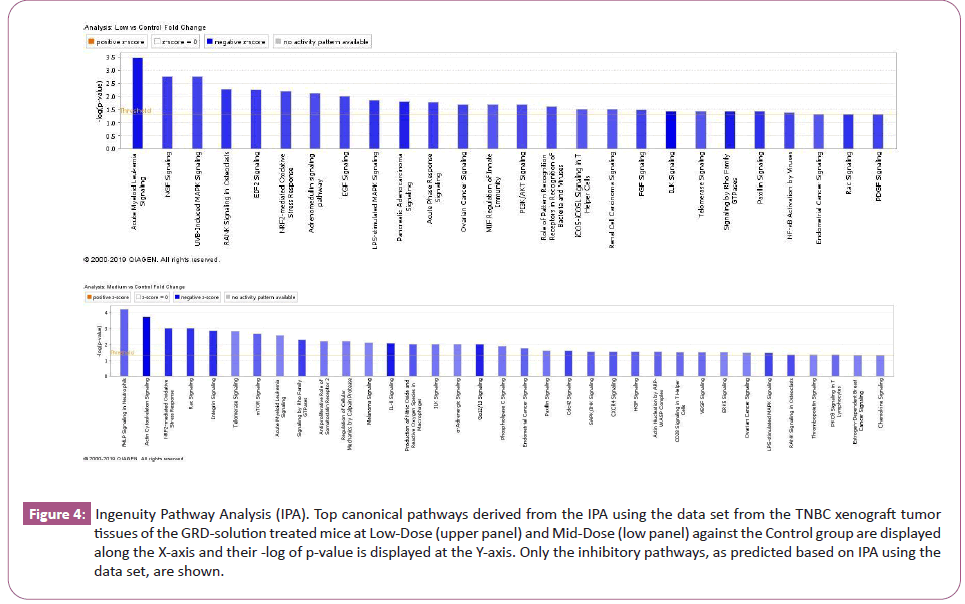
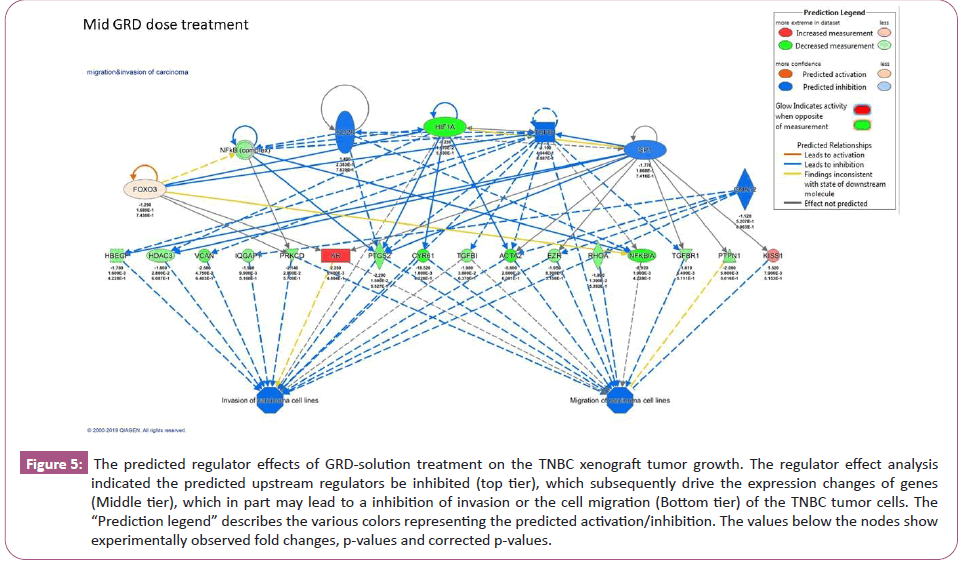
Differential gene expression analysis revealed 210 up-regulated and 312 down-regulated genes in the Low-Dose GRD-treated mice tumors, and 475 up-regulated and 591 down-regulated genes in the Mid-Dose GRD-treated mice tumors with >1.5-fold changes (p< 0.05) in a comparison with the Control group mice. The top 36 genes with high level of gene expression changes in the tumor tissue from the Mid-Dose GRD-treated group are shown in the (Table 1). A forecast models of down regulated canonical pathways derived from Ingenuity Pathway Analysis (IPA) analysis based on the differential gene expression data are shown in figure 4. Regulator effect analysis predicted the upstream regulators being inhibited and is shown in figure 5 for the Mid-Dose GRD-solution treated mice.
Figure 4: Ingenuity Pathway Analysis (IPA). Top canonical pathways derived from the IPA using the data set from the TNBC xenograft tumor tissues of the GRD-solution treated mice at Low-Dose (upper panel) and Mid-Dose (low panel) against the Control group are displayed along the X-axis and their -log of p-value is displayed at the Y-axis. Only the inhibitory pathways, as predicted based on IPA using the data set, are shown.
Figure 5: The predicted regulator effects of GRD-solution treatment on the TNBC xenograft tumor growth. The regulator effect analysis indicated the predicted upstream regulators be inhibited (top tier), which subsequently drive the expression changes of genes (Middle tier), which in part may lead to a inhibition of invasion or the cell migration (Bottom tier) of the TNBC tumor cells. The “Prediction legend” describes the various colors representing the predicted activation/inhibition. The values below the nodes show experimentally observed fold changes, p-values and corrected p-values.
| Down-regulated genes | Up-regulated genes | ||||
|---|---|---|---|---|---|
| Gene symbol | Change in fold | p-values | Gene symbol | Change in fold | p-values |
| BCL2L11 | -58.61 | 0.0007 | MYRIP | 2.43 | 0.001 |
| NFKBIZ | -36.49 | 0.0078 | TSC1 | 2.47 | 0.0182 |
| NDEL1 | -27.83 | 0.0009 | FDPS | 2.47 | 0.0022 |
| PLEK | -22.48 | 8.71E-05 | KCNJ13 | 2.49 | 0.0121 |
| CYR61 | -18.52 | 0.0018 | SPATA31D3 | 2.49 | 0.0121 |
| RNF149 | -17.57 | 0.0081 | PIEZO2 | 2.5 | 0.0024 |
| CHST11 | -16.27 | 0.0004 | YBX1 | 2.56 | 0.0006 |
| ACTN1; HMGN1P3 | -14.58 | 0.0162 | PLCB4 | 2.58 | 0.0086 |
| CCNL1 | -14.05 | 0.0008 | SCRN3 | 2.6 | 0.0113 |
| SOCS3 | -11.59 | 0.0039 | AGMO | 2.61 | 0.0205 |
| TNFAIP3 | -10.97 | 0.0037 | PPIB | 2.64 | 0.0112 |
| RPS24 | -9.94 | 6.05E-05 | OR10V1 | 2.65 | 0.0172 |
| HIF1A | -9.23 | 0.0167 | ARFIP2 | 2.72 | 0.0265 |
| NFKBIA | -8.92 | 0.0019 | ZNF706 | 2.73 | 0.002 |
| SPTLC2 | -8.11 | 0.0073 | YIPF4 | 2.79 | 0.0074 |
| MSRB1 | -7.75 | 0.001 | AHNAK | 2.79 | 0.0091 |
| DUSP5 | -7.62 | 0.0035 | DEFB130 | 2.89 | 0.0199 |
| SMOX | -7.28 | 0.0119 | DEFB130 | 2.89 | 0.0199 |
| OGFRL1 | -7.09 | 0.0076 | GNE | 2.9 | 0.0127 |
| IFRD1 | -6.8 | 0.0006 | RAD21L1 | 2.9 | 0.0013 |
| GADD45A | -6.69 | 1.19E-05 | CDC42BPB | 2.91 | 0.0265 |
| DUSP16 | -6.61 | 0.0127 | SRY | 2.96 | 0.0026 |
| SLC2A14 | -6.46 | 0.002 | NAP1L1 | 3.06 | 0.0278 |
| TPD52 | -5.84 | 0.0011 | MUC7 | 3.07 | 0.0365 |
| ACTA2 | -5.8 | 0.026 | ACACA | 3.13 | 0.008 |
| LDHA | -5.12 | 0.0019 | SQLE | 3.21 | 0.0109 |
| ERRFI1 | -4.99 | 0.0085 | EEF2; SNORD37 | 3.29 | 0.0107 |
| RPL26 | -4.84 | 0.0014 | ENPEP | 3.3 | 0.0093 |
| ANXA1 | -4.76 | 0.0049 | ARPP21 | 3.52 | 0.0105 |
| FPR2 | -4.63 | 0.0008 | PPM1B | 3.53 | 0.012 |
| TXN | -4.56 | 0.0016 | LRP6 | 3.69 | 0.014 |
| TBC1D15 | -4.45 | 0.0011 | AADAC | 3.71 | 0.0065 |
| ADIPOR1 | -4.45 | 0.0002 | SMIM9 | 3.72 | 0.0001 |
| ATG9A | -4.37 | 0.0002 | ARPP21 | 4.66 | 0.0369 |
| INTS12 | -4.3 | 0.0066 | EI24 | 5.08 | 1.73E-05 |
| GPCPD1 | -4.29 | 0.0139 | THRA | 5.8 | 0.0182 |
Table 1: The top 36 genes with high level of gene expression changes in the tumor tissue from the Mid-Dose GRD-solution treated vs Control mice.
Discussion
Results of our study showed significant inhibitory effect of Panax Ginseng root extract (in a form of drinking solution or GRD-solution) on TNBC xenograft tumor growth in the immunodeficient mouse model. The inhibition was in a dose-dependent manner (Figure 1). The High-Dose of GRD-solution treatment for 27 days resulted in a full inhibition of the xenograft tumor growth (Figure 1A and 1B). Such an observation was further supported by the results of the in vivo imagining analysis (Figure 2). In addition, the presence of bioluminescent signals as results of luciferase expression in the orthotropic breast tumors in all the control and GRD-solution treated mice verified the tumor development from the MDA-MB-231-Luc cells and successful TNBC xenografts implantation. Histological examination on the dissected tumor tissues further verified the nature of TNBC tumor mass of the experimental mice. Further, histological examination on the tumor tissues dissected from the GRD-solution treated mice showed existence of viable tumor cells (Figure 3), suggesting the tumor growth could relapse should the GRD-solution treatment be terminated. It is unknown whether continuation of GRD-solution treatment could eventually eradicate the viable tumor cells or “keep the tumor at bay” but still in viable state, and whether the tumor volume be further reduced should the experiment be extended longer than 27 days. To answer these and other questions that may arise afterwards, further studies are needed.
Gene expression analysis was carried out to study possible mechanisms at molecular level of the GRD-solution’s effect on the TNBC xenograft growth. Principal component analysis (PCA) plot showed genes distinctly expressed in the tumor tissues between the control group and the GRD-solution treated mice. The differential gene expression analysis revealed higher number of the down-regulated genes than the up-regulated genes in the GRD-solution treated mice tumor tissues. Further, the changes of the down-regulated gene expression were up to -58.61 folds, over ten times greater than that (5.08 folds) of the up-regulated genes (Table 1), indicating that GRD-solution exerted the tumor reduction effect primarily via inhibitory mechanism and less via stimulation effects. Upon literature review on the top five down-regulated genes, we found they all are involved in tumor genesis and development; but they were inhibited by GRD-solution treatment. The top five down-regulated genes and their phenotypic functions are: BCL211 or BIM (-58.61fold change, 0.0007 p-value) is associated with tumor progression [16]; nuclear factor-kappaB (NFκB) (-36.49, 0.0078) facilitates the tumor development of hormone-independent, invasive and high grade tumor phenotype [17]; NDEL1 (-27.83, 0.0009) is involved in act in remodeling, therefore, cell movement or tumor invasion [18]; PLEK(-22.48, 0.000087) is involved in tumorigenesis and metastasis [19]; Cyr61 (-18.52, 0.0018), an antigenic factor, promotes breast tumorigenesis and progression [20]. On the other hand, the 3 top up-regulated genes by the GRD-solution treatment are: THRA (5.8, 0.0182) low expression be associated with high breast cancer mortality [21]; EI24 (etoposide induced 2.4) (5.08, 0.0000173) plays a role against tumor progression [22]; ARPP21 (4.66, 0.0369) is negatively associated with survival outcome [23].
MDA-MB-231 cells carry 5 mutated genes for BRAF (c.1391G>T (p.G464V), heterozygous), CDKN2A (c.1_471del471, homozygous), KRAS (c.38G>A ,heterozygous), NF2 (c.691G>T, homozygous) and TP53 (c.839G>A , homozygous) [24]. Our study showed no effect of GRD-solution treatment on the gene expression for 4 of these 5 genes. Among these 5 genes, only BRAF was down-regulation by 2.65 (p = 0.0035) and 2.78 (p=0.0042) fold in the Low-Dose and Mid-Dose GRD-solution treated mice tumor tissue, respectively; BRAF(G464V) normally increase Braf kinase activity, cell proliferation and viability in comparison to its wild-type Braf [25].
Ingenuity Pathway Analysis (IPA) on the gene expression data revealed 26 and 35 down-regulated signaling pathways by the Low-Dose and Mid-Dose GRD-solution treatment, respectively, with statistical significance (Figure 4). Many of these signaling pathways are known for their role in breast cancer development. For instance, Nerve Growth Factor (NGF) signaling stimulates proliferation and survival of human breast cancer cells [26]; RANK was detected in breast cancer cell lines and in human primary breast cancers [27]; ELF2 signaling pathway is involved in either stimulating or inhibiting malignant transformation, its phosphorylated ELF2 (p-eIF2α) is upregulated in breast cancer [28]. Our finding also revealed that acute myeloid leukemia signaling pathway was the most significantly down regulated by the GRD-solution treatment; however, information on its involvement in TNBC tumorigenesis cannot be found in a literature search suggesting a novelty of finding of this study.
We further conducted regulator effect analysis based on the gene expression data, resulting in a prediction mode, which showed the upstream regulators inhibition, which in turn drove gene expression changes (Figure 5, middle tier), which in part may ultimately cause an inhibition of tumor cell invasion or migration (Figure 5, low tier).
Limitations of this study may include lack of gene expression data for the high-dose group of the GRD-solution treated mice due to insufficient amount of tumor tissue from the group for analysis. The study could not provide information on the chemical components of the GRD-solution that exerted the inhibitory effect on the TNBC xenograft tumor growth; further study is needed to identify and isolate such still unknown molecule(s). Gene expression analysis revealed many molecules and signaling pathways involved, suggesting that multiple compounds of the GRD-solution contribute the inhibition of the xenograft tumor growth. The inhibitory molecule(s) can be a result of a combination of GRD-solution production process and a fermentation of the drinking GRD-solution in the digestive system. Significance of this study is the demonstration that Panax Ginseng root extract in a form of GRD-solution containing ultrafine particles of Ginseng powder can effectively reduce TNBC xenograft tumor mass.
At the terminal day of the experiment, all experimental mice were physically active and appeared to be in normal physical condition, except bearing tumor lumps. There were no significant differences in body weight between the control group mice and GRD-solution treated groups (Figure 1C). Given that GRD-solution treated mice bore (4-10 fold) smaller tumor lump mass than the Control group mice (Figure 1B), the normal fraction of the body weights of the GRD-solution treated mice might be higher than the Control group. Such phenomena are consistent with the known information that Ginseng improves overall well-being and several other body functions [29] Though Ginseng is listed as a dietary supplement by the National Institute of Health and is "Generally Recognized as Safe" (GRAS) by the U.S. FDA some common side effects are worth noting [30].
Conclusion
Panax Ginseng root extract that was prepared in a form of drinking solution significantly reduced triple negative breast cancer xenograft growth in the immunodeficient mice. The level of reduction was dose dependent. Gene expression analysis suggested mechanisms of the action be inhibition of the tumor cell invasion and migration.
Acknowledgement
Primary experimental activities were performed under contract research agreement with Albany College of Pharmacy and Health Sciences, Albany, NY. Gene expression analysis was conducted under contract research agreement at Center for Functional Genomics, SUNY University at Albany, Albany, NY.
References
- Siegel RL, Giaquinto AN, Jemal A (2024) Cancer statistics, 2024. CA Cancer J Clin 74: 12-49.
- Zagami P, Carey LA (2022) Triple negative breast cancer: Pitfalls and progress. NPJ Breast Cancer 8: 95.
- Allred DC, Wu Y, Mao S, Nagtegaal ID, Lee S et al., (2008) Ductal carcinoma in situ and the emergence of diversity during breast cancer evolution. Clin Cancer Res 14: 370–378.
- Shipitsin M, Campbell LL, Argani P, Weremowicz S, Bloushtain-Qimron N, et al., (2007)Molecular definition of breast tumor heterogeneity. Cancer Cell 11: 259-273.
- Sorlie T, Perou CM, Tibshirani R, Aas T, Geisler S et al., (2001) Gene expression patterns of breast carcinomas distinguish tumor subclasses with clinical implications. Proc Natl Acad Sci USA 98:10869–10874.
- Perou CM, Sorlie T, Eisen MB, van de Rijn M, Jeffrey SS et al., (2000) Molecular portraits of human breast tumours. Nature 406: 747–752.
- Cardoso F, Kyriakides S, Ohno S, Penault-Llorca F, Poortmans P et al., (2019) Early breast cancer: ESMO clinical practice guidelines for diagnosis, treatment and follow-up. Ann Oncol 30: 1194–1220.
- Golshan M, Loibl S, Wong SM, Houber JB, O’Shaughnessy J et al., (2020) Breast conservation after neoadjuvant chemotherapy for triple-negative breast cancer: Surgical results from the BrighTNess randomized clinical trial. JAMA Surg 155: e195410.
- Obidiro O, Battogtokh G, Akala EO (2023) Triple negative breast cancer treatment options and limitations: Future outlook. Pharmaceutics 23:1796.
- Li L, Zhang F, Liu Z, Fan Z (2023) Immunotherapy for triple-negative breast cancer: Combination strategies to improve outcome. Cancers (Basel) 15:321.
- Brahmer JR, Tykodi SS, Chow LQ, Hwu WJ, Topalian SL et al., (2012) Safety and activity of anti-PD-L1 antibody in patients with advanced cancer. N Engl J Med 366: 2455–2465.
- NIH Dietary supplement fact sheets, National Institute of Health.
- Wang CZ, Anderson S, DU W, He TC, Yuan CS et al., (2016) Red ginseng and cancer treatment. Chin J Nat Med 14: 7-16.
- Jiao Y, Guo Y, Fan Y, Wang R, Li X et al., (2020) Triggering of apoptosis in osteosarcoma 143B cell line by carbon quantum dots via the mitochondrial apoptotic Signal Pathway. BioMed Res Int 2020: 2846297.
- Price JE, Polyzos A, Zhang RD, Daniels LM (1990) Tumorigenicity and metastasis of human breast carcinoma cell lines in nude mice. Cancer Res 50: 717-721. [Crossref]
- Sionov RV, Vlahopoulos SA, Granot Z (2015) Regulation of bim in health and disease. Oncotarget 6: 23058-23134.
- Wang W, Nag SA, Zhang R (2015) Targeting the NFκB signaling pathways for breast cancer prevention and therapy. Curr Med Chem 22: 264-289.
- Hong JH, Kwak Y, Woo Y, Park C, Lee S et al., (2016) Regulation of the actin cytoskeleton by the Ndel1-Tara complex is critical for cell migration. Sci Rep 6: 31827.
- Wang G, Zhou Q, Xu Y, Zhao B (2021)Emerging roles of pleckstrin-2 beyond cell spreading. Front Cell Dev Biol 9: 768238.
- Tsai MS, Bogart DF, Castañeda JM, Li P, Lupu R et al., (2002) Cyr61 promotes breast tumorigenesis and cancer progression. Oncogene 21: 8178-8185.
- Sandsveden M, Borgquist S, Rosendahl AH, Manjer J (2021) Low Thyroid Hormone Receptor Alpha-2 (THRα-2) tumor expression is associated with unfavorable tumor characteristics and high breast cancer mortality. Breast Cancer Res 23: 117.
- Choi JM, Devkota S, Sung YH, Lee HW (2013) EI24 regulates epithelial-to-mesenchymal transition and tumor progression by suppressing TRAF2-mediated NF-κB activity. Oncotarget 4: 2383-2396.
- Qian P, Banerjee A, Wu ZS, Zhang X, Wang H et al., (2012) Loss of SNAIL regulated miR-128-2 on chromosome 3p22.3 targets multiple stem cell factors to promote transformation of mammary epithelial cells. Cancer Res 72: 6036-6050.
- (2025) Triple negative breast cancer panels.
- Ng PK, Li J, Jeong KJ, Shao S, Chen H et al., (2018)Systematic Functional Annotation of Somatic Mutations in Cancer. Cancer Cell 33: 450-462.
- Descamps S, Toillon RA, Adriaenssens E, Pawlowski V, Cool SM et al., (2001)Nerve growth factor stimulates proliferation and survival of human breast cancer cells through two distinct signaling pathways. J Biol Chem 276: 17864-17870.
- Infante M, Fabi A, Cognetti F, Gorini S, Caprio M, et al., (2019) RANKL/RANK/OPG system beyond bone remodeling: Involvement in breast cancer and clinical perspectives. J Exp Clin Cancer Res 38: 12.
- Guo L, Chi Y, Xue J, Ma L, Shao Z et al., (2017) Phosphorylated eIF2α predicts disease-free survival in triple-negative breast cancer patients. Sci Rep. 7: 44674.
- NIH National Center for Complementary and Integrative Health
- (2006) Drugs and Lactation Database (LactMed®). Bethesda (MD): National Institute of Child Health and Human Development. Ginseng.

Open Access Journals
- Aquaculture & Veterinary Science
- Chemistry & Chemical Sciences
- Clinical Sciences
- Engineering
- General Science
- Genetics & Molecular Biology
- Health Care & Nursing
- Immunology & Microbiology
- Materials Science
- Mathematics & Physics
- Medical Sciences
- Neurology & Psychiatry
- Oncology & Cancer Science
- Pharmaceutical Sciences
