ISSN : 2576-392X
Dentistry and Craniofacial Research
The Perception Facial Attractiveness (PFA) in Saudi Culture through the Lens of the Golden Ratio
Randa AlFotawi*, AlJoharah AlShathry, Hafsah Al Ali, Ibrahim AlOmran, Njood AlSayari, Reema AlShahrani and Ahmad Alzahrani
Department of Oral and Maxillofacial, King Saud University, Riyadh, Saudi Arabia
- *Corresponding Author:
- Randa AlFotawi
Department of Oral and Maxillofacial, King Saud University, Riyadh,
Kingdom of Saudi Arabia,
E-mail: ralfotawei@ksu.edu.sa
Received date: July 08, 2024, Manuscript No. IPJDCR-24-19320; Editor assigned date: July 10, 2024, PreQC No. IPJDCR-24-19320 (PQ); Reviewed date: July 24, 2024, QC No. IPJDCR-24-19320; Revised date: July 31, 2024, Manuscript No. IPJDCR-24-19320 (R); Published date: August 07, 2024, DOI: 10.36648/2572-5483.8.3.146.
Citation: AlFotawi R, AlShathry A, Al Ali H, AlOmran I, AlSayari N, et al. (2024) The Perception Facial Attractiveness (PFA) in Saudi Culture through the Lens of the Golden Ratio. J Den Craniofac Res Vol.8 No.3: 146.
Abstract
Aim: The Perception of Facial Attractiveness (PFA) varies between cultures. This study aimed to assess the PFA in Saudi culture and compare it with the Golden Proportions (GP).
Methods: A total of 500 survey papers were formulated using the frontal views of different photographs with high beauty scores selected from the universal benchmark dataset. The selected photographs were modified. The different perception questions were formulated, followed by subjective and objective soft tissue analyses of the selected frontal photographs.
Results: A total of 488 participants reported differing opinions on the most important element that determines facial beauty. Male participants scored the eyes, whereas female participants scored the lips; this difference was statistically significant (p-value<0.009). The photograph with the highest score (86%) had an asymmetrical face of more than 4 mm, which was statistically significant between the Saudi participants who lived abroad and those who were not expatriates (p=0.037).
Conclusion: The participants had higher scores for short facial morphology. The facial analysis proportions reported percentage differences from the GP (1.618). These findings could provide guidelines for clinicians for improving facial aesthetics. Thus, further studies using a local database of the local population should be conducted.
Keywords
Perception; Facial aesthetics; Golden proportions; Facial beauty; Saudi culture
Introduction
Perception is defined as the process of organizing and interpreting environmental stimulus patterns influenced by various physical, physiological, and social factors [1]. For centuries, scholars have debated the features that make a face attractive and whether culture and biology influence our Perception of Facial Attractiveness (PFA). Beauty standards have been influenced by cultural conventions in various societies and historical periods [2]. Several popular writers assert that different ethnic groups have varying standards of attractiveness [3,4], one of the most important factors determining a person's physical attractiveness and beauty is the face [5]. Attractive individuals are more likely to experience favorable outcomes [6]. In modern society, facial attractiveness is highly valued, and certain features play a more significant role in interpersonal decision-making than others [7]. The PFA can be influenced by several factors, including educational, psychological, and social factors [8], namely facial beauty, distinctiveness, friendliness, intelligence, trustworthiness, dominance, and professionalism. Consequently, these differences in perception can influence both cosmetic treatment and an individual's decision for seeking it [9].
Over the years, numerous studies have attempted to identify the most attractive facial features [8,10]. Some studies suggest that facial attractiveness is determined by the facial shape, proportion, and relationship between facial features and contour lines [11]. Other studies have concluded that the most important determinants of PFA are the prototype, sexual dimorphism, youthfulness and symmetry [10]. It is noteworthy that cultural influences contribute to diverse perceptions of beauty. A study revealed that Asians display reduced sensitivity to sexual maturity and expressive features, whereas Black and White American men exhibit attraction toward women with neonate-like large eyes and small noses, sexually mature high cheekbone and small chins, an expressive and large smile, as well as lighter skin colors [12]. Furthermore, Taiwanese preferences lean toward wider cheeks and rounder faces compared to a preference for prominent cheekbones, broader chins, and higher eyebrows commonly observed among Americans [12].
Another study that assessed facial attractiveness in the Middle East, including Saudi Arabia [13], demonstrated that horizontal facial lines were more important than facial symmetry. Recently, a study was conducted to evaluate and determine the most attractive lip surface area and upper-to-lower lip ratio in the Saudi Arabian population [14]. The authors concluded that lips have a great impact on the perception of beauty, as well as age, sex, social media and current popularity.
Considering the influences of media on culture and thereafter significantly enhances the PFA [15]. As a result, patients may more frequently seek dental treatment, orthodontic and orthognathic surgical procedures, and plastic surgery procedures to enhance and optimize their facial appearance [7].
Surgeons are often uncertain concerning the best aesthetic outcome for their patients, and several studies have attempted to determine a reference system for aesthetics; however, most of those studies have focused more on determining what the normal values are rather than what is considered attractive [16-18]. Professionals in the aesthetic field, such as plastic surgeons, oral and maxillofacial surgeons and orthodontists, are primarily concerned with patient satisfaction; however, studies describing the current perception of facial attractiveness among the Saudi population in comparison to other countries are lacking [19,20]. In recent years, cosmetic treatment rates have greatly increased in Saudi Arabia, which has been linked to the influence of social media [21]. To the best of our knowledge, few studies was carried out the PFA in Saudi Arabia has not yet been investigated [14,22]. Therefore, our study aimed to determine how and ideal standards that may influence the PFA among Saudi citizens. These findings could provide guidelines for clinicians for the diagnosis and management of facial deformities and planning for aesthetic procedures.
Materials and Methods
Ethical approval was obtained, the study adhered to the guidelines outlined in the ‘Research Ethics on Living Organisms’ issued by Royal Decree No. M/29 and it also conformed to the principles set forth in the World Medical Association’s Declaration of Helsinki.
Questionnaires
The stages of questionnaires Perception Facial Attractiveness (PFA).
The first-stage questionnaires: An online illustrated questionnaire that displayed selected frontal views of different photographs with high beauty scores from well-known benchmarks of a facial beauty database (SCUT-FBP5500) that contains diverse photographs was made available to the public [7,23-26]. Involved an illustrated questionnaire that contained 14 photographs selected based on striking eyes, defined cheeks, full lips, lip competence, no skeletal discrepancies, or marked asymmetries, according to a well-established protocol [27]. The questionnaire was distributed to eleven physicians from various domains, namely orthodontics, oral and maxillofacial surgery and plastic surgery. Their opinions regarding facial attractiveness were assessed, including beauty, distinctiveness, friendliness, intelligence, trustworthiness, dominance and professionalism. On the other hand, the questionnaire was pretested by the same physicians unaffiliated with the research team and were modified repetitiously to improve clarity, face validity and content validity. The content validity was improved by adding the experience of living/or studying aboard to the survey; Recently, there has been an inflex of Saudi citizen who loved aboard and retain back. The face validity was adjusted by modifying certain questions for lay people survey forms (main study). A calibration process was undertaken to standardize the subjective assessment and agree with global parameters of evaluation as described in previously published paper [7,28]. To assess the reproducibility of the assessors Regarding the scoring of the questionnaires and measurements from the images in the main study, all measurement done was repeated by the five coauthors for each image, since this is a health related study a Cohen’s kappa score as low as 0.41 might be acceptable.
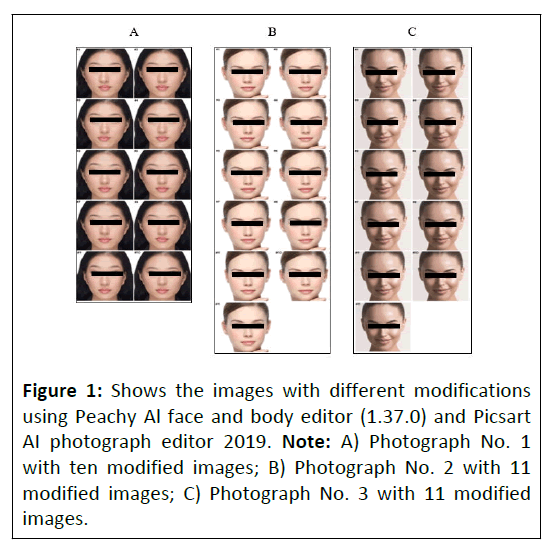
The main study questionnaires: The original photographs were subsequently modified to produce 10 images from photograph A and 11 images from both photograph A and B, based on well-established criteria (Figure 1) [29,30]. Modifications to facial symmetry included deviation of the nasal pyramid, philtrum, labial angle and mention; modifications to the horizontal facial lines included deviation of the eyebrow line, bi-pupillary line, sub-nasal line and labial line; modifications to attain equal horizontal thirds and equal vertical fifths; and modifications to the color of the iris. A total of 32 Images were digitally generated using the software Peachy Al face and body editor (version 1.37.0) and Picsart AI photograph editor according to an established protocol. A new questionnaire was formulated in Arabic and distributed to the general public of the Saudi population, aged ≥ 18 years with no known history of psychological disturbances. The questionnaire was formulated into five sections: Demographic data, opinions regarding facial attractiveness in general and opinions the 32 generated images from photographs A, B, C regarding facial attractiveness, including beauty, distinctiveness, friendliness, intelligence, trustworthiness, dominance and professionalism. 400 questionnaires were shared through social media platforms. Sample size calculation was follow well established protocol [15,31]. Sample size calculation was based on the following equation [31].
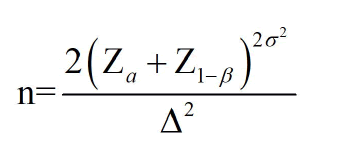
Where n is the required sample size, Za is considered accepted error for one-sided effect, which equal to 5% at 1.65. Z1–β is constant by convention according to power of study at 80% for value of 0.84. Δ is the significant change in facial proportion 1.600, with a standard deviation of the paired difference of 0.099 (based on standard deviation of 1.699 and a correlation between the paired observations of r 1⁄4 0.04) this value was estimated from previously published paper [28]. Therefore, the estimated sample size was 166 sample in each group after adding 10% for the possibility of non-parametric testing.
Facial proportions, height and width
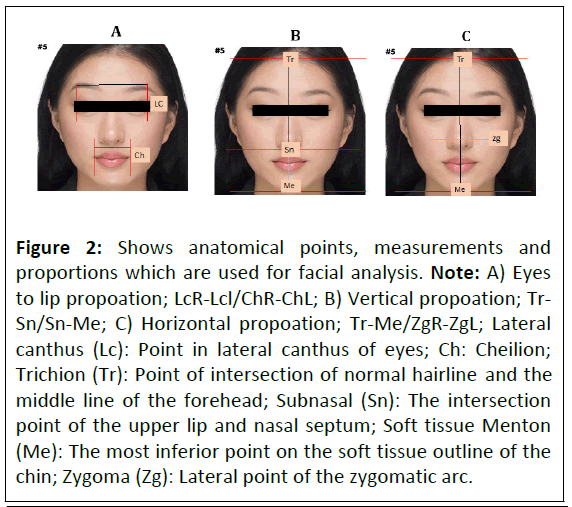
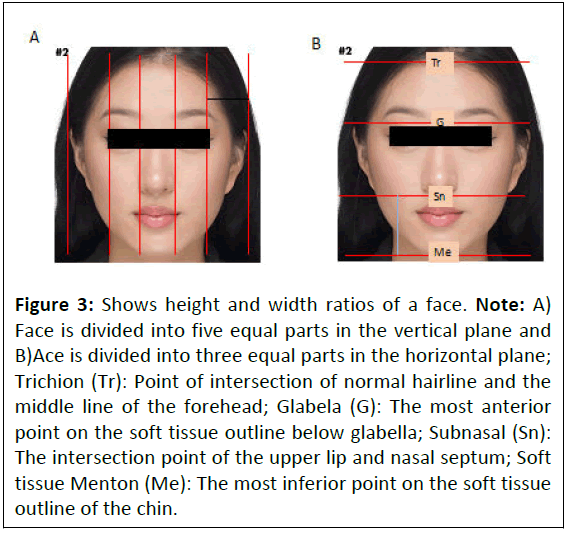
The following measurements were carried out using the facial proportions (Figure 2) derived from photograph A, image 5 of Figure 1, of the facial height, Trichion/Sub-nasal (Tr/Sn), facial width, Lateral canthus Right-Lateral canthus left/Cheilion Right- Cheilion Left (LcR-Lcl/ChR-ChL) and Trichion-gnathion/Zygoma Right-Zygoma Left (Tr-Me/ZgR-ZgL) using Microsoft PowerPoint (16.70 and 2.70.1, respectively). These measurements were compared with the Golden Proportions (GP) (1.600-1.699) and the photographs were subsequently categorized as normal, long or short (Table 1). The face is divided into three parts in the horizontal plane. The upper part is in between the Trichion (Tr) and Glabella (G), the middle part is in between the glabella and sub- nasal, and the lower part is in between the Subnasal (Sn) and Soft tissue Menton (Me) (Figure 3) derived from photograph A, image 2 from Figure 1. Additionally, a face is divided into five, vertical lines, to assess the transverse proportions from outer surface of pinna of the ears, to Lateral canthus (Lc) line to Inner canthus (Ic) both side of the face. These parts should be equal ideally in a normally proportioned face. Regarding measurement from the images, all measurement done was repeated by the five five co-authors for each image, since this is a health related study a Cohen’s kappa score as low as 0.41 might be acceptable.
Figure 2: Shows anatomical points, measurements and proportions which are used for facial analysis. Note: A) Eyes to lip propoation; LcR-Lcl/ChR-ChL; B) Vertical propoation; Tr- Sn/Sn-Me; C) Horizontal propoation; Tr-Me/ZgR-ZgL; Lateral canthus (Lc): Point in lateral canthus of eyes; Ch: Cheilion; Trichion (Tr): Point of intersection of normal hairline and the middle line of the forehead; Subnasal (Sn): The intersection point of the upper lip and nasal septum; Soft tissue Menton (Me): The most inferior point on the soft tissue outline of the chin; Zygoma (Zg): Lateral point of the zygomatic arc.
| Facial proportions | Values |
|---|---|
| LcR-Lcl/ChR-ChL | Normal (1.600-1.699) |
| Long (>1.699) | |
| Short (<1.6) | |
| Tr-Sn/Sn-Me | Normal (1.600-1.699) |
| Long (>1.699) | |
| Short (<1.6) | |
| Tr-Me/ZgR-ZgL | Normal (1.600-1.699) |
| Long (>1.699) | |
| Short (<1.6) | |
| Note: Lateral canthus (Lc): Point in lateral canthus of eyes; Ch: Cheilion; Trichion (Tr): Point of intersection of normal hairline and the middle line of the forehead; Subnasal (Sn): The intersection point of the upper lip and nasal septum; Soft tissue Menton (Me): The most inferior point on the soft tissue outline of the chin; Zygoma (Zg): Lateral point of the zygomatic arc. | |
Table 1: Different facial proportions and the normal values according to Golden Proportions (GP).
Figure 3: Shows height and width ratios of a face. Note: A) Face is divided into five equal parts in the vertical plane and B)Ace is divided into three equal parts in the horizontal plane; Trichion (Tr): Point of intersection of normal hairline and the middle line of the forehead; Glabela (G): The most anterior point on the soft tissue outline below glabella; Subnasal (Sn): The intersection point of the upper lip and nasal septum; Soft tissue Menton (Me): The most inferior point on the soft tissue outline of the chin.
Objective analysis
Finally, the three chosen photographs that represented the most attractive photographs were subjected to a software analysis application that was popular among girls who rated their beauty (Golden proportions face-face shape and rate your looks, version 6.0.3 updated on May 20, 2022).
Statistical analysis
Data were analyzed using IBM SPSS Statistical Software for Windows (26.0) (IBM Corp., Armonk, N.Y., USA). Descriptive statistics (mean, standard deviation, frequencies, and percentages of facial heights, widths, and proportions) were used to describe the quantitative and categorical variables. Pearson’s correlation was used to evaluate the association between the demographic data and the PFA, and subsequent comparisons were assessed using Tukey’s Honesty Significant Difference (HSD), which showed that the mean difference was significant at the 0.05 level. A nonparametric Pearson’s chisquare fitness test was used to observe the statistical significance of the responses toward different facial characteristics. Student’s t-test for independent samples and one-way analysis of variance followed by Tukey’s multiple comparison test were used to compare the means in relation to the categorical study variables that had two or more categories. A p-value of ≤ 0.05 was used to report the statistical significance of the results.
Results
Questionnaires
The first-stage questionnaires: A total of 488 participants reported differing opinions on the most important element that determines facial beauty. The three highest-ranked photographs were considered the base line photographs for the main study and subjected to a software analysis application that was popular among girls who rated their beauty (Golden Proportions Face-Face Shape and Rate Your Looks, version 6.0.3 updated May 20, 2022).
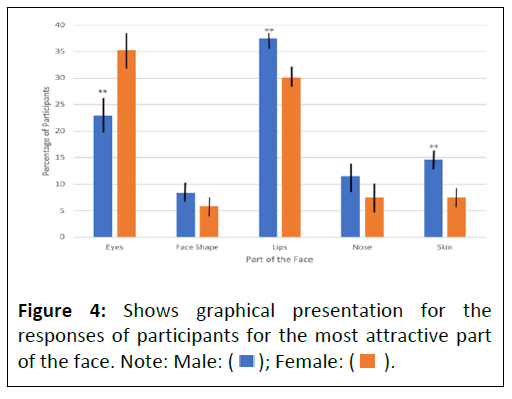
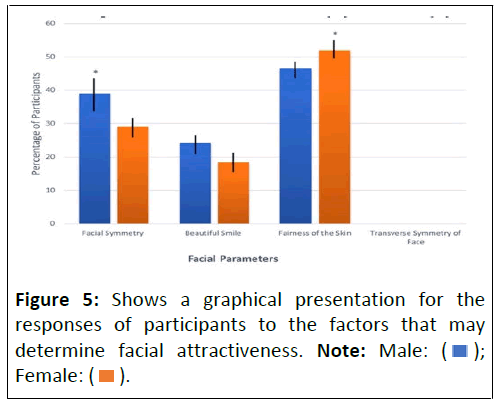
The main study questionnaires: The study reported that the most attractive parts of the face reported by the majority of study participants were the eyes (32.2%), followed by the lips (32.0%) which reported not statistically significant (Figure 4). The most attractive part of the face according to sex showed varied results, with the majority of females (35.3%) considering the eyes followed by the lips (30.1%), while the males considered the lips (37.5%) followed by the eyes (22.9%). These differences were statistically significant (p=0.001). The majority of study participants considered the fairness of the skin (46.6%), followed by facial symmetry (29.1%) and a beautiful smile (24.2%) as attractive features. These features were statistically significant according to sex (p< 0.01), age (p=0.021) and qualification (p=0.008) (Figure 5). According to the respondents, the most common factors determining the attractiveness of the face were the fairness of the skin (46.6%) followed by facial symmetry (29.1%). Gender-wise analysis revealed distinct preferences: Facial symmetry held greater importance for men (39.6), whereas women showed a stronger inclination toward the fairness of the skin (53.4%) (Figure 5). These features were reported to be statistically significant according to sex (p<0.01). The age cohorts of 20-24 and 40-44 attributed attractiveness to fairness of the skin at rates of 47.3% and 43.6% respectively. In contrast, participants aged>60 considered facial symmetry (47.1%) a pivotal factor. These differences were statistically significant (p=0.021). Respondents with secondary, Bachelor’s and Master’s degrees leaned towards valuing skin fairness. Conversely, those holding PhD degrees exhibited a preference for facial symmetry (47.0), marking a noteworthy disparity (p=0.008).
Facial proportions are considering 3 stages of images.
Considering photograph 1
The golden proportion face-face shape and rate your looks (version 6.0.3, updated May 20, 2022) reported an image 1 score of 8.89, which was categorized as fairly good.
Most study participants rated their beauty as neutral (score 3) (46.9%). The response to the beauty of the lady in Photograph No. 1 was found to be statistically significant according to the qualifications (p=0.027). Participants rated lips (29.6), followed by skin (25.3%), as the most attractive part of the face, which showed a significant difference between males and females (p= 0.008) (Figure 4).
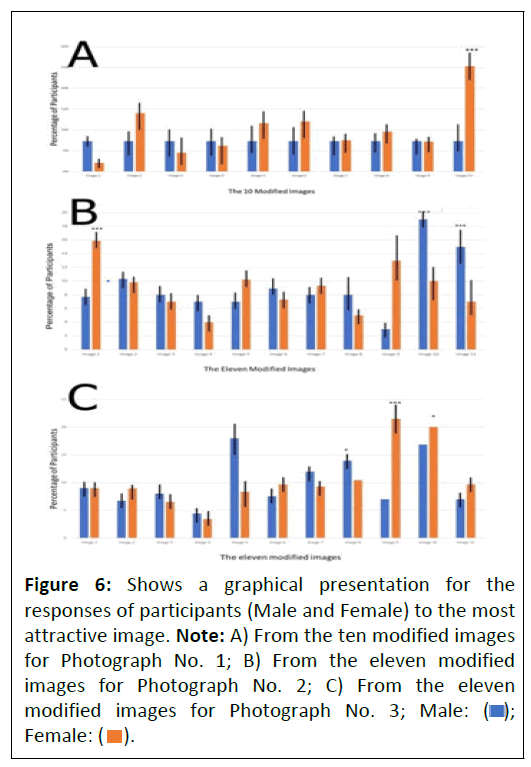
Following modification of the photograph, the majority of the participants chose the image with equal horizontal thirds (Image 10) (22.7%) as more attractive, followed by an image with a deviated eyebrow line (Image 5) (11.9%). The responses to the attractiveness of the 10 modified images according to sex and region were statistically significant (p <0.05). The majority of males chose images with equal vertical fifths (Image 9) (15.6%), while among females, it was an image with equal horizontal thirds (25.3%) (Figure 6A).
Figure 6: Shows a graphical presentation for the
responses of participants (Male and Female) to the most
attractive image. Note: A) From the ten modified images
for Photograph No. 1; B) From the eleven modified
images for Photograph No. 2; C) From the eleven
modified images for Photograph No. 3; Male: (  );
Female: (
 ).
).
Considering photograph 2
The golden proportion face-face shape and rate your looks (version 6.0.3 updated May 20, 2022) software reported an image 2 score of 9.29, which was categorized as perfect. The majority of study participants scored high scores; 75% of participants scored 5 and 4. These scores were statistically significant according to sex, qualification, and region. Variations were observed between the southern (highest score) and other regions of Saudi Arabia. Regarding education, the highest score was reported for participants with secondary qualifications compared to PhD holders. Females reported higher scores than males. Additionally, most participants agreed that the most attractive part of Photograph No. 2 was the eyes (52.8%), followed by the shape of the face.
Participants were asked to rate and compare attractive images among 10 images according to demographic factors. Most participants chose images with equal facial thirds (Image 10) (19.1%) as having the most beautiful quality, followed by images with black eyes (Image 11) (15.2%) (Figure 6B).
Considering photograph 3
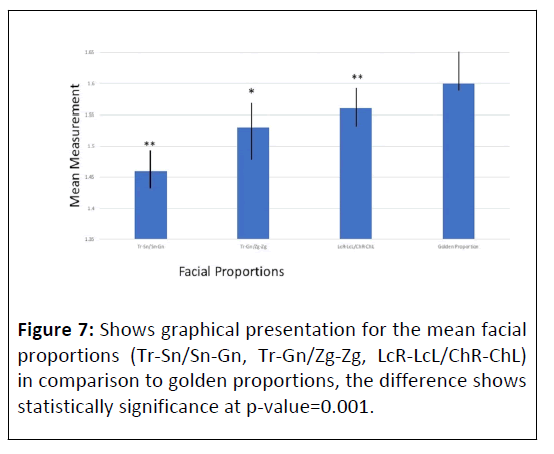
The golden proportion using software (face-face shape and rate your looks) (version 6.0.3, updated May 20, 2022) reported an Image 3 score of 8.70, which was categorized as fairly good. Most study participants (85%) had high scores for this photograph. The parameters were found to be statistically significant according to age, sex (p<0.001), and qualifications (p<0.001). The younger age group reported a statistically significant difference compared with the elderly participants. Moreover, Bachelor’s degree holders reported higher scores than all other qualification holders. The majority of the participants (26.5%) found the face shape to be the most attractive part in Photograph No. 3, followed by the eyes (21.0%). Participants were asked to rate the modified images. Most participants chose images that were modified to have equal horizontal facial thirds (Image 10) (16.8%) as most attractive, followed by an image that was modified to have equal vertical facial fifths (Image 9) (12.6%) (Figure 6C). The mean and standard deviation for the measurements of facial heights, widths, and proportions for the images that reported the highest score are summarized in Tables 2 and 3. The facial proportions for all the selected images deviated from the GPs (Table 4). The majority of the assessed facial proportions (83%) for the selected images were shorter than the GPs at 1.52, whereas 17% of the assessed proportions coincided with the GP at 1.61. This difference was statistically significant (p<0.001).
| Parameters | Photo | Mean | Standard deviation | F-value | p-value | Significance |
|---|---|---|---|---|---|---|
| Tr-Me | Photograph 3 | 9.08 | 0.08 | 19.76 | 0.001 | S |
| Photograph 2 | 10.11 | 0.4 | ||||
| Photograph 1 | 8.99 | 0.25 | ||||
| Tr-Sn | Photograph 3 | 6.33 | 0.16 | 2.99 | 0.101 | NS |
| Photograph 2 | 6.76 | 0.24 | ||||
| Photograph 1 | 6.23 | 0.47 | ||||
| Sn-Me | Photograph 3 | 2.75 | 0.08 | 18.82 | 0.001 | S |
| Photograph 2 | 3.18 | 0.14 | ||||
| Photograph 1 | 2.86 | 0.05 | ||||
| Zg-Zg | Photograph 3 | 4.78 | 0.12 | 14.19 | 0.002 | S |
| Photograph 2 | 5.71 | 0.01 | ||||
| Photograph 1 | 4.18 | 0.69 | ||||
| LcR (right)-LcL (left) | Photograph 3 | 4.58 | 0.05 | 27.86 | 0.001 | S |
| Photograph 2 | 5.15 | 0 | ||||
| Photograph 1 | 4.57 | 0.21 | ||||
| ChR (right)-ChL (left) | Photograph 3 | 2.71 | 0.1 | 52.09 | 0.001 | S |
| Photograph 2 | 2.84 | 0 | ||||
| Photograph 1 | 2.36 | 0.05 | ||||
| Tr-Sn/Sn-Me | Photograph 3 | 1.43 | 0.02 | 1.73 | 0.23 | NS |
| Photograph 2 | 1.47 | 0.02 | ||||
| Photograph 1 | 1.45 | 0.03 | ||||
| Tr-Gn/Zg-Zg | Photograph 3 | 1.52 | 0.01 | 6.23 | 0.02 | S |
| Photograph 2 | 1.6 | 0.02 | ||||
| Photograph 1 | 1.46 | 0.08 | ||||
| Note: Lateral canthus (Lc): Point in lateral canthus of eyes; Cheilion (Ch): Corner of the mouth; Trichion (Tr): Point of intersection of normal hairline and the middle line of the forehead; Subnasal (Sn): The intersection point of the upper lip and nasal septum; Soft tissue Menton (Me): The most inferior point on the soft tissue outline of the chin; Zygoma (Zg): Lateral point of the zygomatic a; S: Significant; NS: Not significant. | ||||||
Table 2: The mean and standard deviation for the measurements of facial heights, width, and proportions for the images that reported the highest scores.
| Parameters | Photo | Mean | Type | Standard deviation | F-value | p-value | Significance |
|---|---|---|---|---|---|---|---|
| LcR-LcL/ChR-ChL | Photograph 3 | 1.61 | Normal | 0.01 | 135.74 | 0.001 | S |
| Photograph 2 | 1.55 | Short | 0 | ||||
| Photograph 1 | 1.51 | Short | 0.01 | ||||
| Lcl/inc | Photograph 3 | 1.47 | Short | 0.02 | 115.46 | 0.001 | S |
| Photograph 2 | 1.79 | Long | 0 | ||||
| Photograph 1 | 1.41 | Short | 0.06 | ||||
| InC | Photograph 3 | 1.64 | Normal | 0.09 | 1.03 | 0.396 | NS |
| Photograph 2 | 1.6 | Normal | 0 | ||||
| Photograph 1 | 1.66 | Normal | 0.04 | ||||
| lcR-INC | Photograph 3 | 1.47 | Short | 0.02 | 27.59 | 0.001 | S |
| Photograph 2 | 1.74 | Long | 0.03 | ||||
| Photograph 1 | 1.45 | Short | 0.1 | ||||
| Upper | Photograph 3 | 3.37 | - | 0.18 | 23.68 | 0.001 | S |
| Photograph 2 | 3.62 | - | 0.2 | ||||
| Photograph 1 | 2.8 | - | 0.11 | ||||
| Middle | Photograph 3 | 2.94 | - | 0.02 | 2.78 | 0.114 | NS |
| Photograph 2 | 3.12 | - | 0.05 | ||||
| Photograph 1 | 3.2 | - | 0.27 | ||||
| Lower | Photograph 3 | 2.75 | - | 0.09 | 14.66 | 0.001 | S |
| Photograph 2 | 3.17 | - | 0.15 | ||||
| Photograph 1 | 2.85 | - | 0.08 | ||||
| Note: Lateral canthus (Lc): Point in lateral canthus of eyes; Cheilion (Ch): Corner of the mouth; Trichion (Tr): Point of intersection of normal hairline and the middle line of the forehead; Subnasal (Sn): The intersection point of the upper lip and nasal septum; Soft tissue Menton (Me): The most inferior point on the soft tissue outline of the chin; Zygoma (Zg): Lateral point of the zygomatic a; S: Significant; NS: Not significant. | |||||||
Table 3: The mean and standard deviation for the measurements of facial heights, width, and proportions for the images that reported the highest scores.
| Golden proportions | Result | N | Mean | Standard deviation | P-value |
|---|---|---|---|---|---|
| (1.600-1.699) | Below | 12 | 1.5219 | 0.05576 | 0.001 HS |
Table 4: The mean values for the selected top 12 photographs that received Highest Scores (HS).
Objective analysis
Moreover, the selected photographs with the highest score subjected to objective assessment again using the respective software (golden proportions face-face shape and rate your looks, Face Technology Company, version 6.0.3 updated May 20, 2022) reported all the top three attractive faces at scores of 8.93, 8.97, and 8.57 for photographs 1, 2, 3, respectively. However, the same software reported scores of 8.89, 9.29 and 8.70 for the images before modification. Therefore, the perception of facial beauty among the Saudi population is inconsistent with the Golden Proportions. They are shorter than the gold standard, and, according to the software, fair rather than perfect faces were considered attractive (Figure 7).
Discussion
This study aimed to determine the PFA and ideal standards of facial beauty among Saudi citizens. These findings could provide guidelines for clinicians for improving facial aesthetics. The study reported that PFA among the Saudi population is inconsistent with the golden proportions. The majority of study participants considered the eyes and lips to be the most attractive parts of the face; there was a statistically significant difference between males and females in this regard. Regarding facial analysis, a higher score was reported for short facial morphology than for normal facial morphology (17%). Moreover, equal facial thirds were perceived as the most attractive faces in the chosen photos. PFA is a subjective entity that depends on many factors, such as facial beauty, level of education, ethnicity, and race [29]. This study assessed the PFA among the Saudi population based on an evaluation of photographs of attractive females from a universal benchmark dataset, considering a variety of cofactors and excluded candidate with psychological issues. The count study reported significant difference on perception of asymmetrical face and level of education. Bashour found four important cues that determine attractiveness: Averageness, sexual dimorphism youthfulness, and symmetry [10]. Borelli and Berneburg state that perceptions of attractiveness are subject to trends. However, the observer’s background, social status, and educational level play a role in the assessment and perception of other individuals’ attractiveness [32]. The study reported statistical differences between the eyes and lips, as both were perceived as the most attractive parts of the face by female and male participants, respectively. All the photographs that scored the highest depicted normal fullness (25%) of the lip and lip-tochin proportions were 30%-70%, respectively. Image 3, which had the highest score, shows normal lip-to-eye proportions consistent with GP. The other females reported short eye-to-lip proportions due to either a wider eye or a narrow lip line for photographs 1 and 2, respectively. Mack (1991) reported that the lower 1/3rd of the face signi icantly influences the facial appearance and confirmed his statement with evidence of public preoccupation with lip fullness and the importance of a pleasing smile [33]. They pointed out the importance of preserving 30% of the upper lip and 70% of the lower lip-to-chin proportions a ter surgery or facial rejuvenation. A study conducted in Germany assessing the perception of facial attractiveness concluded that childlike features combined with signs of maturity, such as high cheekbones, symmetry, averageness, and expressive features, are considered attractive in women [30]. In Saudi Arabia, a study was conducted to evaluate the effect of lip aesthetics on facial attractiveness, reporting an upper-to-lower lip ratio of 1:2 and natural lip fullness of 25%, which was considered the most attractive feature for participants aged>20 years. In contrast, younger patients preferred a lip fullness of 50% [14]. Female participants in this study voted for the eye as the most attractive part of the face. In fact, the eyes are central to the face and are the first facial structures to be identi ied when evaluating a face, followed by the nose and lips. Studies have shown that the intercanthal distance affects perceptions of beauty and personality [33].
They reported that a 10% increase in the intercanthal distance from normal (GP equal i ths: 1:1) was perceived by laypersons as a signi icant increase in a female participant's submissiveness, friendliness and attractiveness [34]. A review by Buchanan, et al. examining the perception of eye beauty concluded that symmetry, averageness, and feature size determine the perception of eye attractiveness and beauty [34]. The degree of asymmetry is inversely correlated with perceived attractiveness [34]. Similarly, another study examined the following factors that could cause eye asymmetry: Area of the brow, eyelid margin, eyelid skin fold, globe prominence, and cheek projection [35]. The participants were asked about their opinions regarding the most attractive facial factor. Signi icant differences were noted in the sex, age and educational demographic variables concerning this question. However, Photograph No. 3, which reported the highest score for attractiveness in this study, had facial asymmetry at the smile line; unexpectedly, when this asymmetry was adjusted using software “Photograph 3 modification image 8” (Figure 1), it was not ranked at a high score, as expected. Studies have demonstrated asymmetry detection thresholds and perceived that the severity of asymmetry varies in distinct facial zones, e.g., it was estimated at 2 mm or more in eyelid closure, and 3 mm or more while smiling [36]. Thus, Photograph No. 3 showed large eyes, prominent cheeks, full lips and a small chin. Female face attractiveness is reportedly greater when the face is symmetrical, close to average and has certain features (e.g., large eyes, prominent cheekbones, thick lips, thin eyebrows and a small nose and chin), according to studies conducted in France [37]. Fink, et al. assessed the PFA of symmetrical and asymmetrical faces. They concluded that faces with high symmetry received significantly higher ratings for attractiveness, health, and certain personality attributes (i.e., sociability, intelligence, liveliness, self-confidence, and balance). Faces with low symmetry were rated as more anxious [6]. In contrast, two studies assessed the PFA in relation to facial asymmetry and averageness of female faces. They concluded that the attractiveness of female faces was not affected by the level of asymmetry but by the level of averageness [38,39]. Another study examined the perception of personality and facial attractiveness in relation to asymmetrical female faces and claimed that asymmetry did not affect the level of attractiveness and openness; however, they were rated as more neurotic, less agreeable, and less conscientious than normal (symmetrical faces) [40].
Internationally, the assessment of facial beauty depends on the GP. GP is a mathematical algorithm developed by the ancient Greek mathematician Euclid [41]. It was called extreme or mean ratio by Euclid and divine proportion by Pacioli, et al. [41,42]. This ratio plays a significant role in the definition of beauty and facial attractiveness and has been used by clinicians for developing software’s for facial masks and research [43-46]. The assessment of the vertical and horizontal proportions demonstrated a significant difference from the GP. These results were consistent with those of several other studies. Many studies reported no correlation between facial beauty and GP [10,15,28,29,47-49]. In this study, the photographs that reported the highest scores were for the modified photographs depicting equal horizontal thirds and short facial morphology had significantly higher scores than the photographs corresponding to GP. However, overall, according to the facial analysis results, narrow and shorter facial morphology was perceived as an attractive face in Saudi culture, and these measurements reported significant differences when compared to the gold standard GP. This result was consistent with the study conducted in Belgrade, where females with smaller face and uniform facial thirds and fifths were considered attractive [50]. Based on this study, shorter and narrower facial proportions in comparison with GP were perceived to be attractive in Saudi culture. Facial attractiveness depends on many factors, and gold standards are not the only ones that determine facial beauty. While evaluating facial attractiveness, it is important to realize that such an assessment is subjective and influenced by multiple factors, among which the most important are cultural background and specific training. Surgeons and clinicians should consider cultural, environmental and genetic factors when managing facial aesthetics. This study has several limitations. A selection bias exists since all the individuals in the photograph were selected from the Internet and were all female. Given that participants were drawn from those available in the public domain with a clear, high-resolution AP image of the face, this resulted in a selection bias among participants in the database. As this was an observational study, we were unable to determine whether a change in an emotional expression or personal trait directly affected other perceptions. It would have been ideal to have an animated, 3-dimensional photograph in the database. Another limitation of the current study is that the selected photographs were obtained from an international database; it would have been ideal to use a national database for selecting the photographs of attractive individuals.
Conclusion
Based on this study, shorter and narrower facial proportions in comparison with GP were perceived to be attractive in Saud culture. Facial attractiveness depends on many factors, and gold standards are not the only ones that determine facial beauty. While evaluating facial attractiveness, it is important to realize that such an assessment is subjective and influenced by multiple factors, among which the most important are cultural background and specific training. Surgeons and clinicians should consider cultural, environmental and genetic factors when managing facial aesthetics.
References
- Giddon DB (1995) Orthodontic applications of pschological and perceptual studies of facial esthetics. Semin Orthod 1: 82-93.
[Crossref], [Google Scholar], [Indexed]
- Rhodes G, Proffitt F, Grady JM, Sumich A (1998) Facial symmetry and the perception of beauty. Psychon Bull Rev 5 :659-669.
[Crossref], [Google Scholar]
- Ackerman D (1990) A natural history of the senses. (1st Edition), Vintage, Random House. New York: 1-331.
- Wolf N (1990) The beauty myth: How images of beauty are used against women. Choice Reviews Online 29: 3000-3031.
- Zheng S, Chen K, Lin X, Liu S, Han J, et al. (2022) Quantitative analysis of facial proportions and facial attractiveness among Asians and Caucasians. Math Biosci Eng 19: 6379-6395.
[Crossref], [Google Scholar], [Indexed]
- Fink B, Neave N, Manning JT, Grammer K (2006) Facial symmetry and judgements of attractiveness, health and personality. Pers Individ Dif 41: 491-499.
- Mesaros A, Cornea D, Cioara L, Dudea D, Mesaros M, et al. (2015) Facial attractiveness assessment using illustrated questionnairers. Med Pharm Rep 88 : 73-78.
- Jones D, Hill K (1993) Criteria of facial attractiveness in five populations. Hum Nat 4: 271-296.
[Crossref], [Google Scholar], [Indexed]
- Nabeel T, Mohammad A (2008) Perception of facial profile attractiveness by a Saudi sample. Saudi Dent J 20: 17-23.
- Bashour M (2006) History and current concepts in the analysis of facial attractiveness. Plast Reconstr Surg 118: 741-756.
[Crossref], [Google Scholar], [Indexed]
- Shen H, Chau DKP, Su J, Zeng L, Jiang W, et al. (2016) Brain responses to facial attractiveness induced by facial proportions: Evidence from an fMRI study. Sci Rep 6: 1-13.
[Crossref], [Google Scholar], [Indexed]
- Michael RC, Alan RR, Anita PB, Perri BD, Cheng-Huan W (1995) Their ideas of beauty are, on the whole, the same as ours”: Consistency and variability in the cross-cultural perception of female physical attractiveness. J Pers Soc Psychol 68: 261-279. [Crossref],
- Alkanhal H, Alsaggabi S, Alshammari D, Alasmari S, Alabdulwahhab B, et al. (2016) Perception of facial profile attractiveness in middle east population. Int J Curr Res 8: 41169-41174.
- Radwan W, Almutairy GFN, Aldayel NSA, Althowaini NAA, Alhabib TAS (2021) Female lip esthetic and its effect on facial attractiveness in Saudi Arabia. Int J Esthet Dent 16: 232-242.
[Google Scholar], [Indexed]
- Jung GH, Jung S, Park HJ, Oh HK, Kook MS (2018) Factors influencing perception of facial attractiveness: Gender and dental education. J Craniofac Surg 29: e170–e175.
[Crossref], [Google Scholar], [Indexed]
- Saponaro G, Gasparini G, Boniello R, Pelo S, Doneddu P, et al. (2018) The rules of attractiveness: A study on the lower facial third. J of Craniofac Surg 29: 1945-1946.
[Crossref], [Google Scholar], [Indexed]
- Marianetti TM, Gasparini G, Midulla G, Grippaudo C, Deli R, et al. (2016) Numbers of beauty: An innovative aesthetic analysis for orthognathic surgery treatment planning. Bio-med Res Int 2016: 1-6.
[Crossref], [Google Scholar], [Indexed]
- Arnett GW, Gunson MJ (2004) Facial planning for orthodontists and oral surgeons. Am J Orthod Dentofacial Orthop 126: 290-295.
[Crossref], [Google Scholar], [Indexed]
- Liew S, Wu WTL, Chan HH, Ho WWS, Kim HJ, et al. (2016) Consensus on changing trends, attitudes, and concepts of Asian beauty. Aesthetic Plast Surg 40: 193-201.
[Crossref], [Google Scholar], [Indexed]
- Rhee SC, An SJ, Hwang R (2017) Contemporary Koreans’ perceptions of facial beauty. Arch Plast Surg 44: 390-399.
[Crossref], [Google Scholar], [Indexed]
- Al-Yahya T, AlOnayzan A, AlAbdullah Z, Alali K, Althabit F (2020) The impact of social media engagement on body image and increased popularity toward seeking cosmetic surgery. International Journal of Medicine in Developing Countries 4: 1887-1892.
- Kashmar M, Alsufyani MA, Ghalamkarpour F, Chalouhi M, Alomer G, et al. (2019) Consensus opinions on facial beauty and implications for aesthetic treatment in middle eastern women. Plast Reconstr Surg Glob Open 7: e2220-2228.
- Xie D, Liang L, Jin L, Xu J, Li M (2015) "SCUT-FBP: A benchmark dataset for facial beauty perception. 2015 IEEE International Conference on Systems, Man and Cybernetics: 1821-1826.
[Crossref]
- Liang L, Lin L, Jin L, Xie D, Li M (2018) SCUT-FBP5500: A diverse benchmark dataset for multi-paradigm facial beauty prediction. Cornell University: 1-6.
- Xu L, Xiang J (2020) ComboLoss for facial attractiveness analysis with squeeze-and-excitation networks. Computer Science 2: 27-31.
- Xu J, Jin L, Liang L, Feng Z, Xie D (2017) Facial attractiveness prediction using Psychologically Inspired Convolutional Neural Network (PI-CNN). IEEE International Conference: 1657-1661.
[Crossref], [Google Scholar]
- Packirisamy V, Sadacharan CM (2021) Preference of eyebrow apex positions on different facial shapes in Malaysian population: An inter‐ethnic study. J Cosmet Dermatol 20: 3991-4000.
[Crossref], [Google Scholar], [Indexed]
- Kaya K, Türk B, Cankaya M, Seyhun N, Coskun B (2019) Assessment of facial analysis measurements by golden proportion. Braz J Otorhinolaryngol 85: 494-501.
[Crossref], [Google Scholar], [Indexed]
- Aldhorae K, Alqadasi B, Altawili ZM, Assiry A, Shamalah A (2020) Perception of dental students and laypersons to altered dentofacial aesthetics. J Int Soc Prev Community Dent 10: 85-95.
[Crossref], [Google Scholar], [Indexed]
- de Carvalho Barbosa PB, Santos PL, de Carli JP, Luiz de Freitas PH, Pithon MM, et al. (2017) Aesthetic facial perception and need for intervention in laterognathism in women of different ethnicities. J Craniomaxillofac Surg 45: 1600-1606.
[Crossref], [Google Scholar], [Indexed]
- Kadam P, Bhalero S (2010) Sample size calculation. Int J Ayurveda Res 10: 55-57.
[Crossref], [Google Scholar], [Indexed]
- Borelli C, Berneburg M (2009) “Beauty lies in the eye of the beholder”? Aspects of beauty and attractiveness. J Dtsch Dermatol Ges 8: 326-30.
[Crossref], [Google Scholar], [Indexed]
- Mack MR (1991) Vertical dimension: A dynamic concept based on facial form and oropharyngeal function. J Prosthet Dent 66: 478-485.
[Crossref], [Google Scholar], [Indexed]
- Naran S, Wes AM, Mazzaferro DM, Bartlett SP, Taylor JA (2018) More than meets the eye: The effect of intercanthal distance on perception of beauty and personality. J Craniofac Surg 29: 40-44.
[Crossref], [Google Scholar], [Indexed]
- Buchanan AG, Holds JB, Holds JB (2011) The beautiful eye: Perception of beauty in the periocular area. Springer New York: 25-29.
[Crossref], [Google Scholar]
- Hohman MH, Kim SW, Heller ES, Frigerio A, Heaton JT, et al. (2014) Determining the threshold for asymmetry detection in facial expressions. Laryngoscope 124: 860-865.
[Crossref], [Google Scholar], [Indexed]
- Baudouin JY, Tiberghien G (2004) Symmetry, averageness, and feature size in the facial attractive-ness of women. Acta Psychol (Amst) 117: 313-332.
- Valentine T, Darling S, Donnelly M (2004) Why are average faces attractive? The effect of view and averageness on the attractiveness of female faces. Psychon Bull Rev 11: 482-487.
[Crossref], [Google Scholar], [Indexed]
- Zheng R, Ren D, Xie C, Pan J, Zhou G (2021) Normality mediates the effect of symmetry on facial attractiveness. Acta Psychol (Amst) 217: 1-7.
[Crossref], [Google Scholar], [Indexed]
- Noor F, Evans DC (2003) The effect of facial symmetry on perceptions of personality and attractiveness. J Res Pers 37: 339-347.
[Crossref], [Google Scholar]
- Williams K, Artmann B (1999) Euclid-The creation of mathematics. Springer New York, NY 2: 195–196.
- Pacioli L (2023) Divina proportione. Venice: Luca Paganinem de Paganinus de Brescia: 1509.
- Marquardt SR (2002) Dr. Stephen R. Marquardt on the Golden Decagon and human facial beauty. Interview by Dr. Gottlieb. J Clin Orthod 36: 339-347.
[Google Scholar], [Indexed]
- Prokopakis EP, Vlastos IM, Picavet VA, Nolst Trenite G, Thomas R, et al. (2013) The golden ratio in facial symmetry. Rhinology 51: 18–21.
[Crossref], [Google Scholar], [Indexed]
- Kiekens RMA, Kuijpers-Jagtman AM, van’t Hof MA, van’t Hof BE, Maltha JC (2008) Putative golden proportions as predictors of facial esthetics in adolescents. Am J Orthod Dentofacial Orthop 134: 480-483.
[Crossref], [Google Scholar], [Indexed]
- Kawakami S, Tsukada S, Hayashi H, Takada Y, Koubayashi S (1989) Golden proportion for maxillofacial surgery in Orientals. Ann Plast Surg 23: 417-425.
- Medici Filho E, Martins MV, dos Santos da Silva MA, Castilho JC, de Moraes LC, et al. (2007) Divine proportions and facial esthetics after manipulation of frontal photographs. World J Orthod 8: 103-108.
[Google Scholar], [Indexed]
- Mizumoto Y, Deguchi T, Fong KWC (2009) Assessment of facial golden proportions among young Japanese women. Am J Orthod Dentofacial Orthop 136: 168-174.
[Crossref], [Google Scholar], [Indexed]
- Shah R, Nair R (2022) Comparative evaluation of facial attractiveness by laypersons in terms of facial proportions and equate its deviation from divine proportions-A photographic study. J Oral Biol Craniofac Res 12: 492-499.
[Crossref], [Google Scholar], [Indexed]
- Milutinovic J, Zelic K, Nedeljkovic N (2014) Evaluation of facial beauty using anthropometric proportions. Sci World J 2014: 1-8.
[Crossref], [Google Scholar], [Indexed]
Open Access Journals
- Aquaculture & Veterinary Science
- Chemistry & Chemical Sciences
- Clinical Sciences
- Engineering
- General Science
- Genetics & Molecular Biology
- Health Care & Nursing
- Immunology & Microbiology
- Materials Science
- Mathematics & Physics
- Medical Sciences
- Neurology & Psychiatry
- Oncology & Cancer Science
- Pharmaceutical Sciences
