ISSN : 2349-3917
American Journal of Computer Science and Information Technology
The Impacts of Reliability on the Spread of the Frequency Deviation over Power Network.
Wen Ming Zhang*, Chao Shen and Wei Zhu
Shanghai Electric High Voltage Industrial Co. Ltd., Shanghai, China
- *Corresponding Author:
- Zhang WM
Shanghai Electric High Voltage Industrial Co. Ltd., Shanghai, China
E-mail: papers666@163.com
Received date: August 29, 2018; Accepted date: September 28, 2018; Published date: October 08, 2018
Citation: Zhang WM, Shen C, Zhu W (2018) The Impacts of Reliability on the Spread of the Frequency Deviation over Power Network. Am J Compt Sci Inform Technol Vol.6 No.3:29
Copyright: © 2018 Zhang WM, et al. This is an open-access article distributed under the terms of the Creative Commons Attribution License, which permits unrestricted use, distribution, and reproduction in any medium, provided the original author and source are credited.
Abstract
The reliability of power system has received increasing attentions, in this paper, we apply the epidemic propagation model with the reliability each location in social networks to analyze the spread of significant frequency changes over power network, these will be discussed the impacts of reliability on the spread of the frequency deviation over power network. Theory analysis and computer simulation show that reliability rate reshapes the critical threshold of spreading dynamics and brings a nonlinear impact on the final size of frequency oscillation.
Keywords
Frequency oscillation; Power network; Epidemic propagation model; Reliability
Introduction
Currently the electricity power infrastructure is highly vulnerable against many forms of natural or malicious physical events [1,2]. Around the world, the number of outages affecting large populations has steadily risen in the past decade, causing enormous economic losses [3,4]. The frequency is one of the most important metrics of power system and significant frequency deviation may cause system instability and the damage of electronic devices, the analysis of frequency fluctuation, particularly how the frequency oscillation is propagated through the power network, is hence a key task to maintain a sustainable power grid with security and stability in consideration. The reliability of power system attract more and more attention, and reliability evaluation of a complete electric power system including generation, transmission, station and distribution facilities is an important ability in overall power system planning and operation [5]. Due to the enormity of the problem, reliability analysis is not usually conducted on complete power systems and reliability evaluations of generating facilities, transmission systems, station configurations, and of distribution system segments are usually performed independently. There are many benefits associated with the ability to perform overall system reliability evaluation [6].
Note that the frequency stability of power grid has been widely studied in the community of power systems [3]. However, most of them are based on complicated modeling of generators and transmission lines, and require the analysis of dynamics. In a sharp contrast, our study is uses a phenomenological mathematical model. Meanwhile, there are also many studies on power systems from the viewpoint of complex networks [7,8]. These studies are completely focused on the power grid topology and the corresponding implications. There are many studies presented an excellent study on the dynamics of cascading failures in power network [9-11].
The difference of our paper is that our study is more focused on the frequency oscillations instead of cascading failure. The objective of this research is to analyze the spread of significant frequency changes over power network, these will be discussed the impacts of reliability on the spread of the frequency deviation over power network. The methodology of the study is applying the epidemic propagation model with the reliability each location in social networks to research the propagation of frequency fluctuation in power network. The propagation of frequency fluctuation is modeled as the spread of epidemic disease process, and the change of frequency hence spreads over a structure containing interconnected power grid components.
The organization of this paper is as follows. In the next section, we introduce the SIR epidemic model with the reliability each location in social networks. We investigate the dynamic behaviors of the spread of the frequency deviation in power network; obtain the critical threshold of spreading dynamics. In numerical simulation, we investigate the computer simulation to show the reliability rate reshapes the critical threshold of spreading dynamics and brings a nonlinear impact on the final size of size of frequency oscillation. Finally, we will give the main conclusions in conclusion section.
The spread of the frequency deviation SIR model in power network
The logic network for the power network used to investigate the propagation of frequency, we can consider the frequency deviation as a disease and the different locations of power network as a social network. Hence, the mathematical analysis of epidemic propagation along with many fruitful results and powerful tools is applied to model the frequency oscillation in power network. Particularly, we will use the SIR model to describe the spread of epidemic disease [4,12], the SIR model defines three population types: suspicious people (S) defined as people that could be infected by the disease, and infected people (I) defined as people that are infected by the disease. And removed people (R) defined as people that recovered from the disease. Suspicious people contact their friends in the social network with a contact rate and could become sick; meanwhile infected people recover with a rate and become removed. By using the similarity between the social network and power network, we can consider a significant frequency deviation as the epidemic. Each location is considered as a person, while its neighbors in the logic network can be considered as its friends in the social network. Once its frequency deviates from the original value with a significant offset, we consider it as being infected. Once it falls back to the original value, it is recovered from the disease.
In this model, denotes the locations are in reliable state, while presents the locations are in unreliable state. Every location has the following six states: reliable suspicious (SJ), unreliable suspicious (Su), reliable infected (Ir), unreliable infected (Iu), reliable removed (Rr), unreliable removed (Ru), We give a reliability rate α to each location. Specifically, the probability of a location will be in unreliable state with probability α and in reliable state with probability (1-α).
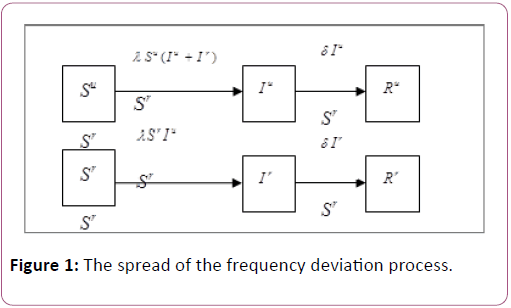
The spread of the frequency deviation process can be shown in Figure 1.
The Figure 1 has shown the spreading process which describes the state changes of suspicious and infected in complex networks. The frequency deviation spreading process will begins with the following either situation: 1) An unreliable suspicious location will contact with all infected it links to directly and it will become an unreliable infected with probability λ; 2) A reliable suspicious meets with an unreliable infected and interacts with it, then the reliable node will become a reliable infected one with probability λ. Furthermore, considering recover mechanism, reliable infected and unreliable infected can switch their states into reliable removed and unreliable removed, respectively, at rate.

Where (k) denotes the average degree of the power network; The total number of location frequency deviation spreading procession is N, and it needs to be described by standard in order to facilitate understand the dynamic process, we assumed that Su (t)+Sr (t)+Iu (t)+Ir (t)+Ru (t)+Rr (t)=1. We can get the mean-field equations of S (t), I (t) and R(t) of homogeneous power networks by adding reliable and unreliable in same degree, in other words, Su (t)+Sr (t)+S (t), Iu (t)+Ir (t)=I (t), Ru (t) +Rr (t)=R (t), which has been shown as:

At the beginning of frequency deviation spreading, nearly no
location infected. So provide that at first, one unreliable infected
exists in the network, and the left suspicious location. So the
initial condition for frequency deviation transmission is S (0) ≈ 0,
I (0) ≈ 1 and R (0)=0. In the final equilibrium state, only
suspicious and recovered are remaining. The final size of
frequency deviation R will be calculated to weigh the level of
frequency deviation influence. Here  and it will be deduced below in this section.
We discuss the final size R to investigate the spreading threshold in homogeneous networks by analyzing the meanfield Equation 2.

that is,

Equation (4)’s both sides are integrated for R (t) and I (t) from instability to equilibrium. Noticing the initial condition and when t → ∞, I (∞)=1-R (∞)=1-R we can get the following equation:

where 
Only when ε>1, Equation (5) will get a non-zero solution. For δ ≠ 0, the following condition will be satisfied:

Which can be deduced to get the constraint λ>λc, in that the
threshold  is associated with homogeneous
networks and reliable rate.Meanwhile, noting that λc does not
always make sense. If
  will be greater than
1; namely, when the reliable rate is under a certain threshold,
final transmission scale will be relatively narrow whatever the
spreading rate is; similarly, threshold of activity rate can be also
got from:
Numerical simulation
In this section, theoretical prediction is validated by performing the numerical simulations. As described above, our studies are mainly focused on US power network whose average degree <k>=2.67 and network size N=4941 [13,14].
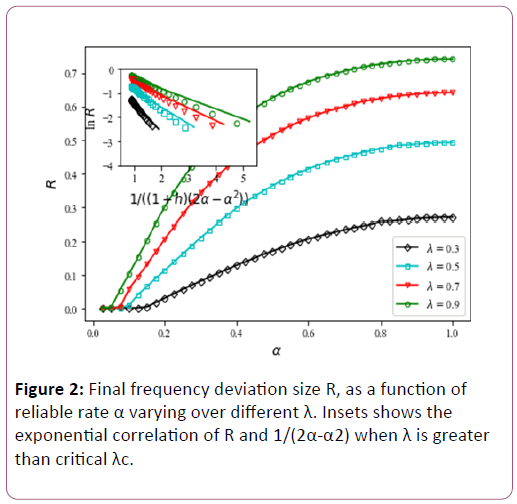
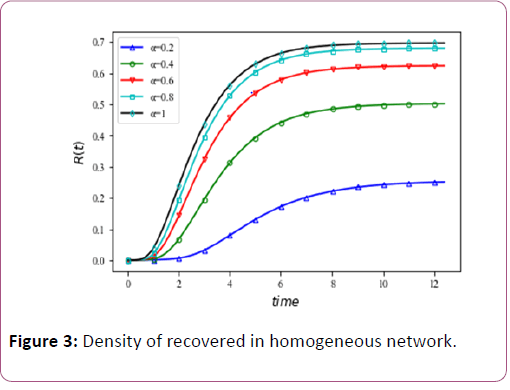
Figures 2 and 3 displays that the impact reliable rate has on critical spreading rate. In the desire to further study spreading process, R is numerically fitted to stretched exponential function of λ and α when λ>λc and α>αc respectively.
Conclusion
In this paper, we have studied the frequency oscillation in power networks by considering the frequency oscillation as epidemic propagation and the power network as a social network. We investigate the computer simulation to show the reliability rate reshapes the critical threshold of spreading dynamics and brings a nonlinear impact on the final size of size of frequency oscillation.
References
- Liu CC, Jung J, Heydt GT (2000) The strategic power infrastructure defense (SPID) system, A C design. IEEE Control Sys 20: 40-52.
- Li H, Rosenwald GW, Jung J (2005) Strategic power infrastructure defense. Proc IEEE 93: 918-933.
- Amin M, Schewe PF (2007) Preventing blackouts. Sci Am 296: 60-67.
- Ma H, Li H, Han Z (2012) A framework of frequency oscillation in power grid: Epidemic propagation over social networks, Computer Communications Workshops (INFOCOM WKSHPS). IEEE Conference 2012: 67-72.
- Billinton R, Jonnavithula S (1996) A test system for teaching overall power system reliability assessment. IEEE Trans Power Sys 11: 1670-1676.
- Nguyen N, Mitra J (2018) Reliability of power system with high wind penetration under frequency stability constraint. IEEE Trans Power Sys 33: 985-994.
- Sun K (2005) Complex networks theory: A new method of research in power grid [C] Transmission and Distribution Conference and Exhibition: Asia and Pacific, IEEE/PES. IEEE 1-6.
- Liu B, Li Z, Chen X (2018) Recognition and vulnerability analysis of key nodes in power grid based on complex network centrality. IEEE Trans Circuits SysII 65: 346-350.
- Zhang X, Zhan C, Chi KT (2017) Modeling the dynamics of cascading failures in power systems. IEEE J Emerg Select Topics Circuits Sys 7: 192-204.
- Lennerhag O, Bollen MHJ (2018) Power system impacts of decreasing resonance frequencies [C] Harmonics and Quality of Power (ICHQP), 18th International Conference on IEEE 2018: 1-6.
- Cadini F, Agliardi GL, Zio E (2017) Estimation of rare event probabilities in power transmission networks subject to cascading failures. Reliab Engi Sys Safe 158: 9-20.
- Newman MEJ (2002) Spread of epidemic disease on networks. Physical Rev 66: 016128.
- Duncan JW, Steven HS (1998) Collective dynamics of small-world networks. Nature 393: 440-442.
- KONECT (2017) US power grid. KONECT.

Open Access Journals
- Aquaculture & Veterinary Science
- Chemistry & Chemical Sciences
- Clinical Sciences
- Engineering
- General Science
- Genetics & Molecular Biology
- Health Care & Nursing
- Immunology & Microbiology
- Materials Science
- Mathematics & Physics
- Medical Sciences
- Neurology & Psychiatry
- Oncology & Cancer Science
- Pharmaceutical Sciences


