The analysis of caesarean section rate based on 10 groups robson classification at university hospital of obstetrics- gynecology “koco Gliozheni”
Lorena Zijaj1*, Jola Kerpaci1, Irida Dajti1, Arian Shtylla2
1Department of Obstetric Gynecology, Faculty of Medicine, University of Medicine, Tirana
2Department of Obstetric Gynecologist Doctor at University Hospital of obstetric Gynecology “Koco Gliozheni”, Tirana
- *Corresponding Author:
- Zijaj L, Department of Obstetric Gynecology, Faculty of Medicine, University of Medicine, Tirana,
Tel: 0697356290;
E-mail:zijaj.lorena@yahoo.com
Received Date: May 20, 2020; Accepted Date: September 2, 2021; Published Date: September 15, 2021
Citation: Zijaj L (2020) The analysis of caesarean section rate based on 10 groups robson classification at university hospital of obstetricsgynecology “koco Gliozheni”. Insights Reprod Med Vol: 4 No: 2
Abstract
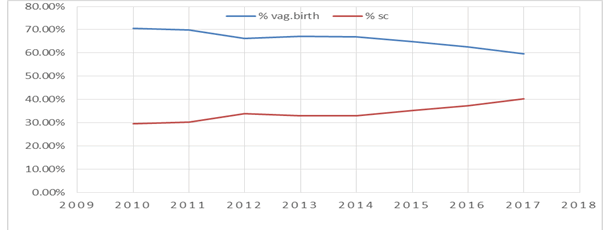
Caesarean Section use is growing in a progressive rate globally, accounting for 21% worldwide in 2012 up from 12% in 2000.The trend in Albania follow the same pattern with the overall rate rising steadily. Specifically ,in “Koco Gliozheni” Hospital the rate went up from 29.5% in 2010 to 40.35% in 2017. The World Health Organization recommends the Robson Classification as an effective caesarean analysis and monitoring too.
Keywords
Caesarean Section Rate, Vaginal Birth, Robson Classification
Introduction
Caesarean Section use is growing at a progressive rate globally ,accounting for 21% births worldwide in 2015 from 12% in 2000. (1). According to recommendation for proper prenatal and births care, from a Joint Conference an Appropriate Technology for Birth, organized by World Health Organization in 1985 ,there is no justification in any specific geographic region to have more than 10-15 % Caesarean Section births (2). This rising rate is a crucial public health problem, thus causing debatable questions due to the potential risks both maternal and perinatal. Additionally cost issues and accessibility have promptly become concern. Statistically across the US overall SC rate was 32% in 2017 (3) compared to approximately 20% in 1996, in UK SC deliveries have increased 19.7% of birth in 2000 to 26.2% in 2015 (4). According to Lancet in at least 15 countries the SC rate exceeds 40%, including Brazil, 55.5%,Turkey 53.1% (5) and Egypt (6). Kosovo , a country with the same ethical traits as Albanian is experiencing a swift growth in SC rate .From 2000 to 2015 the figures has increased from 7.5% to 27.3% .The trend in Albania follows the same pattern with the overall rate rising steadily. Specifically in “Koco Gliozheni” Hospital the rate went up from 29.5% in 2010 to 40.35% in 2017 as (Figure 1) .In order to understand the drivers this trend, different authors have created and proposed a consistent and standardized classification known as Robson Classification. Many countries use this randomly in their study ,whist other like Albania have not implanted yet .According to WHO the Robson’s Classification is for “all women” who delivered at a specific setting and not only for the women who delivered by Caesarean
Objectives
To describe The main objective this paper is to report on an analysis of the CS rate in our hospital : “Koco Gliozheni” using the 10 group Robson Classification and to determine trends on time period from 2016-2017 .
Materials and method
This is a retrospective cross –sectional study at the obstetric department of the University Hospital of Obstetric and Gynecology “Koco Gliozheni|” from January 2016 to May 2017.The “Koco Gliozheni” Hospital is a tertiary University hospital supported by 24 hours obstetrics team, pediatric services, anaesthetic and neonatal department. This study includes all women who gave births to alive or still born baby of at least 28 weeks gestational age during the above mentioned time period. The obtain data were maternal age ,parity ,gestational ageonset of labor ,foetus presentation ,previous deliveries and previous CS. The data were categorized into 10 groups according to the Robson Classification System (table 1). Those variables needed to be analysed for our study were parity, gestational age, foetal presentation, and previous caesarean section. Statistical analysis and graphics presentation were performed using EXEL 2010 and Microsoft office programs. All missing data cases were exluded from the study.
Results
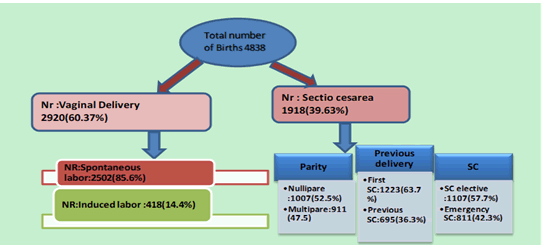
During our study period from January 2016 to May 2017,4838 women gave birth at University Hospital of Obstetrics- Gynecology “Koco Gliozheni”,Tirana. There were 2388 nulliparous(49.38%) and 2450 multiparous (50.65%). CS was performed in1918 women resulting in an overall CS rate of (39.63%). The number of CS performed to all nulliparous and multiparous during this period of time was 1005(52.5%) and 911(47.5%) respectively .The rate of elective CS was 57.7% while that emergency CS was 42.3%, (Figure .2).We attempted to categorize CS according to Robson Classification and rates of each group were demonstrated separately (Table.2).The largest contributors to the overall CS rate were women with previous CS(group 5) 12.45%. CS rate within this group was 90.6%(602 out of 664 women ). 456 out of 664 women (68.67%), had performed a CS prior to the onset labor (elective CS ).148 (31.33%) of women of this group ,had attempted a VBAC. A significant number of these multiparous,with at least one previous vaginal birth. The second highest contributors were women included in group 1 (singletons nulliparous,cephalic presentation ,at term spontaneous onset of labor ),with an overall CS rate 8.9% and with relative percentage of 22.5%. The group 2 nulliparous with single cephalic ,full term pregnancy ,with included labor or pre labor CS) had the third contribution with 6.6% of overall CS rate and a relative contribution of only 16.7%.
| 1 Nulliparous; single cephalic term pregnancy; spontaneous Labour |
|---|
| 2a Nulliparous; single cephalic term pregnancy; induced labour |
| 2b Nulliparous; single cephalic term pregnancy; planned caesarean delivery |
| 3 Multiparous without uterine scar; single cephalic term pregnancy; spontaneous labour |
| 4a Multiparous without uterine scar; single cephalic term |
| pregnancy; induced labour |
| 4b Multiparous without uterine scar; single cephalic term |
| 5 Multiparous with scarred uterus; Single cephalic term pregnancy |
| 6 Nulliparous; single breech pregnancy |
| 7 Multiparous; single breech pregnancy (including women with scarred uterus) |
| 8 All women with multiple pregnancy (including women with scarred uterus) |
| 9 All women with a single oblique or transverse pregnancy (including women with scarred uterus) |
| 10 All women with single cephalic preterm pregnancy (including women with scarred uterus) |
Table1: The ten group Robson's Classification.
Discussion
Our study reports the data from low income countries like Albania .During the study from January 2016 to May 2017, gave birth 4828 women ,1918(39.63%) out of 4839 performed CS, The rate is higher than developed.
| Group nr | Total nr of women delivered in each group(N) | Total nr of SC in each group(n) | Group size (%) | Group CSR(%) | Absolute group contribution to overall SC rate(%) | Relative contribution of the group to overall SCR (1978 SC)% |
|---|---|---|---|---|---|---|
| 1 | 1507 | 432 | 30.3 | 28.6 | 8.9 | 22.5 |
| 2 | 550 | 321 | 11 | 58.3 | 6.6 | 16.7 |
| 3 | 1309 | 86 | 27 | 6.5 | 1.8 | 4.5 |
| 4 | 227 | 57 | 4.6 | 25 | 1.2 | 2.9 |
| 5 | 664 | 602 | 13.7 | 90.6 | 12.45 | 31.6 |
| 6 | 135 | 128 | 2.7 | 94.8 | 2.6 | 6.7 |
| 7 | 79 | 66 | 1.6 | 83.5 | 1.4 | 3.4 |
| 8 | 90 | 78 | 1.8 | 86.6 | 1.6 | 4 |
| 9 | 23 | 23 | 0.47 | 100 | 0.48 | 1.2 |
| 10 | 254 | 125 | 5.2 | 49.2 | 2.6 | 6.5 |
| Total Number | 4838 | 1918 | 100% | 39.63% | 39.63% | 100% |
Table 2: Robson report table for University Hospital Center Obsteric-Gyneocology "Koco Gliozheni”.
• Group size (%)=n of women in the group.total number N women delivered in the hospital*100
• Group CS rate (%)=n of CS in the group/total N of women in group*100
• Absolute contribution (%)=n of CS in group /total N of women delvered in hospital*100
• Relative contribution (%)=n of CS in group/total N of CS in hospital*100
• CS(Caesaren Section )
• Colour signifies the high risk group
countries like France (31%,Australia (28%),USA (31.1%) and lower than Iran (40%), Egypt (54%),Turkey (51.9%), South America (42,9%). The main contributor to the overall CS rate were groups 5,1,2. Group 5: countries like France (31%), Australia (28%), USA (31.1%) and lower than Iran (40%), Egypt(54%) ,Turkey (51.9%), South America (42,9%). The main contributor to the overall CS rate were group 5,1,2. Group 5: (multiparous with prior caesarean section ,singleton ,>37 weeks ): provides the highest contribution with 31.6% of all CS and with 90.6% CS rate of women in this group much high than Robson’s references (50-60%). On further analysis we conclude that 68.67% of women in this group had an elective CS and only 31.33% of women had attempted trail of labor after CS (TOLAC), even thought VABC had a success of 75% (9) .In some studies in low income countries success of VBAC is as low as 27.4% to 53.6% (10). But on the other hand ,countries with high socioeconomic status(France ,Netherland), reported a higher of CS from group 5 respectively 61% and 47% (11).Some factors that contribute to the decreasing of percentage of VBAC are myth about CS “Once a caesarean always a caesarean”, lack of training and malpractice. Uterine rupture is a possible complication during vaginal birth with a scarring uterus but studies calculate the risk from 0.2% to 0.8% (12). Group 1 : (CS performed during labor) contributes with approximately 22.5% of CSR, and 28.6% within the group. Referring to Robson’s finding ,this group should account for no more than 10% (13).
The high rate of CS in our Hospital can explained by the lack of infrastructure. For instance the well-being of foetus during labor has been monitored by intermittent CTG and sometimes only with feotal stethoscope.
Furthermore reasons like insufficient training of staff for CTG interpretation, lack of other foetal assessment such as foetal scalp blood sampling and cord blood PH play a crucial role .Given that, the doctor have to make a decision based only in CTG findings. There are findings similar to low incomes or developing countries as Egypt and Bosnia Herzegovina. Additionally epidural or any other anaesthesia in not a routine in our every day practice .The instrumental deliveries have reached at a critical low point, not only in “Koco Gliozheni” Hospital, but globally. Group 2: (Nulliparous women cephalic at term induced labor or elective CS) has the third high contribution, with 16.7% of overall CSR and 58.3% within the group. Robson’s rate references for this group is 20-35%. After a thorough analysis , we conclude that different from references ,the subgroup 2a (induced labor ) is relatively smaller than 2b (elective CS) .This can be explained by underreported induction of labor on patient’s files. The elective section ,is mostly performed for nonmedically indications, also known medical request, due to anxiety fear of pain ,and concern of pelvic injury. Group 3-4 (multiparous women at term induced or elective CS) have a relatively low contribution, which reaches all together 7.4%. They are labelled the “low risk group”. Groups 6 -10 were smaller groups with an overall size of 11.77%, and with the highest group CSR that reach up to 100% in group 9 (all women with single pregnancy with transverse or oblique lie, including women with previous uterine scar ).This group are presented with an unavoidable obstetric condition(like breech presentation, multiple pregnancy abnormal fetal presentation or premature birth, several maternal obstetrical conditions) that has been served as medical indication for CS. But on the other hand the contribution to the overall SCR is lower and reaches only 32%. This is similar to the results of other studies of Balkan countries (14).
Conclusions
In our study , Robson’s groups 5.1.2 were identified as the main contributors to the overall Cesarean Section rate at the “Koco Gliozheni” University Hospital, Tirana. It is important to make effort to reduce the overall CSR ( reducing CS in group 1 and 2 ) and increasing the attempt of vaginal birth after cesarean section .We believe that this classification can be incorporated successfully in the routine of obstetrical management ,and implemented in the collection of maternal and perinatal data system to improve the evaluation of Caesarean Section rate .
References
- ACOG. "Vaginal birth after cesarean delivery ." ACOG PRACTICE BULLETIN, 2010: 116.
- Agrawal, Chowdhary,Stivastava,Pnadey. "Evalutation of pregnant women with scarred uterus in a low resourse contries." Journal of Obsteric Gynaecology Research, 2007: 651.
- Bazelian, Althabete,Cafferaa. "Health consequences of the increasing caesarean rates." Epidemiology, 2007: 485.
- Boerma, T, C Ronsmans , and D Melesse. "Global epidemiology of use and disparieties in caesarean sections." Lancet, 2018: 392.
- Chinnock. "Obsteric trainee's experience in vaginal birth delivery." Obstet Gynecol, 2007: 110. Cunningham, Kenneth,Bloom,. " Williams Obsterics." In Cesarean delivery and peripartum
- hysterectomy, by Williams, 591. USA, 2018.
- Jadoon. "Analysis of Cesarean Section based on Robson group's classification at Behna University Hospital ." Woman Birth, 2019: 328.
- Jasenko, Igor,Zlatan,Zildic. "Cestio Casarean rate Analysis in Universiy hospital Tuzla -according to Robson's classification." 2016.
- Robson. "Classification of caesarean section." Medicine Review, 2001: 39.
Open Access Journals
- Aquaculture & Veterinary Science
- Chemistry & Chemical Sciences
- Clinical Sciences
- Engineering
- General Science
- Genetics & Molecular Biology
- Health Care & Nursing
- Immunology & Microbiology
- Materials Science
- Mathematics & Physics
- Medical Sciences
- Neurology & Psychiatry
- Oncology & Cancer Science
- Pharmaceutical Sciences


