ISSN : 0976-8505
Der Chemica Sinica
Synthesis and Electrochemical Properties of a New Molybdenum (VI) Complex with Schiff Base Ligand
Yan Liu, Dan Xue and Shu-Zhong Zhan*
College of Chemistry and Chemical Engineering, South China University of Technology, Tianhe Qu, Guangzhou Shi 510640, Guangdong Sheng, China
Abstract
The reaction of 2-pyridylamino-N,N-bis(2-methylene-4,6-bitert-butylphenol) (H2L’) and MoCl5 gives a molybdenum (VI) complex [MoL’(O)2] 1, which has been characterized by single-crystal X-ray diffraction, IR and NMR analysis. Electrochemical studies show that 1 can electrocatalyze hydrogen evolution, both from acetic acid with a turnover frequency (TOF) of 36.4 moles of hydrogen per mole of pre-catalyst per hour at an overpotential of 441.6 mV (in DMF), and from buffer (pH 7.0) with a TOF of 373.1 moles of hydrogen per mole of catalyst per hour at an overpotential of 787.6 mV.
Keywords
Molybdenum (VI) complex, X-ray molecular structure, Molecular electrocatalysts, Hydrogen evolution
Introduction
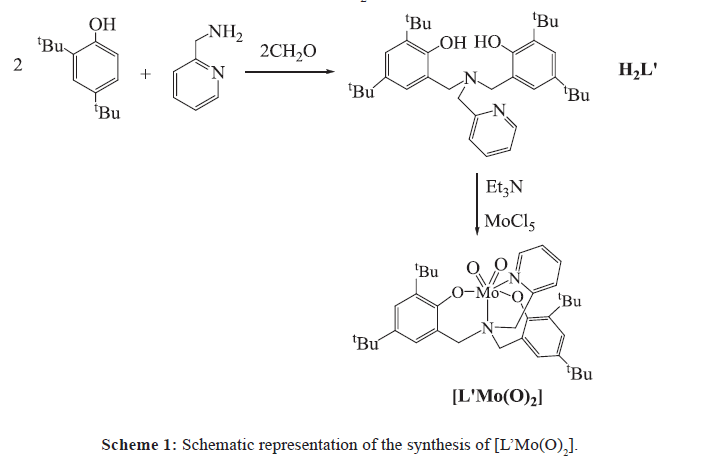
Hydrogen is one of the most ideal energy in the future, because of its potential to reduce the current dependence on fossil fuels [1]. Effective proton reduction to form H2 has been a subject of intense study and significant effort has been made to design metal complexes for proton reduction [2,3]. In Nature, hydrogenase enzymes [4,5] can efficiently catalyze both the production and oxidation of hydrogen using earth-abundant metals (nickel and iron). However, enzymes are difficult to adapt for commercial applications and their stability is often limited outside of their native environment [6,7]. Electrolysis of water is the simplest way to produce hydrogen. To increase the reaction rate and lower the overpotential, it is necessary to use an efficient hydrogen evolution reaction (HER) electrocatalyst. Many research groups, including ours, have focused on the development of molecular catalysts employing the more abundant metals, and several complexes that contain nickel [8,9], cobalt [10-12], copper [13,14] and molybdenum have been developed as electrocatalysts for the reduction of water to form H2 [15-18]. A report from Chang and co-workers described a highly active molecular molybdenum(IV) electrocatalyst, [(Py5Me2)MoIVO]2+ (Py5Me2=2,6- bis(1,1-bis(2-pyridyl)ethyl)pyridine, a neutral pentadentate ligand) that reduces water to H2 at neutral pH in aqueous buffer, reporting a maximum of 1,600 moles of H2 per mole of catalyst per hour at an overpotential of 642 mV [15]. To investigate the roles of the oxidation/reduction site in molybdenum complexes, determining of their redox potentials and characterization of their electronic structures, we focus our work in the design and catalytic properties of molybdenum (VI) complexes. We have previously shown that the molybdenum (VI) complexes supported by 2-pyridylamino-N,N-bis-phenol (Figure 1) also can be molecular electrocatalysts for hydrogen evolution [16-18]. It has been shown that the donor type and electronic properties of the ligands play vital roles in determining the structure and reactivity of the corresponding metal complexes. With this mind, we chose 2-pyridylamino-N,Nbis( 2-methylene-4,6-bitert-butylphenol) (H2L’), a potential deprotonated ligand to react with MoCl5 to assembly the corresponding molybdenum compound and study its electrocatalytic function. Here we present the synthesis, structure, characterization and properties of a new molybdenum (VI) electrocatalyst, [MoL’(O2)] 1, as well as the effect of tetradentate ligand modifications on the catalytic properties of molybdenum (VI) complexes.
Materials and Methods
Physical measurements
1H NMR spectra were measured on a Bruker AM 500 spectrometer in CDCl3. Infrared spectra were obtained with a Bruker FTIR 1730 infrared spectrometer. Cyclic voltammograms were obtained on a CHI-660E electrochemical analyzer under oxygen-free conditions using a three-electrode cell in which a glassy carbon electrode, 1 mm in diameter) was the working electrode, a saturated Ag/AgNO3 or Ag/AgCl electrode was the reference electrode, and a platinum wire was the auxiliary electrode. In organic media, the ferrocene/ferrocenium (1+) couple was used as internal standard and 0.10 M [(n-Bu)4N]ClO4 was used as the supporting electrolyte. Controlled-potential electrolysis (CPE) in DMF was conducted using an air-tight glass double compartment cell separated by a glass frit. The working compartment was fitted with a glassy carbon plate and an Ag/AgNO3 reference electrode. The auxiliary compartment was fitted with a Pt gauze electrode. The working compartment was filled with 50 mL of 0.4 mM acetic acid in a 0.10 M [(n-Bu4N)]ClO4 DMF solution, while the auxiliary compartment was filled with 35 mL of 0.10 M [(n-Bu4N)] ClO4 DMF solution, resulting in equal solution levels in both compartments. Both compartments were sparged for 60 min with N2 and cyclic voltammograms were recorded as controls. CPE in aqueous media was also conducted using an air tight glass double compartment cell separated by a glass frit. The working compartment was fitted with a glassy carbon plate and an Ag/AgCl reference electrode. The auxiliary compartment was fitted with a Pt gauze electrode. The working compartment was filled with 50 mL of 0.25 M phosphate buffer solution, while the auxiliary compartment was filled with 35 mL phosphate buffer. Both compartments were sparged for 60 min with N2 and cyclic voltammograms were recorded as controls. After addition of complex 1, cyclic voltammograms were recorded. After electrolysis, a 0.5 mL aliquot of the headspace was removed and replaced with 0.5 mL of CH4. The headspace sample was injected into the gas chromatograph (GC). GC experiments were carried out with an Agilent Technologies 7890A gas chromatography instrument (Column: 19091J-413, No. USC184265H; Detector: TCD; Injection volume: 1 mL).
Syntheis of 2-pyridylamino-N,N-bis(2-methylene-4,6-bitert-butylphenol), H2[O2NN]BuEtPy (H2L’)
A solution of 2,4-bibutylphenol (30.95 g, 0.123 mol), aminomethylpyridine (8.11 g, 0.061 mol), and 37% aqueous formaldehyde (9.17 mL, 0.123 mol) in water (50 mL) was stirred and refluxed for 8 h. Upon cooling, a large quantity of beige solid formed. The solvents were decanted, and the remaining solid residue was washed with cold methanol to give a pure, white powder (29.60 g, 93.4% yield). Crystalline product was obtained by slow cooling of a hot diethyl ether solution. Anal. calcd for C32H44N2O2: C, 78.58; H, 9.00; N, 5.73%. Found C, 78.33; H, 8.88; N, 5.81%. 1H NMR {400 MHz, CDCl3} δ 10.55 (2H), 8.73 (1H), 7.72 (1H), 7.30 (2H), 7.26 (1H), 7.16 (1H), 6.96 (2H), 3.86 (6H), 1.43 (18H), 1.32 (18H).
Synthesis of complex 1
To a solution, containing H2L’ (0.516 g, 1 mmol) and triethylamine (0.10 g, 1 mmol) in methanol (20 ml), MoCl5 (0.273 g, 1 mmol) was added and the mixture was stirred for 15 min. Single crystals were obtained from the filtrate which was allowed to stand at room temperature for several days, collected by filtration, and dried in vacuo (65%). The elemental analysis results (Found C, 62.67; H, 6.67; N, 4.71. C32H42N2O4Mo requires C, 62.31; H, 6.87; N, 4.54) were in agreement with the formula of the sample used for X-ray analysis. 1H NMR {400 MHz, CDCl3} δ 9.12 (1H), 7.49 (1H), 7.12 (3H), 6.92 (2H), 6.73 (1H), 4.99 (2H), 3.96 (2H), 3.74 (2H), 1.26 (36H). IR (cm-1): 931 and 905 (νMo=O).
Crystal structure determination
The X-ray analysis of 1 was carried out with a Bruker SMART CCD area detector using graphite monochromated Mo-Kα radiation (λ=0.71073 Å) at room temperature. All empirical absorption corrections were applied using the SADABS program [19]. The structure was solved using direct methods and the corresponding non hydrogen atoms were refined anisotropically. All the hydrogen atoms of the ligands were placed in calculated positions with fixed isotropic thermal parameters and included in the structure factor calculations in the final stage of full-matrix leastsquares refinement. All calculations were performed using the SHELXTL computer program [20]. CCDC 1032589 contains the supplementary crystallographic data for this paper. The data can be obtained free of charge from The Cambridge Crystallographic Data Centre [21]. Crystallographic data for complex 1 are given in Table S1 and selected bond lengths are listed in Table S2.
Results and Discussion
In the presence of Et3N, the reaction of H2L’ (Figure S1) with MoCl5 affords the molybdenum (VI), [MoL’(O2)] 1 in 65% yield (Scheme 1), which is in agreement with the result of NMR analysis (Figure S2). The IR spectrum of complex 1 displays two strong νMo=O bands at 931 cm-1 and 905 cm-1 (Figure S3), characteristic for symmetric and asymmetric vibrational modes, respectively, of the cis-[MoO2]2+ fragment [22,23].
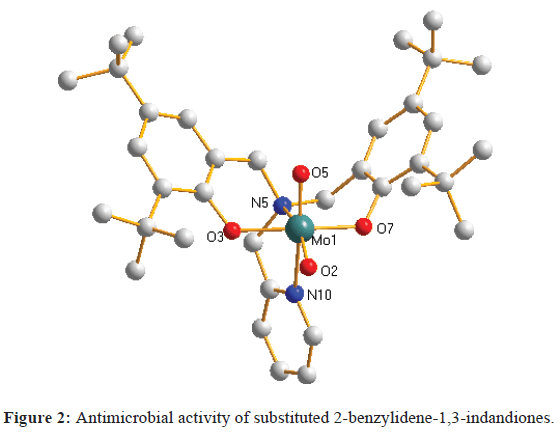
Complex 1 crystallizes in space group P-1, with one unit present per unit cell. As shown in Figure 2, the X-ray structure of complex 1 reveals a six-coordinate Mo atom in a distorted octahedral coordination geometry, with fac coordination of the ligand. The molybdenum oxo groups show the expected mutual cis configuration. The Mo=O bond lengths [Mo1-O2, 1.697(3) Å; Mo1-O5, 1.705(4) Å] are in the expected range for cis-dioxo MoVI complexes [16-18,24,25]. The Mo–O bond lengths [1.952(3) Å and 1.960(3) Å] are shorter than those observed in other Mo (VI) complexes [26,27]. The Mo–N bond lengths fall in the range of 2.369(4) Å to 2.372(4) Å, and are comparable to those observed in a similar Mo (VI) complex [26].
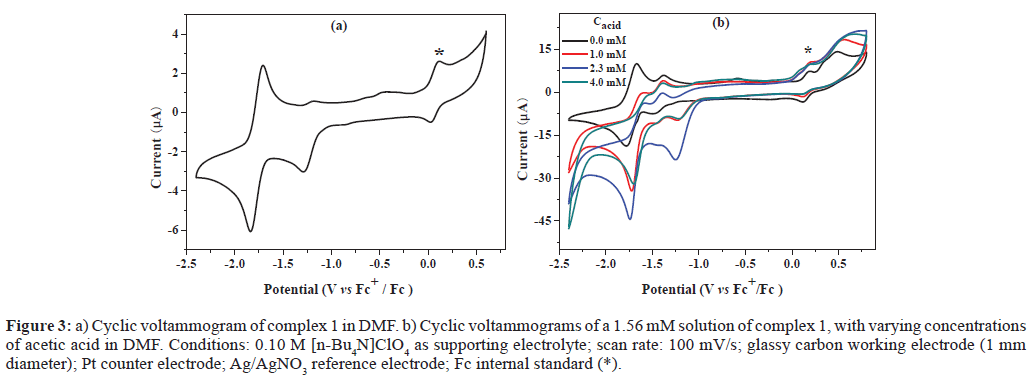
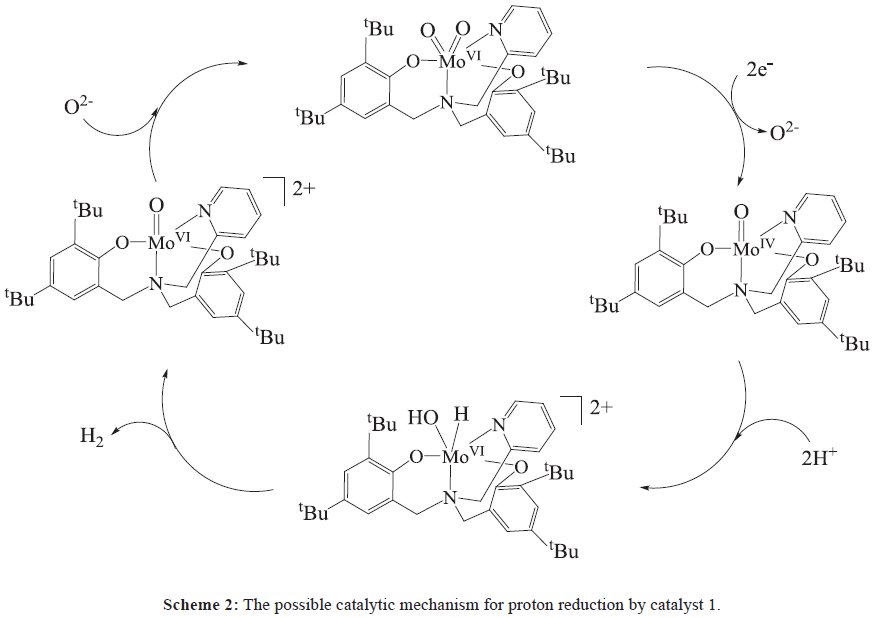
In Figure 3a, the cyclic voltammogram of complex 1 shows one quasi-reversible redox couple at -1.23 V and one reversible couple at -1.77 V versus Fc+/Fc, which can be assigned to the couples of MoVI/V [28] and MoV/IV, respectively. As observed in Figure S4, the current response of the redox event at -1.84 V shows linear dependence on the square root of the scan rate, indicative of a diffusion controlled process, with the electrochemically active species freely diffusing in the solution. To determine the possible electrocatalytic activity of complex 1, cyclic voltammograms were recorded in the presence of acetic acid. Figure 3b shows a systematic increase in icat observed near -1.84 V with increasing acid concentration from 0.0 mM to 4.0 mM. This rise in current can be attributed to the catalytic generation of H2 from acetic acid [15], with the catalytic onset shifted to more positive potentials (from -1.24 V to -0.95 V). Based on the above observations, we postulate the catalytic cycle depicted in Scheme 2 for the generation of hydrogen from acetic acid mediated by complex 1. Two-electron reduction of [MoVIL’(O)2] gives [MoIVL’(O)] and releases one O2- ion. Addition of proton produces the reactive intermediate [MVIL’(OH)(H)]. Then affords H2 and gives rise to a cycle in which [MoVIL’(O)] precedes the formation of [MoVIL’(O)2]1. More detailed mechanistic studies are under investigation.
Figure 3: a) Cyclic voltammogram of complex 1 in DMF. b) Cyclic voltammograms of a 1.56 mM solution of complex 1, with varying concentrations of acetic acid in DMF. Conditions: 0.10 M [n-Bu4N]ClO4 as supporting electrolyte; scan rate: 100 mV/s; glassy carbon working electrode (1 mm diameter); Pt counter electrode; Ag/AgNO3 reference electrode; Fc internal standard (*).
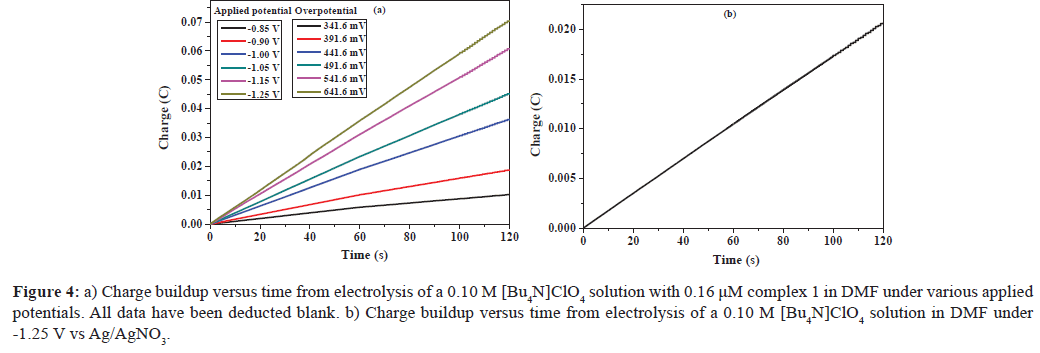
Further evidence for the electrocatalytic activity of complex 1 was obtained by bulk electrolysis of a DMF solution of the complex (0.16 μM) with acetic acid (4.0 mM) at variable applied potential using a glassy carbon plate electrode in a double compartment cell. Figure 4a exhibits the total charge for bulk electrolysis of complex 1 in the presence of acid. When the applied potential was -1.25 V versus Ag/AgNO3, the maximum charge reached 71 mC during 2 min of electrolysis, accompanying evolution of a gas, which was confirmed as H2 by gas chromatography. According to Figure S5, ∼31.5 μL of H2 was produced over an electrolysis period of 1 h. The CPE experiment under the same potential with a catalyst-free solution only gave a charge of 20 mC (Figure 4b), showing that this complex does indeed serve as an effective hydrogen production catalyst under such conditions. Assuming every catalyst molecule was distributed only on the electrode surface and every electron was used for the reduction of protons, according to Eq. 1 and 2 [17,29], we calculated the TOF for the catalyst as reaching a maximum of 36.4 moles of hydrogen per mole of catalyst per hour at an overpotential of 441.6 mV (Eq. S1 and Figure S6), which is similar to that of [LMoVI(O)2] (L=2-pyridylamino-N,N-bis(2-methylene-4-methoxy-6-tert-butylphenol) ion) (39 moles of hydrogen per mole of catalyst per hour at an overpotential of 441.6 mV), a similar type of complex [18], and is much lower than that of [LMoVI(O)2] (L=2-pyridylamino-N,N-bis(2-methylene-4,6-difluorophenol) ion) (50.6 moles of hydrogen per mole of catalyst per hour at an overpotential of 441.6 mV) [17]. The result is consistent with an evident increase in the catalytic activity when electron-withdrawing groups are present at the phenol para-position of the ligand, and 2-pyridylamino- N,N-bis(2-methylene-4,6-difluorophenol) constitutes the better active catalyst [30].
Figure 4: a) Charge buildup versus time from electrolysis of a 0.10 M [Bu4N]ClO4 solution with 0.16 μM complex 1 in DMF under various applied potentials. All data have been deducted blank. b) Charge buildup versus time from electrolysis of a 0.10 M [Bu4N]ClO4 solution in DMF under -1.25 V vs Ag/AgNO3.
TOF=ΔC/(F × n1 × n2 × t) (1)
Overpotential=Applied potential-E⨀HA=Applied potential-(E⨀H+-(2.303RT/F)pKaHA) (2)
where ΔC is the charge from the catalyst solution during CPE minus the charge from the solution without catalyst during CPE, F is Faraday's constant, n1 is the moles of electrons required to generate one mol of H2, n2 is the moles of catalyst in solution, and t is the duration of electrolysis.
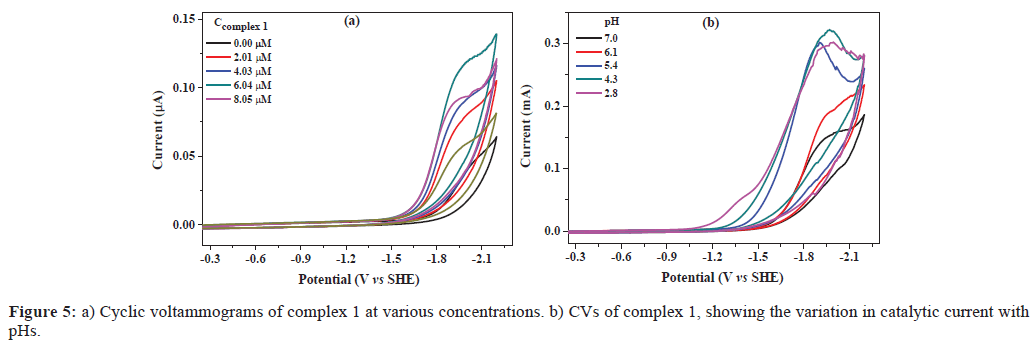
To explore the catalytic hydrogen evolution in aqueous media, CVs were conducted in 0.25 M phosphate buffers at different pH values. As shown in Figure 5a, in the absence of complex 1, the catalytic current was not apparent until a potential of -1.55 V versus SHE was attained. With addition of complex 1, the onset of catalytic current was observed at about -1.30 V versus SHE, and the current strength increased significantly with increasing concentrations of complex 1 from 0.00 μM to 8.05 μM. Furthermore, it was found that the catalytic onset was also dependent on pH value of buffer (Figure 5b).
Catalytic hydrogen production can also be achieved with complex 1 in buffer, Figure 6a shows the total charge of bulk electrolysis of the solution containing 0.08 μM complex 1 at pH 7.0. When the applied potential was -1.40 V versus Ag/AgCl, the maximum charge was only 29 mC during 2 min of electrolysis in absence of complex 1 (Figure 6b). Under the same conditions, the charge reached 192 mC with addition of complex 1 (0.08 μM), accompanying gas bubble appeared. The evolved H2 was analyzed by gas chromatography, Figure S7, which gave ∼0.37 mL of H2 over an electrolysis period of 1 h with a Faradaic efficiency of 93% for H2 (Figure S8). The CPE under the same conditions without complex 1 only gave ∼0.12 mL of H2 over an electrolysis period of 1 h (Figure S9), showing that this complex does indeed can catalyze hydrogen evolution. According to Eq. 1 and 3 [11,15], we calculated the TOF for the catalyst as reaching a maximum of 373.1 moles of hydrogen per mole of catalyst per hour at an overpotential of 787.6 mV (Eq. S2 and Figure S10), where
Overpotential=Applied potential-E(pH)=Applied potential-(-0.059 pH) (3)
This value is much lower than that of [(Py5Me2)MoIVO]2+ [15], indicating that the molybdenum(IV) electrocatalyst is more active than the molybdenum (VI) species.
Conclusion
In summary, we have successfully prepared a new molybdenum (VI) complex 1, which can generate dihydrogen from acetic acid or water. Our ongoing efforts are focused on modifying the Schiff base ligands to give related water-soluble complexes for further functional studies, with an emphasis on chemistry relevant to sustainable energy cycles.
Acknowledgements
This work was supported by the National Science Foundation of China (No. 20971045, 21271073).
References
- Lewis NS, Nocera DG (2006) Powering the planet: chemical challenges in solar energy utilization. Proc Nat Acad Sci 103: 15729-15735.
- McKone JR, Marinescu SC, Brunschwig BS, Winkler JR, Gray HB (2014) Earth-abundant hydrogen evolution electrocatalysts. Chem Sci 5: 865-878.
- Vincent KA, Parkin A, Armstrong FA (2007) Investigating and exploiting the electrocatalytic properties of hydrogenases. Chem Rev 107: 4366-4413.
- Fontecilla-Camps JC, Volbeda A, Cavazza C, Nicolet Y (2007) Structure/function relationships of [NiFe]- and [FeFe]- hydrogenases. Chem Rev 107: 4273-4303.
- Vignais PM, Billoud B (2007) Occurrence, classification, and biological function of hydrogenases: an overview. Chem Rev 107: 4206-4272.
- Pickett CJ, Tard C (2009) Structural and functional analogues of the active sites of the [Fe]-, [NiFe]-, and [FeFe]-hydrogenases. Chem Rev 109: 2245-2274.
- Darensbourg MY, Wegand W (2011) Sulf-oxygenation of Active Site Models of [NiFe]- and [FeFe]-Hydrogenases; Commentary on Chemical Models of Hydrogenase Enzyme Oxygen Sensitivity Possibilities. Eur J Inorg Chem 2011: 994- 1004.
- Fisher BJ, Eisenberg R (1980) Electrocatalytic reduction of carbon dioxide by using macrocycles of nickel and cobalt. J Am Chem Soc 102: 7361-7363.
- Helm ML, Stewart MP, Bullock RM, DuBois MR, DuBois DL (2011) A synthetic nickel electrocatalyst with a turnover frequency above 100,000 s⻹ for H₂ production. Science 333: 863-866.
- Singh WM, Baine T, Kudo S, Tian S, Ma XAN, et al. (2012) Electrocatalytic and Photocatalytic Hydrogen Production in Aqueous Solution by a Molecular Cobalt Complex. Angew Chem Int Ed 51: 5941-5944.
- Sun Y, Bigi JP, Piro NA, Tang ML, Long JR, et al. (2011) Molecular cobalt pentapyridine catalysts for generating hydrogen from water. J Am Chem Soc 133: 9212-9215.
- Stubbert BD, Peters JC, Gray HB (2011) Rapid water reduction to H2 catalyzed by a cobalt bis(iminopyridine) complex. J Am Chem Soc 133: 18070-18073.
- Zhang P, Wang M, Yang Y, Yao T, Sun L (2014) A Molecular Copper Catalyst for Electrochemical Water Reduction with a Large Hydrogen-Generation Rate Constant in Aqueous Solution. Angew Chem Int Ed 53: 13803-13807.
- Zhou LL, Fang T, Cao JP, Zhu ZH, Su XT, et al. (2015) A dinuclear copper(II) electrocatalyst both water reduction and oxidation. J Power Sources 273: 298-304.
- Karunadasa HI, Chang CJ, Long JR (2010) A molecular molybdenum-oxo catalyst for generating hydrogen from water. Nature 464: 1329-1333.
- Cao JP, Fang T, Zhou LL, Fu LZ, Zhan SZ (2014) A molecular molybdenum–schiff base electro-catalyst for generating hydrogen from acetic acid or water. Electrochim Acta 147: 129-135.
- Cao JP, Zhou LL, Fu LZ, Zhan SZ (2014) First mononuclear copper(II) electro-catalyst for catalyzing hydrogen evolution from acetic acid and water. J Power Sources 39: 13972-13978.
- Cao JP, Zhou LL, Fu LZ, Zhao JX, Lu HX, et al. (2014) A molybdenum–schiff base complex, a new molecular electro-catalyst for generating hydrogen from acetic acid or water. Cata Commun 57: 1-4.
- Sheldrick GM (1996) Program for Empirical Absorption Correction of Area Detector Data. SADABS, University of Göttingen, Göttingen, Germany.
- Sheldrick GM (1997) Program for Crystal Structure Refinement. SHELXS 97, University of Göttingen, Göttingen, Germany.
- https://www.ccdc.cam.ac.uk/data_request/cif
- Schultz BE, Gheller SF, Muetterties MC, Scott MJ, Holm RH (1993) Molybdenum-Mediated Oxygen Atom Transfer: An Improved Analogue Reaction System of the Molybdenum Oxotransferases. J Am Chem Soc 115: 2714-2722.
- Thomson LM, Hall MB (2001) A theoretical study of the primary oxo transfer reaction of a dioxo molybdenum(VI) compound with imine thiolate chelating ligands: a molybdenum oxotransferase analogue. J Am Chem Soc 123: 3995-4002.
- Lyashenko G, Herbst-Irmer R, Jancik V, Pal A, Mosch-Zanetti NC (2008) Molybdenum oxo and imido complexes of beta-diketiminate ligands: synthesis and structural aspects. Inorg Chem 47: 113-120.
- Tran BL, Carrano CJ (2007) Oxo-molybdenum (VI,V,IV) complexes of the facially coordinating tris(mercaptoimidazolyl) borate ligand: synthesis, characterization, and oxygen atom transfer reactivity. Inorg Chem 46: 5429-5438.
- Basu P, Nemykin VN, Sengar RS (2009) Substituent effect on oxygen atom transfer reactivity from oxomolybdenum centers: synthesis, structure, electrochemistry, and mechanism. Inorg Chem 48: 6303-6313.
- Bagherzadeh M, Haghdoost MM, Ghanbarpour A, Amini M, Khavasi HR, et al. (2014) New molybdenum (VI) catalyst for the epoxidation of alkenes and oxidation of sulfides: An experimental and theoretical study. Inorg Chim Acta 411: 61-66.
- Millar AJ, Doonan CJ, Laughlin LJ, Tiekink ERT, Young CG (2002) Atom transfer chemistry and electrochemical behavior of Mo(VI) and Mo(V) trispyrazolylborate complexes: new mononuclear and dinuclear species. Inorg Chim Acta 337: 393-406.
- Felton GA, Glass RS, Lichtenberger DL, Evans DH (2006) Iron-only hydrogenase mimics. Thermodynamic aspects of the use of electrochemistry to evaluate catalytic efficiency for hydrogen generation. Inorg Chem 45: 9181-9184.
- Codol Z, Garcia-Bosch I, Acuna-Pares F, Prat I, Luis JM, et al. (2013) Electronic Effects on Singleâ€ÂÂSite Iron Catalysts for Water Oxidation. Chem Eur J 19: 8042-8047.

Open Access Journals
- Aquaculture & Veterinary Science
- Chemistry & Chemical Sciences
- Clinical Sciences
- Engineering
- General Science
- Genetics & Molecular Biology
- Health Care & Nursing
- Immunology & Microbiology
- Materials Science
- Mathematics & Physics
- Medical Sciences
- Neurology & Psychiatry
- Oncology & Cancer Science
- Pharmaceutical Sciences

