Speciation and Mobility of Selected Heavy Metals in Sediments of the Nun River System, Bayelsa State, Nigeria
Ayobami Aigberua* and Timi Tarawou
Department of Chemical Sciences, Faculty of Science, Niger Delta University, Wilberforce Island, Bayelsa State, Nigeria
- *Corresponding Author:
- Ayobami Aigberua
Department of Chemical Sciences
Faculty of Science, Niger Delta University
Wilberforce Island, Bayelsa State, Nigeria
Tel: +2348032765181
E-mail: ozedee101@gmail.com
Received Date: December 26, 2017; Accepted Date: January 13, 2018; Published Date: January 25, 2018
Citation: Aigberua A, Tarawou T (2018) Speciation and Mobility of Selected Heavy Metals in Sediments of the Nun River System, Bayelsa State, Nigeria. Environ Toxicol Stud J Vol. 2:1.
Abstract
The speciated fractions of some selected environmentally toxic heavy metals (Pb, Cu, Cr, Cd, Zn, Fe and Ni) were assessed in the bottom sediments of the Nun river system. The concentrations (mg/kg) of the selected heavy metals per fraction were analysed using the GBC AVANTA PM A6600 FAAS. Chemical speciation study applying the five-stage sequential extraction scheme revealed the prevalent fractions where the selected heavy metals were bound: Pb, Cu, Cr, Cd, Zn and Fe were prevalent in the residual fractions while Ni was mainly bound to the Fe-Mn oxide fraction. The mobility factor indices of the metals depicted the following trends: Pb>Cr>Zn>Cd>Ni>Cu>Fe and Pb>Cr>Cd>Ni>Zn>Fe>Cu for the samples and control points respectively. Mobility factor indices showed highest lability for Pb and Cr across the sample and control points, while the least lability and mobility was observed for Fe and Cu across all sampling points of the river. The sediments of the Nun river system revealed a high mobility and bioavailability for Pb and Cr. The two-way ANOVA statistical analysis of data showed significant variation (P<0.05) between metal fractions and the spatial distribution of sediment samples across the river system except for Pb which revealed the highest mobility and tendency for bioavailability.
Keywords
Heavy metals; Speciation; Mobility factor; Lability; River Nun
Introduction
Elemental speciation is a key to identifying and quantifying metal species with respect to their affinity, mobility, bioavailability and environmental toxicity in the ecosystem. The standard analytical test protocol of one sequence extraction which is currently practicable for heavy metals quantification, and also forms the basis of our environmental guidelines and standard limitations for metals in the ecosystem, rather considers trace/heavy metals as bulk constituents of a sediment matrix rather than fractional isolates of individual metal species that depict the associated ecological risk of heavy metals.
Pollution of the ecosystem is affecting environmental sustainability [1-6]. Sediments contaminated with metals may act as a secondary pollution source for aquatic ecosystem, and study of metal concentration in sediment is useful for the estimation of pollution trends [7]. In a country like Nigeria, where the emission and disposal of all sorts of wastes into the environment is not monitored, the contribution of heavy metals pollutants to the environment by anthropogenic sources is overwhelming, hence, repeated evaluation of the pollution status of the environment especially the soil is imperative [8].
Heavy metals are associated with various soil components in different ways and these associations determine their mobility and availability [9]. In a river system, sediments serve as heavy metals repository, however alterations in ecosystem conditions such as tidal currents, wind energies and turbulent dynamics, water pH, redox potential, seasonal flooding and storms may cause periodic remobilization of contaminated surface and bottom sediments, thereby making bottom sediments a potential source by releasing heavy metals into the overlying water column [10,11].
The use of sequential extractions, although more time consuming, furnishes detailed information about the origin, mode of occurrence, biological and physicochemical availability, mobilization and transport of trace metals [12].
The aim of the present study is to investigate the different speciated chemical fractions of selected heavy metals (Pb, Cu, Cr, Cd, Zn, Fe and Ni) in the Nun river sediments as well as determine their mobility factor indices.
Materials and Methods
Study area
The River Nun is one of the major navigable channels of the Niger Delta which leaves the main course of the Niger River to split into two, forming the Nun and Forcados rivers. The Nun River flows for about 160 km south to the Gulf of Guinea, a wide inlet of the Atlantic Ocean at Akassa. The river course flows through thinly settled areas and swamps [13]. The main course of the river lies between the coordinates of latitude 5.298847°N and longitude 6.414350°E. The river was most extensively used for trade in the 19th century before the silting in the bar at the mouth of the river impeded access. The discovery of petroleum along the Nun River in 1963 and subsequent completion of the Trans-Niger pipeline in 1965 has increased the economic importance of the river. Over the years, substantial oil and gas exploration activities as well as other anthropogenic input along the course of the river may have substantially influenced the environment. The Nun flows through sparsely settled zones of fresh water, mangrove swamps and coastal sand ridges. The river system is characterized by large wetlands, a network of underwater oil pipelines which are sometimes prone to being vandalized, leaving surrounding mudflats and grassy lakes intermittently covered by oil sheen depending on the water tide. The predominant occupation of the inhabitants is majorly fishing and farming, the study area and sample locations are as shown in (Figure 1).

Figure 1: Map of sediment sampling points on the Nun River.
Field sampling
Sediment samples were collected in a manner that reflected the oil and gas activities within the river. 12 sample and 2 control points were established in a random manner along the river course. An Eckman grab was deployed to collect bottom sediments and each sampling point was geo-referenced with a hand-held Garmin Etrex model GPS. Duplicate samples were collected for each sampling point and transferred into pre-cleaned polyethylene bags before been stored in an ice chest.
Sample preparation, analytical validation and quality control procedure
Sediment samples were air-dried at room temperature, homogenized by grinding and sieved through a 2 mm mesh size sieve before being further sub sampled and labelled in plastic vials. Glassware was properly cleaned, oven-dried and cooled in a desiccator. Reagent blank was prepared for each fraction of the sequential extraction. A working standard solution of 100 mg/l was prepared from the stock standard solution of each test metal; this was prepared by diluting known volumes of the stock solution in a calibrated volumetric flask using distilled water. 1000 mg/l of an AccuStandard, USA stock solution of each metal was diluted accordingly to prepare a series of intermediate standard solutions which were used for the calibration of the FAAS. During analysis, method blanks and standard solutions were analysed at the start, midpoint and end of run of each fractional species. The following wavelengths were applicable for the analysis of study metals: Pb=217.0 nm, Cu=324.7 nm, Cr=357.9 nm, Cd=228.8 nm, Zn=213.9 nm, Fe=372.0 nm, Ni=232.0 nm.
Reagents and chemicals
The reagents and chemicals used are of analytical grade, some of which include: 37% hydrochloric acid (Sigma-Aldrich, Germany), 65% nitric acid, 30% hydrogen peroxide and 39%-43% hydrofluoric acid (BDH – Poole, UK). All standard solutions were prepared using distilled water; working standards of the seven metals under study were prepared by diluting different known volumes of their stock solutions of 1,000 mgdm-3.
Sequential extraction of heavy metals
The five-stage sequential extraction scheme reported by Rauret et al. was used. 1.0 g of air-dried sediment was sequentially extracted as follows [14]:
Fraction 1 (Exchangeable metals): 1 ± 0.0001 g duplicate portion of finely divided sample was weighed into a plastic centrifuge, 8 ml of 1 M MgCl2.6H2O (pH=7) was added and the sediment solution was extracted at room temperature for 1 hour with continuous agitation before been centrifuged at 2500 rpm for 20 minutes. After centrifugation, the mixture was filtered and the supernatant was stored.
Fraction 2 (Metals bound to carbonates): 8 ml of 1 M sodium acetate (pH=5, using acetic acid) was added to the recovered residue from fraction 1 at room temperature and under continuous agitation for 5 hours. Mixture was further centrifuged at 2500 rpm for 20 minutes before storing the supernatant.
Fraction 3 (Metals bound to Fe-Mn oxide): To the residue obtained from fraction 2 was added 20 ml of 0.04 M hydroxylamine hydrochloride (NH2OH.HCl) in 25% v/v acetic acid. Solution was heated in a water bath at 96°C for 6 hours. Afterwards, mixture was centrifuged at 2500 rpm for 20 minutes and supernatant stored.
Fraction 4 (Metals bound to organic matter): 3 ml of 0.02 M nitric acid (HNO3) and 5 ml of 30% hydrogen peroxide (H2O2) (pH=2, using nitric acid) was added to the residue obtained from fraction 3. Mixture was heated in a water bath at 85°C for 3 hours and cooled, a further 5 ml of 1.2 M ammonium acetate in 20% v/v nitric acid (HNO3) was added and diluted to 20 ml with distilled water, mixture was intermittently agitated for 30 minutes prior to a 20 minute centrifugation at 2500 rpm before storing the supernatant.
Fraction 5 (Residual metals): Residue from fraction 4 was transferred into Teflon beakers with minimum amount of distilled water before adding 2 ml HCl, 6 ml HNO3 and 3 ml of 30% H2O2. Mixture was digested on a hotplate (in a fume cupboard) until almost dry. Further volumes of HNO3, HF and 30% H2O2 were added and digested on a hot plate to near-dryness. 20 ml of distilled water was added and digested on a hotplate to about 15 ml volume. The extract was diluted to 25 ml with distilled water and centrifuged at 2500 rpm for 20 minutes, filtered and the supernatant stored.
Mobility factor
The relative index of metal mobility was calculated as a mobility factor (MF) [15,16] by applying the equation:
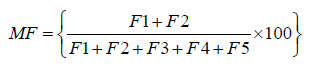
Definition of variables:
F1=Exchangeable metal fraction
F2=Carbonate bound metal fraction
F3=Fe-Mn oxide bound metal fraction
F4=Organic matter bound metal fraction
F5=Residual metal fraction.
Statistical analysis of data
SPSS software was used to carry out the biostatistical analysis. The data were expressed as Mean ± standard deviation. A two-way analysis of variance was carried out at P=0.05, and Duncan multiple range test statistics was used to determine the source of the observed variation. Fractionated heavy metals were correlated using Spearman’s rho correlation matrix. The heavy metal concentration in each fraction was determined by using a GBC Avanta PM A6600 FAAS.
Results and Discussion
Concentration of heavy metals in sediment
The results of the spatial distribution of heavy metals in sediments from the Nun river system (Table 1) shows that lead (Pb) concentrations ranged from 3.66 mg/kg-7.18 mg/kg and 5.08 mg/kg-5.28 mg/kg with mean values of 5.83 ± 7.02 mg/kg and 5.18 ± 7.38 mg/kg for the sample and control points respectively. The mean levels of Pb in the Nun River were higher in the mobile fractions of sample points than in the control points (Figure 2). The levels of Pb from this study agree with levels reported in previous work [17].
| Fractions | Pb, mg/kg | Cu, mg/kg | Cr, mg/kg | Cd, mg/kg | Zn, mg/kg | Fe, mg/kg | Ni, mg/kg |
|---|---|---|---|---|---|---|---|
| F1 | 13.14 ± 3.50b | 1.03 ± 2.01a | 12.47 ± 2.56b | 0.50 ± 0.24b | 13.97 ± 6.05b | 110.78 ± 96.70a | 5.92 ± 1.26a |
| F2 | 0.39 ± 1.06a | 0.12 ± 0.17a | 2.43 ± 1.98a | 0.06 ± 0.16a | 3.79 ± 4.38a | 67.73 ± 98.61a | 5.11 ± 2.53a |
| F3 | 0.41 ± 1.16a | 0.70 ± 1.34a | 3.63 ± 2.96a | 0.02 ± 0.09a | 24.88 ± 8.24c | 3488.73 ± 1790.76b | 30.49 ± 85.63b |
| F4 | 0.67 ± 2.14a | 4.81 ± 8.79b | 0.76 ± 1.50a | 0.00 ± 0.00a | 13.68 ± 11.77b | 3466.94 ± 4654.66b | 12.52 ± 21.52ab |
| F5 | 14.09 ± 4.68b | 7.09 ± 8.97b | 28.21 ± 11.60c | 2.05 ± 0.91c | 27.98 ± 26.54c | 7764.53 ± 4474.11c | 29.15 ± 4.54b |
Data are expressed as mean ± standard deviation (n=28); different letters (a, b, c) along the column indicate significance variation (P<0.05) according to Duncan multiple range test statistics
Table 1: Different fractions of heavy metals in the Nun River sediment.

Figure 2: Speciation pattern of lead.
Copper (Cu) levels across the Nun river sediments ranged between 0.25 mg/kg-14.64 mg/kg and 0.64 mg/kg-3.04 mg/kg with mean values of 2.90 ± 6.68 mg/kg and 1.84 ± 2.68 mg/kg for the sample and control points respectively (Table 2). The mean levels of Cu signify a higher retention of the element in the mobile fractions of sample points than in the control points (Figure 3). The levels of Cu in this study were similar to levels reported in previous works [17,18]. The concentration of chromium (Cr) as shown in Table 2, ranged between 7.04 mg/kg-15.38 mg/kg and 7.19 mg/kg-10.31 mg/kg with mean values of 9.62 ± 11.81 mg/kg and 8.75 ± 10.61 mg/kg for the sample and control points respectively. The mean levels of Cr in the mobile fractions of sample points were similar to those in the control points (Figure 4); this shows similarities in the Cr contamination across the Nun River irrespective of sampling point. Cr levels obtained in this study were higher than levels earlier reported [19].
| Locations | Pb, mg/kg | Cu, mg/kg | Cr, mg/kg | Cd, mg/kg | Zn, mg/kg | Fe, mg/kg | Ni, mg/kg |
|---|---|---|---|---|---|---|---|
| SED 1 | 6.13 ± 6.70a | 14.64 ± 18.55b | 7.19 ± 7.13a | 0.91 ± 1.26e | 26.60 ± 15.33bc | 4198.67 ± 3990.69bc | 14.97 ± 12.56a |
| SED 2 | 7.18 ± 6.61b | 2.67 ± 3.12a | 7.15 ± 8.49a | 0.74 ± 1.17cde | 14.64 ± 5.28ab | 5027.61 ± 5248.43cd | 11.08 ± 11.13a |
| SED 3 | 5.09 ± 5.00a | 1.97 ± 2.41a | 8.47 ± 9.66a | 0.34 ± 0.51abc | 11.57 ± 4.27a | 1933.45 ± 1952.78ab | 10.64 ± 8.18a |
| SED 4 | 5.08 ± 7.67a | 2.22 ± 2.22a | 8.38 ± 8.24a | 0.25 ± 0.40ab | 16.01 ± 9.04ab | 3987.24 ± 3575.01bc | 9.54 ± 10.84a |
| SED 5 | 6.78 ± 7.54b | 1.99 ± 3.95a | 15.38 ± 18.24c | 0.36 ± 0.44abc | 18.99 ± 10.77ab | 6674.34 ± 6568.25d | 11.69 ± 11.43a |
| SED 6 | 3.66 ± 5.06a | 1.63 ± 1.73a | 7.92 ± 7.95a | 0.51 ± 0.85abcde | 13.25 ± 7.86ab | 2280.83 ± 2612.26ab | 8.63 ± 11.56a |
| SED 7 | 5.55 ± 6.84ab | 2.03 ± 2.48a | 13.73 ± 18.89bc | 0.54 ± 0.73abcde | 19.15 ± 13.33ab | 5107.06 ± 5575.53cd | 10.38 ± 9.71a |
| SED 8 | 4.96 ± 6.62ab | 1.41 ± 0.51a | 11.51 ± 16.36abc | 0.46 ± 0.91abcd | 13.51 ± 9.66ab | 3357.43 ± 5263.14bc | 12.11 ± 11.95a |
| SED 9 | 6.47 ± 8.58ab | 0.25 ± 3.27a | 10.99 ± 15.67abc | 0.54 ± 0.90abcde | 13.13 ± 9.66ab | 2487.28 ± 3652.66ab | 10.36 ± 12.14a |
| SED 10 | 6.27 ± 8.17ab | 2.86 ± 2.81a | 9.51 ± 10.51ab | 0.49 ± 0.88abcd | 13.54 ± 7.73ab | 2430.80 ± 3515.19ab | 9.09 ± 9.36a |
| SED 11 | 7.10 ± 9.99ab | 1.57 ± 2.10a | 7.04 ± 6.67a | 0.87 ± 1.58de | 33.67 ± 46.05c | 441.48 ± 624.68a | 16.53 ± 14.22a |
| SED 12 | 5.75 ± 7.53b | 1.61 ± 1.05a | 8.22 ± 7.03a | 0.57 ± 0.85abcde | 16.62 ± 12.89ab | 2791.10 ± 3548.52abc | 88.29 ± 132.46b |
| SED C1 | 5.08 ± 8.28ab | 3.04 ± 3.27a | 10.31 ± 13.06abc | 0.18 ± 0.23a | 15.71 ± 13.63ab | 503.12 ± 690.54a | 10.68 ± 10.62a |
| SED C2 | 5.28 ± 6.82ab | 0.64 ± 1.17a | 7.19 ± 7.86a | 0.65 ± 1.09abcde | 9.65 ± 6.39a | 495.95 ± 698.70a | 8.96 ± 10.69a |
Data are expressed as mean ± standard deviation (n=10); different letters (a, b, c, d, e) along the column indicate significance variation (P<0.05) according to Duncan multiple range test statistics
Table 2: Spatial distribution of heavy metals in the Nun River sediment.

Figure 3: Speciation pattern of copper.

Figure 4: Speciation pattern of chromium.
The cadmium levels of the Nun river sediments ranged from 0.25 mg/kg-0.91 mg/kg for the sample points and 0.18 mg/kg- 0.65 mg/kg for the control points with mean values of 0.55 ± 0.91 mg/kg for the sample points and 0.41 ± 0.81 mg/kg for the control points respectively (Table 2). The mean cadmium levels in the mobile fractions of control points exceed that observed in the sediment sample points (Figure 5). Cd levels reported in this study were similar to earlier findings [20]. Current study showed higher Cd levels compared with earlier findings by Ideriah et al.

Figure 5: Speciation pattern of cadmium.
Zinc (Zn) levels across the Nun river sediments ranged between 11.57 mg/kg-33.67 mg/kg and 9.65 mg/kg-15.71 mg/kg with mean values of 17.56 ± 16.91 mg/kg and 12.68 ± 10.83 mg/kg for the sample and control points respectively (Table 2). The mean levels of Zn reveals a higher retention of the element in the mobile fractions of sample points than in the control points (Figure 6). The levels of Zn obtained in this study were comparable with levels earlier reported in previous work by Osakwe et al., while comparatively higher and lower Zn levels were reported in earlier works by Horsfall et al. and Leizou et al. respectively.

Figure 6: Speciation pattern of zinc.
The concentration of iron (Fe) ranged between 441.48 mg/kg- 6,674.34 mg/kg and 495.95 mg/kg-503.12 mg/kg with mean values of 3,393.11 ± 4,283.22 mg/kg and 499.53 ± 676.12 mg/kg for the sample and control points respectively (Table 2). The mean levels of Fe in the mobile fractions of control points significantly exceeded those found in the sample points (Figure 7). This shows comparatively higher Fe contamination levels in the sediments of sample points. Fe levels obtained in this study were found to be slightly higher than those earlier reported by Osakwe et al., while the levels were far higher than levels obtained in earlier works of Leizou et al.

Figure 7: Speciation pattern of iron.
The nickel (Ni) levels of the Nun river sediments ranged from 8.63 mg/kg-88.29 mg/kg for the sample points and 8.96 mg/ kg-10.68 mg/kg for the control points with mean values of 17.78 ± 43.52 mg/kg for the sample points and 9.82 ± 10.12 mg/ kg for the control points (Table 2). The mean levels of Ni in the mobile fractions of control points exceeded that observed in the sediment sample points. Ni levels reported in this study were similar to the levels earlier reported by Horsfall et al. On the other hand, current study showed higher Ni levels when compared to earlier findings by Ideriah et al. and Osakwe et al.
The speciation patterns of the different metals studied in the Nun river sediment sample points are described below:
In general, the results obtained from this study revealed that lead (Pb) was predominant in the residual and exchangeable fractions at mean levels of 50.70% and 43.85% respectively (Figure 2). This is consistent with the results of Leizou et al. The high percentage of Pb in the exchangeable fraction depicts its bioavailability in the Nun river system.
The predominant speciation fraction of copper (Cu) in the sediments were the residual and organic matter bound fractions with mean levels of 52.10% and 35.93% respectively (Figure 3). This was similar to previous findings of Horsfall et al., Osakwe et al., Leizou et al. and Tamunobereton-ari et al. [21]. The retention of a higher percentage of copper (Cu) in the residual fraction means that copper will not be easily released to the water column and shows less bioavailability to the aquatic organisms in the Nun river.
The results obtained from this study revealed that chromium (Cr) was predominant in the residual and exchangeable fractions at mean levels of 58.34% and 26.67% respectively (Figure 4). This is consistent with the findings of Ideriah et al. However, the relatively high percentage of chromium (Cr) in the residual fraction may depict its less bioavailability to aquatic organisms in the river.
Cadmium (Cd) showed strong affinity for the residual fraction with a mean level of 79.18% (Figure 5). This was a clear indication that cadmium (Cd) will not be easily released to the water column and so will depict less bioavailability to aquatic organisms in the river. This result was consistent with earlier findings of Horsfall et al.
The predominant speciation fraction of zinc (Zn) in the sediment was the residual and Fe-Mn oxide bound fractions with mean levels of 33.34% and 28.14% respectively (Figure 6). This further reflects the previous results of Horsfall et al., Leizou et al. The retention of a higher percentage of zinc (Zn) in the residual and Fe-Mn oxide fraction means that zinc will not be easily released to the water column and shows less bioavailability to the aquatic organisms in the river system.
The results obtained for iron (Fe) revealed its prevalence in the residual and organic matter bound fractions showing mean levels of 52.20% and 23.75% respectively (Figure 7). This is consistent with the findings of Osakwe [22] and also Osakwe et al. Leizou et al. However, the relatively higher percentage of iron (Fe) in the residual fraction may depict its less bioavailability to aquatic organisms of the Nun River.
The predominant speciation fraction of nickel (Ni) in the sediments were the Fe-Mn oxide and residual bound fractions which revealed mean levels of 39.10% and 32.78% respectively (Figure 8). This further reflects previous findings of Horsfall et al., Osakwe et al. and Tamunobereton-ari et al. The predominance of inactive forms of nickel (Ni) in the Fe-Mn oxide and residual bound fraction implies that nickel will not be easily released to the water column and shows less bioavailability to the aquatic organisms in the river system.

Figure 8: Speciation pattern of nickel.
The speciation patterns of the different study metals in the Nun river control points revealed an almost similar trend to that obtained for the sample points. Lead (Pb) was present only in two fractions; the residual and exchangeable fractions at mean levels of 65.25% and 34.75% respectively (Figure 2). Copper was predominant in the residual, Fe-Mn oxide and organic matter found fractions at mean levels of 46.30%, 26.20% and 25.87% respectively (Figure 3), A similarly strong affinity for the residual and exchangeable fractions was observed with mean levels of 61.49% and 75.96% (residual fractions) with 26.60% and 24.04% (exchangeable fractions) for chromium (Cr) and cadmium (Cd) respectively (Figures 4 and 5).
Results further revealed the predominance of inactive forms of zinc (Zn), iron (Fe) and nickel (Ni). Zinc was prevalent in the Fe-Mn oxide and residual fractions at mean levels of 40.97% and 31.90% respectively. The residual and Fe-Mn oxide fractions retained the most significant concentration of iron (Fe) with mean levels of 48.58% and 43.67% respectively. Nickel (Ni) was mostly found in the residual phase with a mean level of 59.56% (Figures 6, 7 and 8). Therefore, the metals under investigation in the Nun river sediment control points resided in the inactive geochemical fractions and depict less bioavailability to the aquatic organisms.
The heavy metal concentrations based on different fractions and spatial distributions from the Nun river sediments were presented in Tables 1 and 2 respectively. While the Spearman’s rho correlation coefficient (r) matrices for the analysed heavy metals and p-value (significance level) of the statistics carried out were presented in Tables 3 and 4 respectively. Lead concentration among the different fractions in all samples and control points ranged between 0.39 mg/kg-14.09 mg/kg (Table 1), being significantly different (P<0.05) (Table 4). Metals in fractions F2, F3 and F4 showed significant variations with those in fraction F1 and F5 (P<0.05). While the spatial distribution ranged from 3.66 mg/kg-7.18 mg/kg (Table 2), are not significantly different (P<0.05) (Table 2). Lead showed positive significant relationship with copper (r=0.330), chromium (r=0.786), cadmium (r=0.881), zinc (r=0.338) and nickel (r=0.447) at P<0.01 and iron (r=0.216) at P<0.05 (Table 3).
| Parameters | Pb | Cu | Cr | Cd | Zn | Fe | Ni |
|---|---|---|---|---|---|---|---|
| Pb | 1.000 | ||||||
| Cu | 0.330** | 1.000 | |||||
| Cr | 0.786** | 0.314** | 1.000 | ||||
| Cd | 0.881** | 0.427** | 0.842** | 1.000 | |||
| Zn | 0.338** | 0.401** | 0.358** | 0.329** | 1.000 | ||
| Fe | 0.216* | 0.468** | 0.269** | 0.281** | 0.639** | 1.000 | |
| Ni | 0.447** | 0.507** | 0.538** | 0.537** | 0.625** | 0.425** | 1.000 |
**. Correlation is significant at the 0.01 level (2-tailed)
*. Correlation is significant at the 0.05 level (2-tailed)
N=140
Table 3: Spearman's rho correlation matrix of the heavy metal parameters studied.
| Parameters | Model | Location | Fractions |
|---|---|---|---|
| Pb, mg/kg | 0.000 | 0.303 | 0.000 |
| Cu, mg/kg | 0.000 | 0.000 | 0.000 |
| Cr, mg/kg | 0.000 | 0.005 | 0.000 |
| Cd, mg/kg | 0.000 | 0.001 | 0.000 |
| Zn, mg/kg | 0.000 | 0.008 | 0.000 |
| Fe, mg/kg | 0.000 | 0.000 | 0.000 |
| Ni, mg/kg | 0.000 | 0.000 | 0.012 |
Note: Any metal with value less than 0.05 indicate a significant difference
Table 4: P-value (significance level) for the heavy metals studied.
The concentration of copper among the various fractions ranged from 0.12 mg/kg-7.09 mg/kg (Table 1). Basically, there was significance difference (P<0.05) among the different fractions (Table 1). While the spatial distribution ranged from 0.25 mg/kg- 14.64 mg/kg (Table 2), being significantly different (P<0.05) (Table 4). Metals in fraction F1, F2 and F3 showed significant variations with those in fractions F4 and F5 (P<0.05). Copper showed positive significant relationship with lead (r=0.330), chromium (r=0.314), cadmium (r=0.427), zinc (r=0.401), iron (r=0.468) and nickel (r=0.507) at P<0.01 (Table 3).
The concentration of chromium among the various fractions ranged from 0.76 mg/kg-28.21 mg/kg (Table 1). Basically, there was significant difference (P<0.05) among the different fractions (Table 4) apart from fractions F2, F3 and F4. While the spatial distribution ranged from 7.04 mg/kg-15.38 mg/kg (Table 2), being significantly different (P<0.05) (Table 4). The source of the variation is from station 10 (Table 2). Chromium showed positive significant relationship with lead (r=0.786), copper (r=0.314), cadmium (r=0.842), zinc (r=0.358), iron (r=0.269) and nickel (r=0.538) at P<0.01 (Table 3).
The concentration of cadmium among the various fractions ranged from 0.00 mg/kg-2.05 mg/kg (Table 1). Basically, there was significant difference (P<0.05) among the different fractions (Table 1) apart from fractions F2, F3 and F4. While the spatial distribution ranged from 0.18 mg/kg-0.91 mg/kg (Table 2), being significantly different (P<0.05) (Table 4). Cadmium showed positive significant relationship with lead (r=0.881), copper (r=0.427), chromium (r=0.842), zinc (r=0.329), iron (r=0.281) and nickel (r=0.537) at P<0.01 (Table 3).
The concentration of zinc among the various fractions ranged from 3.79 mg/kg-27.98 mg/kg (Table 1). There was significant difference (P<0.05) (Table 4). While the spatial distribution ranged from 9.65 mg/kg-33.67 mg/kg (Table 2), showing significant variation (P<0.05) (Table 2). Zinc showed positive significant relationship with lead (r=0.338), copper (r=0.401), chromium (r=0.358), cadmium (r=0.329), iron (r=0.639) and nickel (r=0.625) at P<0.01 (Table 3).
The concentration of iron among the various fractions ranged from 67.73 mg/kg-7,764.53 mg/kg (Table 1). There was significant difference (P<0.05) among the different fractions (Table 1). While the spatial distribution ranged from 441.48 mg/kg-6,674.34 mg/ kg (Table 2), showing significant variation (P<0.05) (Table 4). Iron showed positive significant relationship with lead (r=0.216), copper (r=0.468), chromium (r=0.269), cadmium (r=0.281), zinc (r=0.639) and nickel (r=0.425) at P<0.01 (Table 3).
Similarly, the concentration of nickel among the various fractions ranged from 5.11 mg/kg-30.49 mg/kg (Table 1). There was significant difference (P<0.05) among the different fractions (Table 1). While the spatial distribution ranged from 9.65 mg/kg-33.67 mg/kg (Table 2), showing significant variation (P<0.05) (Table 4). Metals in fraction F1 and F2 showed significant variation with those in fractions F3, F4 and F5 (P<0.05). Nickel showed positive significant relationship with lead (r=0.447), copper (r=0.507), chromium (r=0.538), cadmium (r=0.537), zinc (r=0.625) and iron (r=0.425) at P<0.01 (Table 3).
The findings of this study suggest that there was no significant variation in the different heavy metal fractions and their spatial distributions apart from lead (Pb). There was also significant variation between all metals in the five fractions. The variation in lead may have resulted from the different levels of oil and gas activities across the Nun River. The significant variations in the different metal fractions may be attributed to the heavy metals different binding affinities that may have been due to the effect of environmental changes.
Mobility factors of heavy metals in sediment
The fate of metal ions in sediment of the overlying water column is dependent on its mobility factor. Mobility factors (MF) of metals provide an indication of the bioavailability or non-bioavailability of the metal as described by Osakwe et al. Heavy metals in sediment are fractionated in the order of decreasing solubility, therefore, the exchangeable and carbonate (F1+F2) fractions which are the free ion species with most solubility reflect the mobile and bioavailable forms [23]. A high MF value of the heavy metals in the sediment has been interpreted as evidence of relatively high lability and biological availability [24].
The mobility factors (MF) for all the sample and control points are presented in Table 5.
| Mobility Factor (s) (%) | Sample points | Control points |
|---|---|---|
| Lead, Pb | 48.99 | 34.83 |
| Copper, Cu | 5.91 | 1.55 |
| Chromium, Cr | 31.29 | 31.91 |
| Cadmium, Cd | 20.92 | 23.88 |
| Zinc, Zn | 21.92 | 14.07 |
| Iron, Fe | 1.12 | 4.21 |
| Nickel, Ni | 12.56 | 20.81 |
Table 5: Mobility factors of heavy metals in sediment.
The mobility factors for the heavy metals studied show the following trend: Pb>Cr>Zn>Cd>Ni>Cu>Fe and Pb>Cr>Cd>Ni>Zn>Fe>Cu for the sample and control points respectively. The relatively high mobility factor of lead (Pb) and chromium (Cr) in the bottom sediments of the Nun river at both the sample and control points reflect the significant concentrations of lead (Pb) and chromium (Cr) that were found in the exchangeable fraction (Refer to Tables 1 and 5). This trend confirms that lead (Pb) and chromium (Cr) possess high lability, bioavailability and may be considered as pollutants of the river system; on the other hand, iron (Fe) and copper (Cu) were observed to be the least mobile and possessing the least bioavailability, hence they posed no risk to the Nun river tributary.
Conclusion
The single phase extraction scheme most commonly used for the quantitative estimation of heavy metals and as guide for environmental decision making may need to be used side by side with the multi-step and sequential qualitative approach in order to paint a vivid picture of the biogeochemical interactions that take place within an ecosystem with focus on identifying the free, labile and mobile metal ion species that become biologically available in such a way as to pose ecological risk. This study showed that heavy metals such as copper, cadmium, zinc, iron and nickel were significantly affiliated to the inert fractions of the sediment matrix which limited their mobility and reactivity while lead and chromium showed significant concentrations in the more labile and mobile exchangeable fractions of the sediment matrix.
References
- Adu AA, Oderinola OJ, Kusemiju V (2014) Assessment of trace metal levels in commonly edible vegetables from selected markets in Lagos State, Nigeria. Current World Environment 9: 789-796.
- Izah SC, Chakrabarty N, Srivastav AL (2016) A Review on heavy metal concentration in potable water sources in Nigeria: Human health effects and mitigating measures. Exposure and Health 8: 285-304.
- Izah SC, Angaye TCN (2016) Heavy metal concentration in fishes from surface water in Nigeria: Potential sources of pollutants and mitigation measures. Sky Journal of Biochemistry Research 5: 31-47.
- Izah SC, Bassey SE, Ohimain EI (2017a) Geo-accumulation index, enrichment factor and quantification of contamination of heavy metals in soil receiving cassava mill effluents in a rural community in the Niger Delta region of Nigeria. Molecular Soil Biology 8: 7-20.
- Izah SC, Bassey SE, Ohimain EI (2017b) Assessment of heavy metal in cassava mill effluent contaminated soil in a rural community in the Niger Delta region of Nigeria. EC Pharmacology and Toxicology 4: 186-201.
- Izah SC, Bassey SE, Ohimain EI (2017c) Assessment of pollution load indices of heavy metals in cassava mill effluents contaminated soil: A case study of small-scale cassava processing mills in a rural community of the Niger Delta region of Nigeria. Bioscience Methods 8: 1-17.
- Salomaons W, Forstner U (1980) Trace metal analysis of polluted sediments. Part 2. Evaluation of environmental impact. Environ Technol Lett 1: 506-517.
- Nriagu JO, Pacyna JM (1988) Quantitative assessment of worldwide contamination of air, water and soils by trace metals. Nature 333: 134-139.
- Ahumuda I, Mendoza J, Navarrete E, Ascar L (1999) Sequential extraction in soils irrigated with waste water. Commun Soil Sci Plant Anal 30: 1507-1519.
- Eggleton J, Thomas KV (2004) A review of factors affecting the release and bioavailability of contaminants during sediment disturbance events. Environment International 30: 973-980.
- Calmano W, Hong J, Forstner U (1993) Binding and mobilization of heavy metals in contaminated sediments affected by pH and redox potential. Water Sci Technol 28: 223-35.
- Tessier A, Campbell PG, Bisson M (1979) Extraction procedure for the speciation of particulate trace metals. Anal Chem 51: 844.
- Encyclopaedia Britannica (2013) Nun River: River, Nigeria 17 July 2013, Available from: https://www.britannica.com/place/Nun-River.
- Rauret GRR, Sanchez Lopez JF (1989) Optimization of Tessier procedure for metal solid speciation in river sediments. Int J Environ Anal Chem 36: 69-83.
- Salbu B, Kreling I, Oughlon DH (1998) Characterization of radioactive particles in the environment. Analyst 123:843-849.
- Kabala C, Singh BR (2001) Fractionation and mobility of copper, lead and zinc in vicinity of copper smelter. J of Environmental Quality 30: 485-492.
- Osakwe JO, Adowei P, Horsfall MJ (2014) Evaluation of heavy metal species in bottom sediments from Imo River System, South-eastern Nigeria. Res J Chem Sci 4: 23-30.
- Leizou KE, Horsfall MJ, Spiff AI (2015) Speciation of some heavy metals in sediments of the Pennington River, Bayelsa State, Nigeria. American Chemical Science Journal 5: 238-246.
- Ideriah TJK, Ikpe FN, Nwanjoku FN (2013) Distribution and speciation of heavy metals in crude oil contaminated soils from Niger Delta, Nigeria. World Environment 3: 18-28.
- Horsfall MJ, Horsfall MN, Spiff AI (1999) Speciation of heavy metals in inter-tidal sediments of the Okrika River System, Rivers State, Nigeria, Bull. Chem Soc Ethiop 13: 1-9.
- Tamunobereton-ari I, Omubo-Pepple VB, Tamunobereton-ari NA (2011) Speciation of heavy metals (Cu, Pb, Ni) pollutants and the vulnerability of groundwater resource in Okrika of Rivers State, Nigeria. American Journal of Scientific and Industrial Research.
- Osakwe SA (2010) Chemical speciation and mobility of some heavy metals in soils around automobile waste dumpsites in Northern Part of Niger Delta, South Central Nigeria. J Appl Sci Environ Manage 14: 123-130.
- Kersten M, Forstner U (1989) Speciation of trace elements in sediments In: Batley G (eds) Trace Element Speciation. Analytical Methods and Problems. CRC Press, Boca Raton, FL. 245.
- Ma LQ, Rao N (1997) Chemical fractionation of cadmium, copper, nickel and zinc in contaminated soils. J Environ Qual 26: 259-264.
Open Access Journals
- Aquaculture & Veterinary Science
- Chemistry & Chemical Sciences
- Clinical Sciences
- Engineering
- General Science
- Genetics & Molecular Biology
- Health Care & Nursing
- Immunology & Microbiology
- Materials Science
- Mathematics & Physics
- Medical Sciences
- Neurology & Psychiatry
- Oncology & Cancer Science
- Pharmaceutical Sciences