ISSN : 2249 - 7412
Asian Journal of Plant Science & Research
Spatial Assessment of Vegetation Dynamics in a Rapidly Rural Transforming Ikwerre Local Government Area of Rivers State, Nigeria
Weli VE*, Eludoyin OS, Agaviezor DT
Department of Geography and Environmental Management, University of Port Harcourt, Port Harcourt, Nigeria
Abstract
This study was conducted to assess the vegetation dynamics in a rapidly rural transforming Ikwerre Local Government Area (LGA) of Rivers State, Nigeria. Vegetation dynamics data were acquired from Landsat satellite data of 1988, 2003 and 2018. Data acquired were subjected to descriptive and inferential statistical analysis. The results showed that there was a reduction in the vegetation area in both 2003 and 2018 to 404.15 km2 (60.27%) and 225.07 km2 (33.56%) respectively and agricultural activities decreased the vegetation cover from 76.6% in 1988 to 60.3% in 2003 and then 33.6% in 2018. The increase in agricultural activities decreased the vegetation cover from 76.6% in 1988 to 60.3% in 2003 and then 33.6% in 2018. There was however an increase in the size of the water bodies from 0.23% in 1988 to 0.30% in 2003 and to 0.68% in 2018. The bare surface decreased from 3.67% in 1988 to 2.47% in 2003 but later increased to 3.40% in 2018. The highest NDVI values (0.38 - 0.50) were observed in 1988. Negative values were observed in 1988 (-0.05 - 0.10) and 2003 (-0.12 -0.01). The study concluded that vegetation cover in Ikwerre Local Government Area has decreased significantly possibly because of the increase in the farmlands and other human activities. The study therefore recommended that human activities contributing to the decrease in the vegetation cover in the study area should be discouraged and more studies like this should be extended to other LGAs in Rivers State.
Keywords
Vegetation dynamics; Landsat; NDVI; Agricultural activities; Anthropogenic activities
Introduction
Vegetation is the general plant life or the total plant cover forming parts of the biological system and it is the primary producer of any ecosystem [1]. This term is wider in scope than when flora is used. Flora refers to species composition in an environment. Another word for vegetation is plant community. Vegetation covers all sphagnum bogs as well as farm lands. Vegetation has a considerable impact on surficial energy exchange processes and acts as an interface between land and atmosphere. It affects local and regional climate and the hydrologic balance at the surface. Vegetation dynamics have been recognized to be of primary importance in the global change of terrestrial ecosystems. Changes in vegetation coverage rank as one of the key components of vegetation dynamics, which can help to assess the environmental effects of vegetation cover change more clearly. There a lot of benefits natural functioning of healthy and productive vegetation to mankind. Vegetation helps all forms all life on earth because it provides food, oxygen, fertility and enhances survival of life in general. Vegetation dynamics refers to the changes in the growth, mortality and reproduction pattern of vegetation. This also included the interactions among plants that share light, water, and soil nutrients as common resources. It also includes seed production and dispersal, which govern vegetation migration when climate and environment change. Plant communities are temporally and spatially dynamic because they are biological systems. This implies that they change at all possible scales. Dynamism in vegetation refers to the changes in species composition and/or vegetation structure in an environment. Vegetation dynamics occur in the absence of perturbations, but the individual processes (e.g., mortality, recruitment, and competition) can be increased, arrested, or set onto novel trajectories because of chronic perturbation (e.g., rising CO2 or temperature) or abrupt disturbances (e.g., wildfire or insect outbreaks). For example, the mortality rate of undisturbed old-growth forests has more than doubled in the last four decades, potentially due to chronic environmental changes.
The primary vegetation of the delta is fast changing to secondary and derived vegetation due to aggressive incursion of human activities (agricultural practices, urbanization etc.) into the seemingly undisturbed ecosystem that characterized the region about a century ago. Vegetation cover also helps keep the climate stable by offsetting temperature and moisture fluctuations in a process called transpiration. Plants utilize carbon dioxide during photosynthesis. This means, photosynthesis slightly offsets the amount of greenhouse gases that are daily released into the atmosphere in the form of burning fossil fuels. Plants growth in a place is dependent on climatic condition of the immediate environment of the plant. Plants occupies space between earth’s surface and the atmosphere, as a matter of fact the play there role in the exchange of energy with the surrounding air. Climate variability and land use change have been recognized as two important factors influencing vegetation dynamics under global change. Plant growth responds to environmental change, and the differences among individuals, species, and functional groups determine the size structure and composition of communities. Both site-to-site differences and inter annual variation in growth rates show strong effects of temperature and moisture variability, but with substantial differences among species and size classes. Ikwerre Local Government area vegetation is becoming sparser than what is used to be, because of the changes over time in temperature and rainfall pattern that have taken place. Different researches in time past only focused on the difficulties associated with the effects of climate variability on the vegetation. Furthermore, Adepoju et al. found out that vegetation is important as it serves as interlink between the atmosphere and the hydrosphere [2]. Any change in vegetation has a way of affecting all components of the environment (be it the biotic and abiotic). Vegetation plays vital role of providing balance or equilibrium in water and carbon cycle to ensure continuity that is environmental balance. Snyder, reported that vegetation biomes from around the globe have a tremendous influence on the climate system which resulted from the type of vegetation, the area covered and physical processes involved [3]. The vegetation system can be acutely sensitive to changes in the atmospheric properties, and as a result of this variability yield to changes which can tilt towards the negative side or positive side.
Thus, Yan et al. revealed that vegetation has a great impact on surficial energy that helps in the interaction between land and atmosphere [4]. Vegetation affects climate and the hydrologic balance at the surface. Changes in vegetation coverage are recognized key components of vegetation dynamics, and this help in assessing the environmental effects of vegetation cover change properly. Activities like industrialization and urbanization contributed immensely to vegetation changes globally. It was reported vegetation dynamics as a result of climatic elements in China using SPOT vegetation and metrological data to study the level of response of vegetation changes to rainfall and temperature as main climatic elements. It was noted similar land cover change and vegetation dynamics in Kebbi State, Nigeria from 1986 to 2016. Friday, had also revealed that a significant change in vegetation cover due to urban sprawl, increase in farm activities and industrial activities in Southern Nigeria. Therefore, it is important to carry out this study because of the failure of many of the previous studies to consider the vegetation dynamics of Ikwerre LGA owning to the fact that LGA is important because of its location in the rainforest ecological zone which is the home to different fauna wild animals and bush meat of various species and flora species include trees, lianas, epiphytes and climbers.
Materials and Methods
Study Area
The study was carried out in Ikwerre Local Government Area, Rivers State, Nigeria. It is located between latitude 4o 47’ 14” and 5o 06” 58” North and longitudes 7o 00’ 14” East and 7o 02” 47” East (Figure 1). The major soil group in Ikwerre Local Government Council, Rivers State is predominately sandy and loamy which are really found in the zone of fresh water. The soil usually lies beneath by a layer of water-resistant pan and is always leached due to heavy rainfall.

Figure 1: Distribution of maize accessions for the first two principal components.
The study area was originally occupied by rainforest which has been drastically modified by human activities while in most places, economic trees particularly oil palm have been preserved and this oil palm tree is abundant in the study area. The vegetation of the study area is rainforest which experiences heavy rainfall and high temperature all the year and relative humidity of 90%. The vegetation types include trees, lianas, epiphytes and climbers. The surface topography is fluvial deposits. Mud, sand, peat, sediment rock conveyed by the Niger River distributaries are deposited to wind up enormous mainland sandstones overlaying a variation of sandstones and clay of imperceptibly marine source. They are traditionally farmers, fishermen and hunters, but in recent times, the environmental degradation and urban sprawl associated with oil exploration and exploitation has caused a sharp decline in the amount of farmland, forests and rivers available for their traditional occupations.
Sources of Data and Image Processing
Landsat Thematic Mapper (TM), Enhanced Thematic Mapper Plus (ETM+) and Operational Land Imager (OLI) satellite data of 1988, 2003 and 2018 respectively were used to produce the maps for study period and analyse the vegetation dynamics that occurred during this period in the study area. The satellite images were obtained from the archives of United States Geological Survey (USGS) with certain metadata and spatial characteristics as presented in Table 1.
| Satellite Platform | Path/Row | Band Used | Date Acquired | Resolution | Source |
|---|---|---|---|---|---|
| Landsat5 TM | 188/057 | 432 | 19/12/1988 | 30 m | USGS |
| Landsat7 ETM+ | 188/057 | 432 | 08/01/2003 | 30 m | USGS |
| Landsat8 OLI | 188/057 | 543 | 25/12/2018 | 30 m | USGS |
Table 1: Landsat metadata for the study area.
Land Use Land Cover (LULC) Classification and Analysis
Training samples used in classifying the satellite images were created to represent the wanted and anticipated land use and land cover types of the study area. Training samples were selected by defining polygons around representative sites for each of the predetermined LULC class [5]. Bands 543 of Landsat 8 OLI and 432 of Landsat ETM+ and TM, were combined to create colour composite images for pictorial interpretation and delineation of training areas. Subsequently, a signature file was created for each LULC type. To carry out the LULC classification, supervised classification approach was used with Maximum likelihood (MLH) algorithm in ArcMap 10.5 [6]. Maximum likelihood algorithm, being a common classification approach when accurate training data is provided, is a widely used algorithm [7]. The algorithm apart from considering the mean vector of the pixels in one class also accounted for the variability of these pixels in multispectral feature space [8]. It is regarded as one of the most accurate classifiers as it is based on statistical parameters [2]. Five land use/cover types were identified and used in this study, namely (1) built up areas (2) agriculture (3) vegetation (4) water bodies and (5) bare surface. Descriptions of the different major landuse/land cover (LULC) types are shown in Table 2.
| Land use/land cover classes | General description |
|---|---|
| Built-up area | Commercial and residential buildings, industrial sites, construction sites, Institutional areas, roads and other man-made structures |
| Water bodies | Dams, Rivers, lakes, water reservoirs, ponds, and streams |
| Vegetation | Evergreen and Deciduous Broadleaf forests, medium and less dense forests, forest plantations and agricultural plantations |
| Agriculture | Commercial and small-scale farms, irrigated and non-irrigated farms, fallow lands, sparsely vegetated lands |
| Bare surface | Rocks, stone, hills, earth and sand land in-fillings, developed land, excavation sites, barren and bare lands |
Table 2: Description of major landuse/land cover classes.
Change Detection and Analysis
Change detection was applied to compare and analyze the LULC maps that finally emerged between 1988 and 2018 as a result of subsequent supervised classification [5]. These classified images at different times were used to calculate the area (sq.km and %) of different land covers and also observe and identify changes occurring in different classes of LULC like an increase in agricultural land or decrease in vegetation and so on.
Normalized Difference Vegetation Index Estimation
Normalized Difference Vegetation Index (NDVI) was employed to measure the abundance and characteristics of vegetation cover in the selected mining communities. The positive relationship between plant status characteristics and vegetation abundance enabled the application of NDVI in vegetation monitoring and tracking of seasonal changes [9,10]. The abundance and the richness of the vegetation in this study were analyzed using Normalized difference vegetation index. According to Bagherzadeh et al. the Normalized difference vegetation index ranges from −1 which depicts water bodies and to +1 which represents dense vegetation or tropical rainforest [11].
Mathematically, NDVI was calculated using equation (1)
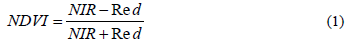
Where, NIR is Near Infrared spectral band and R is Red spectral band. In this study, Landsat 8 derived NDVI was generated as follows:
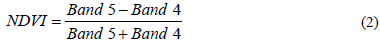
While Landsats 7 and 5 derived NDVI were generated as follows:
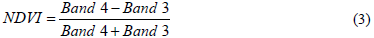
Data generated were subjected to descriptive statistics such as frequencies and percentages.
Results and Discussion
Land use/Land Cover Classification for The Years 1988, 2003 and 2018
The classified map and Land use/land cover classes of Ikwerre LGA for the year 1988, 2003 and 2018 is summarized in Figures 2-4 and Table 3. The LULC classification was divided into 5 classes which includes built up area, agriculture, vegetation, water body and bare surfaces. The result reveals that the total land area of the Ikwerre LGA is 670.62 sq. km. The percentage area of each of the class in 1988, 2003 and 2018 showed that vegetation had the highest area of 513.64 km2 (76.59%) in 1988, but there was a reduction in the vegetation area in both 2003 and 2018 to 404.15 km2 (60.27%) and 225.07 km2 (33.56%) respectively. This is in line with the findings of Hassan et al. who recorded a decline in vegetation area from 121.36 km2 (13.49%) in 1988 to 61.38 km2 (6.82%) [12]. Comparison between the years showed that the agriculture area broadened from 109.15 km2 (16.28%) in 1988, to 210.81 km2 (31.44%) in 2003, to 349.72 km2 (52.15%) in 2018. Agriculture occupied the largest area in 2018 showing a significant increase in the agriculture area.

Figure 2: LULC of 1988.

Figure 3: LULC of 2003.

Figure 4: LULC of 2018.
| LULC CLASSES | 1988 | 2003 | 2018 | |||
|---|---|---|---|---|---|---|
| Area (Sq. km) | Area (%) | Area (Sq. km) | Area (%) | Area (Sq. km) | Area (%) | |
| Built Up Areas | 21.69 | 3.23 | 37.03 | 5.52 | 70.87 | 10.57 |
| Agriculture | 109.15 | 16.28 | 210.81 | 31.44 | 349.72 | 52.15 |
| Vegetation | 513.64 | 76.59 | 404.15 | 60.27 | 225.07 | 33.56 |
| Water Body | 1.51 | 0.23 | 2.02 | 0.30 | 4.57 | 0.68 |
| Bare Surface | 24.63 | 3.67 | 16.60 | 2.47 | 20.39 | 3.04 |
| Total | 670.62 | 100.00 | 670.62 | 100.00 | 670.62 | 100.00 |
Table 3: Land use/land cover classes of Ikwerre LGA (Sq. Km).
Percentage Distribution of Land Use/Land Cover Classes and Class Change Trend of Ikwerre LGA from 1988- 2018
Figure 5 shows the percentage distribution of LULC classes of Ikwerre LGA while Figure 6 shows the Land use/Land cover class change trend (sq. km) from 1988-2018. The built up area was 3.2% in 1988, 5.5% in 2003 and 10.6% in 2018. More so, agriculture increased from 16.3% in 1988 to 31.4% in 2003 and then 52.1% in 2018. This shows improved agricultural activities in the local government area over the years. The increase in agricultural activities decreased the vegetation cover from 76.6% in 1988 to 60.3% in 2003 and then 33.6% in 2018. There was however an increase in the size of the water bodies from 0.23% in 1988 to 0.30% in 2003 and to 0.68% in 2018. The bare surface decreased from 3.67% in 1988 to 2.47% in 2003 but later increased to 3.40 in 2018.

Figure 5: Percentage distribution of Land use/Land cover Classes of Ikwerre LGA.

Figure 6: Key informant experts’ interviews at Agena (Eza Woreda) and Emdibir (Cheha Woreda) (Photo by Belay Zerga, 2017).
NDVI Analysis of Ikwerre Local Government for the year 1988, 2003 and 2018
Table 4 and Figures 7-9 show the NDVI map and values of Ikwerre LGA for the year 1988, 2003 and 2018. The highest NDVI values were observed in 1988 (0.39 - 0.50). There was a decrease in the values in 2003 (0.23 - 0.36) which later increased in 2018 (0.23 - 0.32). Negative values were observed in 1988 and 2003 (-0.05 - 0.01) and (-0.12 - -0.01) respectively. Interpretation of NDVI values ranges from +1.0 to -1.0. NDVI values of 0.1 or less, shows that there is no vegetation at all. It could be barren rock, sand or snowy land. NDVI values of 0.2 to 0.5 represent shrubs, crops and grassland area. NDVI values of 0.6 to 0.9 depict temperate and tropical rainforest. From the NDVI values generated, it shows that the vegetation in Ikwerre local government is changing to a grassland region.
| NDVI 1988 | NDV1 2003 | NDVI 2018 | |
|---|---|---|---|
| 1 | -0.05 - 0.10 | -0.12 - -0.01 | 0.03 - 0.10 |
| 2 | 0.11 - 0.17 | 0.00 - 0.05 | 0.11 - 0.13 |
| 3 | 0.18 - 0.23 | 0.06 - 0.09 | 0.14 - 0.15 |
| 4 | 0.24 - 0.28 | 0.10 - 0.13 | 0.16 - 0.16 |
| 5 | 0.29 - 0.30 | 0.14 - 0.15 | 0.17 - 0.18 |
| 6 | 0.31 - 0.33 | 0.16 - 0.17 | 0.19 - 0.19 |
| 7 | 0.34 - 0.35 | 0.18 - 0.19 | 0.20 - 0.20 |
| 8 | 0.36 - 0.38 | 0.20 - 0.22 | 0.21 - 0.22 |
| 9 | 0.39 - 0.50 | 0.23 - 0.36 | 0.23 - 0.32 |
Table 4: NDVI values of Ikwerre LGA for the year 1988, 2003 and 2018.

Figure 7: NDVI of Ikwerre LGA for 1988.

Figure 8: NDVI of Ikwerre LGA for 2003.

Figure 9: NDVI of Ikwerre LGA for 2018.
The nature of the land use/land cover in the present study is in corroboration with Kaul and Sopan, where they observed an increment in the agriculture area (including harvested area) from 6518.98 km2 in March, 2007 to 6991.94 km2 in November, 2007 [13]. This is also in line with the findings of Hassan et al. who reported an increase in agriculture area from 103.36 km2 (11.49%) in 1992 to 290 km2 (32.23%) in 2012 [12]. The built up areas occupied 3.23% (21.69 km2) of the total land area in 1988, but there was an increment of the built up area in 2003 and 2018. This class increased to 5.52% (37.03 km2) in 2003 and 10.57% (70.87 km2) in 2018. This is in accordance with the work of Mallupatu and Reddy, where they reported that the built up area comprising of human habitation developed for non-agricultural uses like building, transport and communication, largely broadened from 5.91 km2 in 1976 to 18.34 km2 in 2003 [13]. Hassan et al. also reported a significant increase in built up area which had a major increment from 162.81 km2 (1992) to 510.39 km2 (2012) [12]. The area covered by the water body increased with the year. It covered 0.23% (1.51 km2) of the total land area in 1988 and increased to 0.30% (2.02 km2) and 0.68% (4.57 km2) in 2003 and 2018 respectively while the bare surface class faced a reduction from 24.63 km2 (1988) to 16.60 km2 (2003) but increased to 20.39 km2 in 2018. This is in corroboration with the findings of Kaul and Sopan (2012) and Hassan et al. where they recorded an increase in water body area and a reduction in bare surface area [12]. Mallupatu and Reddy, recorded an increase in bare surface area [13]. The NDVI analysis in the study area informed that there were more loss of vegetation in the southern part and this may be attributed to the increase in the human activities like construction, agriculture and oil exploration. This might have even affected other environmental attributes like temperature and rainfall of the area. The findings of Hao et al. revealed a positive relationship between NDVI and temperature whereby it was reported that a higher temperature led to higher NDVI value of vegetation [15]. However, Pei et al. and Kalisa et al. reported a negatively significant correlation between NDVI and temperature within the months of June and August [16,17].
Conclusions and Recommendations
The study concluded that the vegetation dynamics in Ikwerre Local Government Area of Rivers State, Nigeria over the past 40 years have been well explored and reduced over time. Therefore, the study recommended that all activities that contribute to unnecessary vegetation removal such as illegal crude oil refining, bush burning, and deforestation etc. should be discouraged and more periodic study of this should be carried out steadily in the study area and the entire Rivers State.
Acknowledgement
We sincerely thank the Nigerian Government through the TETFUND Organisation for the funding provided for this research.
References
- Ochege FU, Okpala-Okaka C. Remote sensing of vegetation cover changes in the humid tropical rainforests of Southeastern Nigeria (1984-2014). J Cogent Geosci. 2017, 3(1).
- Adepoju K, Adelabu S, Fashae O. Vegetation response to recent trends in climate and land use dynamics in a typical humid and dry tropical region under global change. Adv Meteorol. 2019.
- Snyder PK. Examining vegetation and climate interactions: a comparative study of different vegetation types and their impacts on atmospheric energetics and dynamics at the regional and global scales. A PhD dissertation submitted in fulfilment of the requirements for the degree of Atmospheric and Oceanic Sciences at the University of Wisconsin-Madison. 2004.
- Yan L, He R, Kašanin-Grubin M, Luo G, Peng H, et al. The dynamic change of vegetation covers and associated driving forces in nanxiong basin, China. Sustainability. 2017, 9(3):443.
- Butt, A., Shabbir, R., Ahmad, S. S., Aziz, N. (2015). Land use change mapping and analysis using Remote Sensing and GIS: A case study of Simly watershed, Islamabad, Pakistan. Egypt J Remote Sens Space Sci. 2015, 18:251-259.
- Olorunfemi IE, Fasinmirin JT, Olufayo AA, Komolafe AA. GIS and remote sensing - based analysis of the impacts of land use/land cover change (LULCC) on the environmental sustainability of Ekiti-State, South-western Nigeria. Environ Dev Sustain. 2018, 20(4).
- Shalaby A, Tateishi R. Remote sensing and GIS for mapping and monitoring land cover and land-use changes in the Northwestern coastal zone of Egypt. Appl Geogr. 2007, 27(1), 28-41.
- Kantakumar LN, Neelamsetti P. Multi-temporal land use classification using hybrid approach. The Egypt J Remote Sens Space Sci. 2015, 18:289-295.
- Quaye-Ballard JA, Okrah TM, Andam-Akorful SA, Awotwi, A., Osei-Wusu W, et al. Assessment of vegetation dynamics in Upper East Region of Ghana based on wavelet multi-resolution analysis. Model Earth Syst Environ. 2020.
- Ogashawara I, Bastos VSB. A quantitative approach for analyzing the relationship between urban heat islands and land cover. Remote Sens. 2012, 4:3596-3618.
- Bagherzadeh A, Hoseini AV, Totmaj LH. The effects of climate change on Normalised Difference Vegetation Index (NDVI) in the Northeast of Iran. Model Earth Syst Environ. 2020.
- Hassan Z, Shabbir R, Ahmad SS, Malik AH, Aziz N, et al. Dynamics of land use and land cover change (LULCC) using geospatial techniques: a case study of Islamabad, Pakistan. Springerplus. 2016, 5:1-11.
- Kaul HA, Sopan I. Land use Land cover classification and change detection using high resolution temporal satellite data. J Environ. 2012, 1(4):146-152.
- Mallupatu PK, Reddy JRS. Analysis of Land use/Land cover changes using remote sensing data and GIS at an urban area, Tirupati, India. Sci World J. 2013, 1-6.
- Hao F, Zhang Y, Ouyang W, Skidmore AK, Toxopeus AG. Vegetation NDVI linked to temperature and precipitation in the upper catchments of Yellow river. Environ Model Assess. 2012, 17:389-398.
- Pei Z, Fang S, Yang W, Wang L, Wu M, et al. The relationship between NDVI and climatic factors at different monthly time scales: A case study of grasslands in Inner Mongolia, China (1982-2015). Sustainability. 2019, 11:1-7.
- Kalisa W, Igbawua T, Henchiri M, Ali S, Zhang S, et al. Assessment of climate impact on vegetation dynamics over East Africa from 1982 to 2015. Sci Rep. 2019, 9:1-20.

Open Access Journals
- Aquaculture & Veterinary Science
- Chemistry & Chemical Sciences
- Clinical Sciences
- Engineering
- General Science
- Genetics & Molecular Biology
- Health Care & Nursing
- Immunology & Microbiology
- Materials Science
- Mathematics & Physics
- Medical Sciences
- Neurology & Psychiatry
- Oncology & Cancer Science
- Pharmaceutical Sciences