Simulation in Gas Processing.
Nourredin Ben tahar *
Department of Physical, Faculty of Science, M hamed Bougara University Boumerdes Avenue de Independence, Algeria
*Corresponding author: Taha NB, Department of Epidemiology & Public Health, Sindh Agriculture University, Sindh, Pakistan; Tel No: 3362466561 ; E-Mail: nbentahardz@yahoo.fr
Received date: July 28, 2020; Accepted date: August 18, 2021; Published date: August 28, 2021
Citation: Taha NB (2020) Simulation in Gas Processing. Environ Toxicol Stud J Vol.5 No.4.
Abstract
In recent years, new energy has managed to work their way off of oil and natural gas; it is liquified petroleum gas (LPG). With their advantages of clean, transportable energy, LPG managed to penetrate sectors as diverse as residential petrochemicals, agriculture, industry and automotive (LPG) [1], Purvin & Gertz etimates that the global market will grow about 3.1% per year [2]. LPG occupies a place of great importance in the marketibg strategy of hydrocarbons Sonatrach. However the evolution experienced by the energy sector, now offers better marketing oppurtunities.
Introduction
In recent years, new energy has managed to work their way off of oil and natural gas; it is liquefied petroleum gas (LPG). With their advantages of clean, transportable energy, LPG managed to penetrate sectors as diverse as residential, petrochemicals, agriculture, industry and automotive (LPG) [1], Purvin & Gertz estimates that the global market will grow about 3.1% per year [2]. LPG occupies a place of great importance in the marketing strategy of hydrocarbons Sonatrach. However the evolution experienced by the energy sector, now offers better marketing opportunities, on the other hand, the production of LPG must meet the marketing standards, and that is why we must optimize the operating parameters in the fractionation units thereof. Nowadays, the simulation and optimization of chemical processes require precise knowledge of the equilibrium properties of the blends over wide ranges of temperatures, pressures and compositions, these phase equilibria can be measured by various methods. The calculations balanced liquid - vapor are very often produced using state of cubic equations. When these equations of state are applied to mixtures, molecular interactions are taken into account by a binary interaction coefficient, called kij, the choice is very tricky, even for simple mixtures [3], these methods represent models Thermodynamic who experienced progressive development since their appearance.
Modeling and simulation of these operations using well chosen thermodynamic models allow to achieve a better use of energy, increased productivity and lower operating costs, much work has been done in this area This has led to the development of several simulation algorithms, these differ depending on how to manage the descriptive equations of the column. The simulators are used either at the production units or design for verifying operation of the production process and to optimize the operating conditions for controlling the quality of final products.
The objective of this work is to:
1- Studying the influence of change of the load on the operating conditions and the quality of the final products.
2. Simulate the fractionation unit using a simulator HYSYS v7.2 to remove the thermodynamic model that represents well the nature of our office and the convergence algorithm from the simulation of case then these design latter will be used to perform the simulation of the present case an analysis of the operating parameters and the quality of the final product, the comparison between the two cases we were able to detect anomalies.
3- A simulation of the present case was effected by optimizing the process parameters in order to contribute to improving the quantity and quality of the end products satisfy the required commercial standards.
Overview
The name "Liquefied Petroleum Gas" is reserved exclusively for Propane and Butane, as they are the only ones being gaseous at room temperature and pressure (1.013 bar and 15 ° C) and let liquefied under low pressure (respectively 7.5 and 1.5 bar).
This, has the advantage of storing a large amount of energy in a small volume, which can be transported more easily than non-condensable gas (methane, ethane) that require very high pressures, and market easily , in steel cylinders, it is gasified at the time of use.
The use of LPG presents advantages with respect to diesel fuel to reduce:
- 50% of nitrogen oxide emissions.
- 50% those of carbon monoxide.
- 90% of those hydrocarbons and particles.
It was in 1912 that was experienced the first domestic installation of LPG. In the same year the automobile LPG carburetion took his first steps. The pre-development of this invention, however, took a decade. Oil companies are becoming interested in the LPG and marketing in 1927, The pulse is then given and in 1930,
20 years after their discovery, consumption of LPG in the US was 32 200 tonnes.
In Algeria, following a phase of study and experimentation started in 1977, the decision to introduce LPG fuel "SIRGHAZ" intervened in 1983 with the adoption of the bi and the implementation of regulations related to conditions of use and distribution of LPG / C [7].
Gpl Features
In general, the physicochemical feature of LPG (distillation curve, vapor pressure, specific weight, calorific value, performance in engines etc.) depends on their content of various hydrocarbons [9].
Calorific power
The calorific value of LPG is substantially equal to that of gasoline, when expressed in kilocalories per kilogram of fuel, but these values will be very different if expressed in kilocalories per liter of liquid fuel at 15 ° C (see Table I-3.1), this diversity comes from the difference in densities between LPG and gasoline, on average, the density at 15 ° C of a LPG is 0.555 Kg / l and that the essence of 0.730Kg / liter, an engine fueled with gasoline develops a greater power of 10 to 12%.
The increase in the overall yield of LPG compared to petrol can be explained by better combustion due to a greater homogeneity of the gas / air mixture.
| Calorific Power | Gasoline | LPG Calorific Superior (Kcal / kg) |
|---|---|---|
| Calorific Bottom (Kcal / kg) | 10500 | 11000 |
| Gross Calorific Value (Kcal / liter) | 8200 | 6480 |
| Calorific Bottom (Kcal / liter) | 7600 | 6050 |
Table1: comparing calorific value between LPG and gasoline.
One liter of LPG has an energy value of 22.5% less than that contained in one liter of gasoline and a liter of gas has an energy value 29% greater than that contained in one liter of LPG.
LPG mixture should meet the following specifications:
* Less than 50% propane and 19% butane
* Vapor pressure between 7.5 and 11.5 bar at 50 ° C
| Propane Iso-butane n-Butane |
| Chemical formula C3H8 iC4H10 nC4H10 |
| Vapor pressure at 10 ° C (kg / cm2) 6.2 1.3 1.5 |
| Boiling was 760mm Hg (° C) -42 -11.7 -0.5 |
| Liquid Density at 15 °C 0.51 0.56 0.58 |
| Liters of gas obtained from a liter of liquid 272.7 229.3 237.8 |
| Vapor Density 15 °C 1.86 2.45 2.45 |
| Gross calorific value (Kcal / kg) 11980 11828 11586 |
| Auto-ignition temperature °C 480 480 420 |
| Kg combustion air per kg of gas 15.8 15.6 15.6 |
| Octane number 96 97 89 |
| Explosive Limit %v 2.2- 9.4 1.9 8.5 |
|  TVR at -20 °C 2.6 0.6 0.5 |
| TVR at 0 ° C 5 1.7 1.1 |
| TVR to + 20 ° C 9 2.3 2.2 |
| TVR to +40 ° C 14.5 5.7 4 |
| Â |
Table2: The characteristics of LPG components [12,13].
Mathematical modeling of multistage vapor liquid separation columns
FigureII.4.1 shows the general diagram of a distillation column having N theoretical plates, condenser whatever its type (partial or total) is the stage 1 and the reboiler stage n ° N. L Room # 2 is said headland and the N-1 stage is called the bottom plate.
J each tray is fed by a steam flow rate Vj 1 + Lj-1 was a liquid flow from the two adjacent plates respectively j + 1 and j-1. Also, leave the steam tray j Vj flow and another fluid Lj respectively supply the two adjacent plates j-1 and j + 1. Each tray can be defined FVJ steam supply and a liquid diet F_j L ^, Uj liquid extraction, steam Wj and racking loss or heat gain Qj (see Figure II-4.2).

Figure II-4.1 General Scheme of a distillation column.

Figure II-4.2: General scheme of a balance plate
II-4.1 Formulation of the model equations
a) Model Assumptions
On each plate considering the following equilibrium
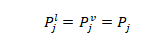
1- Mechanical equilibrium: the pressure of the vapor phase is equal to the pressure of the liquid phase
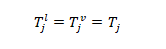
2- Thermal equilibrium: the temperature of the liquid phase is equal to the vapor the temperature
3- Thermodynamic Balance: Equal Fugacities in each phase for each constituent

It also makes no assumption of the chemical reactions and that each of the vapor and liquid phases are thoroughly stirred.
b) The model equations
At each balance plate is associated the following four equations:
- Partial material balance.
- Energy balance.
- Balance relations.
- Summation Equation.
These four equations are known collectively MESH [23]. In its resolution, the model can be formulated in two ways depending on whether one uses the mole fractions or partial flows.
The model of the column is comprised of a large number of non-linear algebraic equations. Mathematics offers us many possibilities to solve this system of equations [20,21]. These numerical methods we quote:
- Substitution and elimination.
- Direct methods (without calculating partial derivatives).
- The sequential approach.
- Simultaneous approach.
The first two approaches are eliminated because they require special manipulation of equations that are impossible to perform on the MESH model, against, the last two are retained. Sequential approach is to decouple the equations system subsystems that are fixed sequentially in an iterative procedure, the simultaneous corrections approach is to solve all the equations of the system simultaneously (see Figure II-4.1.1), we present these two mathematical approaches applied to solving the system of equations of the model MESH

Figure II-4.1:1 the organizational approaches of solving the mathematical model of multi-layered liquid-vapor separation columns.
Algorithm II-5 Inside out Inside out the algorithm is the basis of the best professional simulators of industrial processes. This is due to their robustness and their ability to solve a variety of problems. In addition, they offer greater flexibility viewpoint specification for both process parameters for product properties.
The methods of sequential approaches used for solving equations MESH, temperatures, flow rates and overall vapor and liquid compositions as iteration variables. These same variables are used for calculating the coefficients of balance and enthalpy vapor and liquid from rigorous thermodynamic models
The peculiarity of the "Inside-Out" algorithm, is to use the complex thermodynamic models to generate parameters simplest thermodynamic models. These parameters specific to each tray become variables of the outer loop (Outside loop). The inner loop (Inside loop) is then to solve the equations MESH by variations of methods "Bubble Point", "Sum Rate" or "2N-Newton". As the equilibrium coefficients and enthalpies are calculated using simple models, the inner loop is thus very stable to a wide variety of mixtures of the fact that it is slightly affected by the non-ideality of the system [4].
At each step of the outer loop, the parameters simplified models are updated in
using the iteration variable (the temperature and the vapor and liquid compositions of each
tray) calculated by the inner loop. [4]
This part is devoted to the analysis of the characteristics of LPG and condensate and the operating parameters of the fractionation unit; the unit consists of two sections, a deethanizer section and a debutanizer section (see Figure III-1) cis below.

Figure III.1: separation process scheme.
III-2. Load analysis that powers the fractionation unit
Chromatographic analysis of the charge and the products of the two sections was performed in the laboratory of the unity of Guellala, the results with the case of the design data are summarized in the following table
| The deethanizer feedstock (206) the debutaniser feedstock (123) |
| Composition Design Case Current cases design case Current Cases |
| H2O 0.0000 0.0000 0.0000 0.0000 |
| H2 0.2017 0.2000 0.0000 0.0000 |
| CO2 0.2901 0.3000 0.0001 0.0001 |
| CH4 13.9070 13,900 0.0002 0.0000 |
| C2H6 24.9899 25,000 0.9986 1.0000 |
| C3H8 34.6308 34,600 23.0654 23,100 |
| iC4H10 4.7344 4.3000 5.9045 6.3000 |
| nC4H10 14.5649 15,000 23.7380 23,400 |
| iC5H12 2.1510 2.0000 7.5056 5.6000 |
| nC5H12 3.1719 3.3000 14.0693 16,000 |
| nC6H14 1.1616 0.7000 15.2704 15,300 |
| nC7H16 0.1905 0.7000 8.3781 9.3000 |
| nC8h18 0.0063 0.0000 1.0698 |
| Flow (kg mol / hr) 683.2617 104.03 277.9 55 |
| Temperature (°C) 23.00 27.00 118.57 123 |
| Pressure (Bar) 26.39 26.00 16.34 14.5 |
Interpretation
The filler composition which feeds the deethanizer section is stable even for the load which feeds the debutanizer section from the stabilization of section C-401. The change is very clear regarding the reduction of feedstock flow rates for either section or deethanization debutanization it represents a ratio of (0.40) to (0.52), almost half the design load cases, which implies a variation of the operating parameters.
This variation is mainly due to the instability of the composition of the raw feeding the plant Guellala, the following Table III-2.2 represents the characteristics of the current end products LPG and condensate compared to the case design.
| LPG Condensate |
| Â |
| Composition Case Design (405) Current Cases (405) Case Design (410) Current Cases (410) |
| CH4 0.0000 0,000 0.0000 0,000 |
| C2H6 2.3552 0,330 0.0000 0,000 |
| C3H8 59.7564 65,200 0.0002 0,000 |
| iC4H10 8.9105 9,260 0.0225 0,080 |
| nC4H10 28.5765 25,210 0.9005 19,870 |
| iC5H12 0.3002 0,000 22.8212 15.70 |
| nC5H12 0.1011 0,000 38.5995 32,670 |
| nC6H14 0.0001 0,000 25.6333 18,840 |
| nC7H16 0.0000 0,000 10.7793 12,870 |
| nC8H18 0.0000 0,000 1.2435 0,000 |
| Density PM 49.13 51.94 79.16 75.60 |
| TVR 37.8°C 123.5psi 125.1psi 10.25 psi 18.93 psi |
Interpretation
From the table there is a convergence on LPG values design case based on the current case by nC4 against a condensate content is observed is very strong in the present case which involves a very high relative to the TVR case design and in relation to trading standards that must be lower â?¤ 10 psi for the transport and storage of the condensate.
III-3.Analyse the operating parameters of the fractionation unit
The operating parameters were collected during sample collection products; Table III-3.1 shows the following current operating parameters and event design.
| Facilities deethanizer debutanizer |
| Design Case current Case design case current case |
| Supply temperature ° C 23 27 (123/309) (123/309) |
| Bottom temperature°C 87.6 91.31 156.6 145.1 |
| Head temperature°C, -5.6 68.4 -6.0 64.32 |
| Condenser temperature, ° C -18.1 -19.3 52.4 53.4 |
| Head pressure, bars 24.4 23.6 15 13.8 |
Interpretation
From Table (III-3.1) there is a convergence between the process parameters and design of the case of the current cases of deethanizer, by against the temperature at the bottom of the debutanizer column in the design of upper cases is 56.6C by compared the current case 145.1C, and the pressure at the bottom of the column is decreased slightly compared to the design of cases, the instability of the composition of the charge has led to a change in the technological parameters of the entire installation.
III-4. Issue
The separation unit of liquefied gas (LPG) has as main objective to separate in a first column (deethanizer) the fuel gas from a feed from the stabilization unit, the bottom of the column used as a first load and a second load comes from the stabilization column to supply the debutanizer, LPG will be separated at the top, and gasoline C5 + basically, in recent years we found that the levels of ethane C2 and C5 are very low LPG this which decreases the quality of LPG, on top of that a very high content iC4 and nC4 in the condensate which increases TVR to 18.93 psi instead of 10 psi to ensure the conditions of transport and storage.
The objective of this study was to optimize the temperatures and pressures and the reflux and reboil rates necessary to ensure the quality of commercial products of our simulation will be structured as follows:
1-A design case of simulation so that it can determine the thermodynamic model and the simulation algorithm which represents the more accurate modeling of our simulation case, taking into account any manufacturer design data (Mitsubishi Heavy Industries).
2-A simulation of the present case to establish a detailed study on the balance sheets of materials and energy technologies to identify parameters that affect the quality of commercial products (LPG, Condensate).
3-An optimization of these process parameters in order to achieve products that undergo the required commercial standards.
Case Design and Simulation of the Current Case of the fractionating unit
VI-1 Case of design simulation unit deethanization
VI-1.1 simulation diagram of the studied process

Figure VI-1.1: simulation diagram of the unit deethanization
VI-1.2 the characteristics of the load
The simulation of the design case is based on the introduction of the nature of the load (the composition), the following table summarizes these data.
| Composition | Molar Fraction | Composition | Molar Fraction | Composition | Molar | Composition | Molar Fraction |
|---|---|---|---|---|---|---|---|
| Â | Â | Â | Â | Â | Fraction | Â | Â |
| N2 | 0.002 | C2 | 0.2499 | nC4 | 0.1456 | nC6 | 0.0116 |
| CO2 | 0.0029 | C3 | 0.3463 | iC5 | 0.0215 | nC7 | 0.0019 |
| C1 | 0.1391 | iC4 | 0.0473 | nC5 | 0.0317 | nC8 | 0.0001 |
Table VI-1.2: The composition of the feed (206) which feeds the deethanizer
VI-1.3 Introduction thermodynamic models
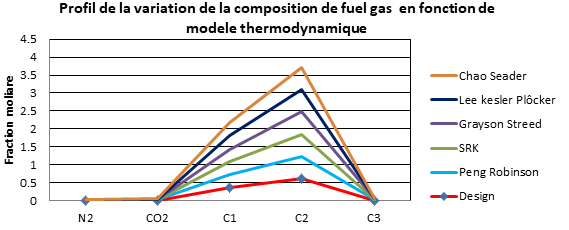
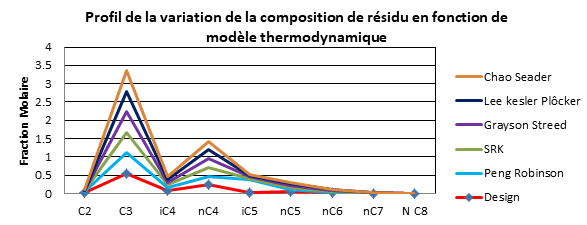
To perform the simulation of the fractionation unit the vas thermodynamic models are used, the HYSYS simulator contains a rich database such as; the state equations and empirical and semi empirical correlations in our study was based on thermodynamic models that represent well the nature of our load, these models are the most used for hydrocarbon systems; Peng Robinson, Soave Redlich kwong, Lee-kesler- Plocker Chao Seader, Grayson Streed.
To find the thermodynamic model used by the manufacturer in the simulation of the design case, we simulated the fractionation unit with these deferential thermodynamic models
Simulation algorithm
the HYSYS simulator resolution algorithm chooses the suitable resolution from the six existing algorithms. We preferred HYSIM Inside Out which is a resolution method generally proposed to solve most problems.
the HYSYS simulator chose the method HYSIM Inside out who gave us a quick convergence and good clarification results.
operating parameters of the deethanizer / Case design:
The simulation was performed using the five mentioned thermodynamic models and the introduction of the process parameters shown in Table VIII-1.5 follows:
| Number of Plates | 38 |
| The level of supply | 14 |
| The reflux ratio 1.28 | 1.28 |
| Â | Â |
| The distillate flow | 262.6 kgmol/hr |
| The pressure in the reflux drum | 24.4 bar |
| The pressure of the residue | 25.24bar |
VI-1.6 the simulation results of the case of deethanizer design
To simulate the deethanizer was an equation of 2 degrees of freedom, so you must specify two data, in our case we specified the design of reflux ratio which is equal to 1.285, and a bottom temperature which is equal to 89.64C the simulation of the column has converged and the simulation results are shown in Table VI-1.6.1 following:
| Résidu 308 | Design | Peng Robinson | SRK | Grayson Streed | Lee kesler Plôcker | Chao Seader |
| Temperature bottom | 89.64 | 89.6 | 89.65 | 89.64 | 89.65 | 89.64 |
| Pressure | 25.24 | 25.24 | 25.24 | 25.24 | 25.24 | 25.24 |
| Flow | 420.65 | 421.6 | 420.4 | 410.3 | 422.8 | 420.8 |
| C2 | 0.0217 | 0.0237 | 0.0204 | 0.0001 | 0.0261 | 0.0174 |
| C3 | 0.5562 | 0.5552 | 0.5573 | 0.5673 | 0.554 | 0.5608 |
| iC4 | 0.0769 | 0.0767 | 0.0769 | 0.0788 | 0.0765 | 0.0769 |
| nC4 | 0.2365 | 0.2361 | 0.2367 | 0.2425 | 0.2354 | 0.2365 |
| iC5 | 0.0349 | 0.349 | 0.035 | 0.0358 | 0.0348 | 0.0349 |
| nC5 | 0.0515 | 0.0514 | 0.0516 | 0.0528 | 0.0513 | 0.0515 |
| nC6 | 0.0188 | 0.0188 | 0.0189 | 0.0193 | 0.0188 | 0.0189 |
| nC7 | 0.0031 | 0.0031 | 0.0031 | 0.0032 | 0.0031 | 0.0031 |
| nC8 | 0.0001 | 0.0001 | 0.0001 | 0.0001 | 0.0001 | 0.0001 |
Interpretation
It was observed clearly that the simulation results using the Peng Robinson model converge to the results of the design cases (manufacturer's data).
General Conclusion
This work is devoted to the optimization of technological parameters of the gas treatment unit Haoud Berkaoui to improve the current commercial specifications such as final products (LPG and condensate).
Knowledge of physico-chemical data is essential in process engineering in particular, simulation and optimization and many separation processes such as distillation, we gave an overview on the state equations for use in the chemical industry, especially the cubic state equations which are based on pure component parameters (critical coordinates and the acentric factor.
The equation of state of Peng Robinson is adapted to drive a satisfactory representation of vapor-liquid equilibria in the simulation of light hydrocarbons.
In this context the thermodynamic model is able to represent realistically the vapor-liquid equilibria of gas treatment systems is very important in modeling of distillation columns, different simulation algorithms have been developed since their appearance in the 19th centuries, in our study we used a type of Inside-Out algorithm showed good accuracy in the simulation results with a fast convergence rate, this algorithm is used in almost all industrial simulators today ( AspenTech HYSYS, PROII, DESIGN II ...).
Analysis of the load that powers the fractionation unit in case of design and the present case has indicated a sharp decline, it now reaches half, the objective of this work is to study the effect of load change on the operating parameters and commercial specifications of the final products and production performance.
The simulation of the fractionation unit performed by the simulator HYSYS ASPENTECH with the design data, enabled us to establish the model of Peng Robinson representing unity, and analysis of various simulation results of the current case and compare them with the case design has allowed us to identify points in malfunction of the unit debutanizer, and their influence on the process.
Finally, the optimized simulation results using the parameters, allow to have the required commercial specifications while reducing the amount of energy exchanged at the cooling tower and the reboiler.
References
- Youcef ABCHI (2010) Perspective des exportations des GPL et place de Sonatrach sur le marche méditerranéen, revue de lâ??Algérien Petroleum Institute, Vol 04 N-01, p10 Janvier.
- Ken Otto (2009) LP Gas exceptional energy, Global LPG Market Outlook p12, September.
- Stephane Vitu, Développement dâ??une méthode de contributions de groupes pour le calcul du coefficient dâ??interaction binaire de lâ??équation dâ??état de Peng-Robinson et mesures dâ??équilibres liquide (2007) vapeur de systèmes contenant du CO2, p05. November.
- B. Ait Aissa, Contribution à Lâ??étude des Algorithmes de Simulation des Colonnes à Plateaux de Séparation Liquide Vapeur avec Implémentation de Modèles Thermodynamique Rigoureux p (1999)Manuel dâ??utilisation Prosim Plus Simulateur des procédés industriels continues, p5.
- Comité Français Butane Propane, GPL carburant historique, Site web www.cfbp.fr.
- Gaz de pétrole liquéfiés, site web www.naftal.dz
- Agence international de lâ??énergie (AIE/OCDE), division des statistiques de lâ??énergie (lâ??AIE transmettra les données à la commission économique pour lâ??Europe des nations Unies.
- NELSON(W.L )- Oil and gas journal p129 sep1955.
- Comité français du butane et du propane, Les gaz Butane Propane Website http://www.cfbp.fr
- Association européenne des gaz de pétrole liquéfies, site web : www.aegpl.eu.
- Perrot, Pierre (1998), A to Z of Thermodynamics. Oxford University Press
- Soave G, â??â?? Equilibrium constants from a modified Redlich kwong equation of sateâ??â??C.E.S 1972
- Lee.B.I and M.G. kesler â??â?? A generalized thermodynamic correction based on three-parameter corresponding dataâ??â?? AIChe, J,1975.
- Plöcker .U ; H ; Knapp and J. Prausnitz â??â?? Calculation of High pressure vapor- liquid equilibria from a corresponding states corrections with emphasis on asymmetric mixturesâ??â??
- Ind. Eng Chem., Process Dec Dev 1978.
- Plöcker U, H Knapp â??â??Save time in computing densityâ??â?? hydrocarbon Processing.1976.
- Peng Y.D, Robinson D.B,A â??â??new two constant equation of stateâ??â?? I.E.C fundam.1976.
- Aspen COMThermo, Reference Guide ASPEN Technology, pp 3-191 3-193, Edition 2007.
- James B. Riggs, An Introduction to Numerical Methods for Chemical Engineers, Texas
- Tech University Press, second edition, 1994
- Press, W.H., B.P. Flanery, S.A. Teukolsky, and W.T Vetterling, Numerical Recipes,

Open Access Journals
- Aquaculture & Veterinary Science
- Chemistry & Chemical Sciences
- Clinical Sciences
- Engineering
- General Science
- Genetics & Molecular Biology
- Health Care & Nursing
- Immunology & Microbiology
- Materials Science
- Mathematics & Physics
- Medical Sciences
- Neurology & Psychiatry
- Oncology & Cancer Science
- Pharmaceutical Sciences