Severe Slugging Control: Simulation of Real Case Study
Muhammad Ali Theyab*
Ministry of Higher Education and Scientific Research of Iraq, Iraq
- *Corresponding Author:
- Muhammad Ali Theyab
Ministry of Higher Education and Scientific Research of Iraq, Iraq
Tel: +447833846288
E-mail: theyabm@lsbu.ac.uk
Received date: December 27, 2017; Accepted date: March 22, 2018; Published date: March 27, 2018
Citation: Theyab MA (2018) Severe Slugging Control: Simulation of Real Case Study. J Environ Res Vol.2: No.1: 5.
Abstract
The current study shows slugging as one of the flow assurance issues and their effects on the hydrocarbon production rate and surface facilities. Slugging is a complex type of flow regime and unsteady in nature. A case of slugging at one of West Africa′s offshore production pipeline has been used to run the slugging simulation using OLGA software; and comparing the simulation results of this study with the simulation results of Burke and Kashou and the real case study.
Two modes of running OLGA have been studied; the steady state mode and the sensitivity mode, by simulate different control structures e.g., choke valve opening, and different parameters such as pressure, temperature, and flow rate in OLGA version 7 tools, and by reducing the pipeline diameter, and changing pipeline roughness; and study these effects on a particular output (e.g. flow rate, slugging volume, etc.).
The results of the simulation shows an increase in liquid hold up production about 55.74% in the outlet of the riser compare with the liquid hold up production of the case study.
Keywords
OLGA; Pressure; Temperature; Flow rate
Abbreviations
TM: Fluid Temperature (°C); PT: Pressure (Bara); HOL: Liquid Hold Up Fraction; QG: Gas Volume Flow (m3/d); QLT: Total Liquid Volume Flow (m3/d); UG: Gas Velocity (m/s); UL: Average Liquid Film Velocity (m/s); USG: Superficial Velocity Gas (m/s); USL: Superficial Velocity Total Liquid Film (m/s)
Introduction
Problem identification
The main reasons that affect the hydrocarbon production rate and surface facilities (e.g. corrosion, blockages) are the solid formation from precipitates and flow instability (slugging).
With multiphase flow regime there is flow instability, due to a series of gas pockets followed by continuous liquid. This flow causes pressure fluctuations that affect the receiving facilities causing flooding, and increase solids deposit and corrosion [1].
There are many similarities and differences (e.g. fluid composition and reservoir properties) between oil fields, so it is important to identify potential flow issues that could occur. These flow issues occur during, operation, maintenance and during the design stages of facilities.
The special problem associated with offshore operations poses new challenges in the systems. In an offshore environment the transient effects during start-up and shutdown of the production system become more pronounced.
Slug flow is one of the most common flow patterns. It is characterized by an unsteady due to its highly complex nature. The prediction of slug length, slug frequency and pressure drop by theoretical means is almost impossible, due to its impedance to oil and gas production operations [2].
Background
Flow assurance is defined as the ensuring successful and economical flow of hydrocarbon streams from the reservoir to the point of sale and it closely deals with the multiphase flow technology.
Flow Assurance development increased because of the traditional production approaches are unsuitable for deepwater production due to extreme distances, depths, low temperatures or economic constraints. In the early 1990s Petrobras was the first to use the term Flow Assurance in Portuguese as Garantia do Escoamento, meaning literally “Guarantee of Flow”, or Flow Assurance [3].
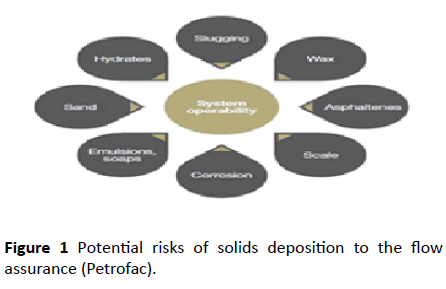
Flow assurance is extremely diverse, encompassing many discrete and specialized subjects and embraces all kinds of engineering disciplines. Besides network modeling and transient multiphase simulation, flow assurance involves handling many solid deposits, such as, gas hydrates, asphaltene, wax, scale, corrosion, sand, and (emulsions, and soaps) (Figure 1).
In recent years flow assurance has been considered as the most critical task during deep water energy production due to high pressures and low temperature.
The financial loss of production interruption or asset damage due to a flow assurance mishap can be astronomical. What compounds the flow assurance task even further is that these solid deposits can interact with each other, and can cause blockage formation in pipelines and result in flow assurance failure [4].
Flow Assurance is applied during all stages of system selection, detailed design, surveillance, troubleshooting operation problems, increased recovery in late life, etc., to the petroleum flow path (well tubing, subsea equipment, flow lines, initial processing and export lines).
Slugging
In this session, the flow patterns presented show the three phase flow behaviour, and to show the formation of the instability flow patterns (slugging) in the pipes [5].
Slugging occurs in multiphase flow regimes, where flow in a section of pipe under the influence of gravity, liquid will settle at the bottom and gas will occupy the top half of the pipe.
These fluids will travel unevenly distributed in the pipeline either mostly liquid or gas, forming large plugs known as slugs.
Flow patterns
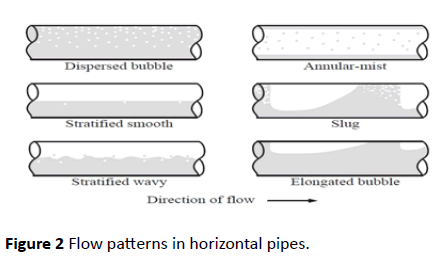
The flow patterns that exist in horizontal and nearhorizontal pipes are classified as ‘dispersed bubble flow’, ‘stratified flow’ (smooth and wavy), ‘annular-mist flow’, ‘slug flow’, and ‘elongated bubble flow’, as shown in Figure 2. At high liquid flow rates ‘dispersed bubble flow’ occurs. The liquid phase is the continuous phase and the gas phase is dispersed as discrete bubbles [6].
‘Stratified flow’ occurs when the flow rate is low. At higher gas flow rates, the interface between the liquid and gas becomes wavy; this flow regime is called stratified wavy. ‘Annular-mist flow’ occurs at higher gas flow rates [7].
The liquid phase flows as a thin film by the pipe wall forming an annulus form, and the gas phase flows through the centre of the pipe, which may contain entrained liquid droplets.
At relatively high flow rates, the slug flow regime occurs and exhibits a series of liquid slugs separated by gas pockets [8-10].
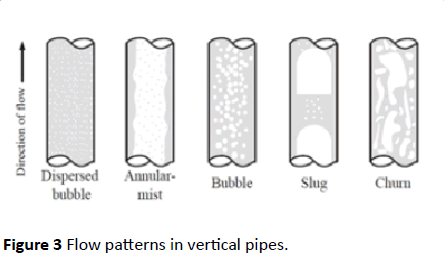
For vertical and sharply inclined pipes the flow patterns are classified as ‘dispersed bubble flow’, ‘annular-mist flow’, ‘bubble flow’, ‘slug flow’, and ‘churn flow’, as shown in Figure 3.
For vertical and sharply inclined pipes the flow patterns are classified as ‘dispersed bubble flow’, ‘annular-mist flow’, ‘bubble flow’, ‘slug flow’, and ‘churn flow’, as shown in Figure 3.
At low liquid flow rates, the ‘bubble flow’ occurs, where the liquid is the continuous phase and the gas phase exists as bubbles, moving upward in a zigzag motion. Slugging occurs in both horizontal and vertical pipelines when the flow rate is relatively high [11-14].
Methodology
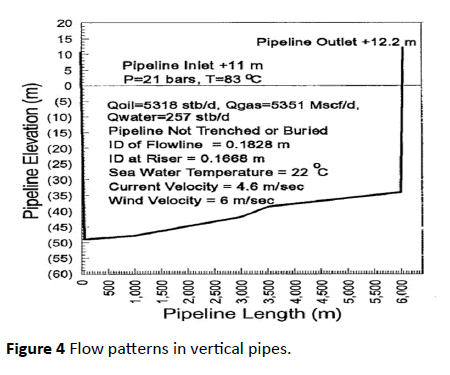
The purpose of simulating slugging using OLGA software is to be familiar with the simulation of multiphase fluid flow in pipes. A case study from the literature review of was chosen to run the simulation. After completing the training and running the case study and discuss the results; the author has the ability to perform sensibility of parameters such as (pressure, temperature, and flow rate, etc.) in the production of fluid [15]. A field data of 8'' diameter and 5973 m pipeline length from 11 m over the sea level, the down comer pipeline to 12.2 m over the sea level the outlet of the riser, of West Africa offshore (Burke and Kashou, 1995) has been used to build and simulate the slug flow model, using OLGA software [16]. To run the simulation, some of the parameters (pipeline type, and pipe wall roughness) were missing, so the author assumes hypothetical values. These materials were used commercial steel; pipe wall roughness (0.000045 m–0.00009 m) [17]. Details of the pipeline profile, internal diameter, surrounding conditions and pipeline outlet details are illustrated in Figure 4. The flow pipeline details, the gas flow rate, mass flow rate, etc. are shown in Table 1. All these data are required to build the basic case, and from this basic other modes are built. Input flow rates at pipeline inlet, fluid pressures and temperatures at pipeline inlet and outlet, and fluid PVT composition are shown in Table 2. With the new OLGA version, the obtained results of the production were higher than the results of Burke and Kashou as shown in Table 2. A steady state simulation is a strategy that was used to run the simulation at the properties constant with time. These properties are pressure, temperature, liquid hold up, flow regime, pipe wall roughness, and choke valve opening). Another used strategy was to run sensitivity analysis to establish the most sensitive parameters to reduce the slugging in the pipeline [18].
| Parameter | ||||||
|---|---|---|---|---|---|---|
| PVT Model | Black Oil | Pipelene Properties | ||||
| No. or Pipes | 6 | Pipe Sectio ns (/fl |
Pipe ro (m) |
Pipe Length (m) | Pipe Elevatio n Im) |
Overall U (W/m?.•C) |
| - | - | 2 10 20 s 26 2 |
0.1668 0.1828 0.1828 0.1828 0.1828 0.1668 |
2"'29.85 50,90,8•100 20•100 5•500 24•100.2•so 2"'23. 1 |
-59.7 1.2 6.0 3.2 4.6 46.2 |
26.100 1o•so 20•24 5"20 26•19 21 13 |
| Gas Flow Rate (mmscf/d) at standanl cooditions |
5.351 | - | ||||
| Oil Flow R•te (stb/d) at standud conditions |
S,318 | |||||
| Gas Flow Rate (mmcrtd) at oi- inlet T. P | 1.133 | |||||
| Oil Flow Rate (b/d) at oi- inlet T. P | S.709 | |||||
| Inlet Gas Mass Rate | 1.761 | Simulation time parameters | ||||
| Inlet Oil Mus Rote"fhiS) | 9.025 | Initial Time Step=0.01 seconds | ||||
| Inlet Temrature ra | 83.3 | Minimum time step=0.005 seconds | ||||
| Outlet Tc--raiure t°n | 23.9 | Maximum time step=0.5 seconds | ||||
| Inlet Pressure ""'-' | 20.68 | Sleadv state simulaiion time=3000 seconds | ||||
| Outlet Pressure <bars) | 13.3 | Stug tracking simulation time=3000 seconds | ||||
Table 1: OLGA simulation physical property parameters.
| Input flow rates at pipeline inlet | ||||||||||||||
|---|---|---|---|---|---|---|---|---|---|---|---|---|---|---|
| Pipeline | Oil | Gas | Water stb/d | Liquid | GOR | GLR | Water cut | Oil | ||||||
| Inlet | stb/d | Mscf/d | stb/d | scf/stbo | scf/stbl | % | Gravity | |||||||
| °API | ||||||||||||||
| Total | 5318 | 5351 | 257 | 5575 | 1006 | 960 | 4.61 | 31.9 | ||||||
| Note: The total flow entering the pipeline is commingled flow from 2 wells A-1 and A-2. Oil gravity for the mixture was calculated from volumetric averaging of the two combing streams | ||||||||||||||
| Fluid Pressures and Temperatures at Pipeline Inlet and Pipeline Outlet | ||||||||||||||
| Location I | Date | Pressure | Temperature | |||||||||||
| Psia | Bar | °F | °C | |||||||||||
| Pipeline inlet | Feb. 23-24.1991 | 295-305 | 20.3-21.0 | 182 | 83.3 | |||||||||
| Feb. 24-25,1991 | 295-315 | 20.3-21.7 | 182 | 83.3 | ||||||||||
| Pipeline Outlet | Feb. 24-26.1991 | 165-215 | 11.3-14.8 | 75 | 23.9 | |||||||||
| Fluid PVT Composition (Not Normalized) | ||||||||||||||
| Component | Cl | C2 | C3 | i-C4 | n-C4 | i-05 | n-05 | C6 | C7 | |||||
| Mole% | 45.88 | 6.64 | 4.72 | 1.2 | 2.13 | 1.21 | 1.12 | 2.03 | 2.98 | |||||
| Component | C8 | C9 | CIO | C11 | Cl2+ | CO2 | N2 | Total | - | |||||
| Mole% | 3.62 | 2.98 | 2.67 | 2.26 | 19.01 | 0.19 | 0.59 | 99.23 | - | |||||
Table 2: West Africa oil field data.
OLGA
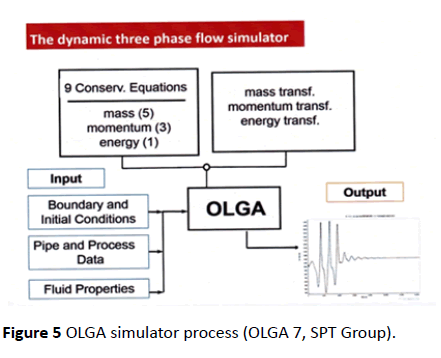
The simulation of multiphase fluid flow involves conservation equations such as mass, momentum, and energy; and it needs a numerical simulator to solve these equations [19,20].
So, OLGA software used to simulate the three phase fluid flow, and to simulate one of the flow patterns (slugging).
To construct an OLGA model, one needs to gather data, build the model and define simulation case, run simulations and view results in the form of graphs.
The following OLGA simulator process steps show the input, output and OLGA simulator processes as shown in Figure 5(OLGA 7, SPT Group).
Input: Input boundary and initial conditions, fluid data and pipe and process data.
• Add and define the pipeline materials and pipe.
• Add network component i.e. Nodes and Flow path.
• Define the properties for flow path; connect the flow path to the Nodes.
• Create flow path geometry for the pipeline using case study information.
• Add boundary & initial conditions for pipeline length.
Output: Define variables to be reported in the output file.
• Add the following trends and profile variables are to be saved for viewing after simulation has been run. Trend variables – PT (Pressure), TM (Temperature), QLT (Liquid flow rate), QG (Gas flow rate), USG (Superficial gas velocity),USLT (Superficial liquid velocity), ACCLIQ (Accumulated liquid flow), SURGELIQ (Surge volume) and Profile variables – HOL (Liquid holdup fraction), PT, TM, ID (Flow regime identification). For slug tracking, variable such as LSLEXP (Slug length), LSLEXP STAT (Slug density) and NSLUG (Number of slugs) key should be included.
Process: Calculations of variables along the pipeline.
• Specify the start time and end time of the simulation, 0hr and 2hr respectively.
• Verify simulation case for possible error before running.
• Run the simulation.
• Results can be viewed in the output window, (OLGA 7, SPT Group).
Results and Discussion
This part shows the results and the discussion of the steady state mode and the sensitivity mode simulation, under different flow rate (5, 10, and 15 kg/s). Where, the steady state mode was used the pressure, temperature, liquid hold up, mass flow and flow regime, at a constant time.
The sensitivity mode (slugging mitigation) was used choking the flow, gas lift; also, reducing the pipeline diameter, and changing pipeline roughness. Moreover, the steady state simulation comparison shows a preferable result for the current study comparing with, Burke and Kashou, and experimental results.
Steady state method
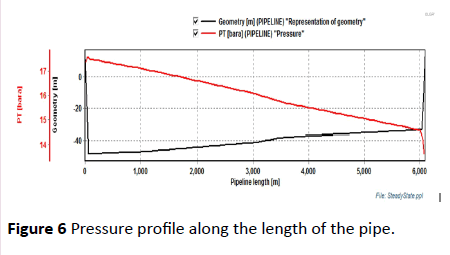
Pressure: At steady state mode the pipe outlet pressure was specified at 13.61 bar, the pressure at pipe inlet was specified at 17.4 bar increased to about 17.7 bar as shown in Figure 6 because of, the fluid flowed down the vertical length, this phenomenon is called pressure recovery, it occurs when the gas velocity down the vertical length slows down, converting the energy to static pressure (energy) which is recovered and added to the downstream static pressure [21].
Pressure losses occurred along uphill lengths and were transformed into energy to drive the fluid. Kinetic and potential energy of the system drove the fluid along the flow line overcoming gravitational and frictional forces between the fluid and walls and between the gas-liquid interfaces. The large pressure drop at the end of the profile along the riser is an exact demonstration of the system energy being transformed to frictional and gravitational forces to drive liquid volume at that location [22].
Temperature
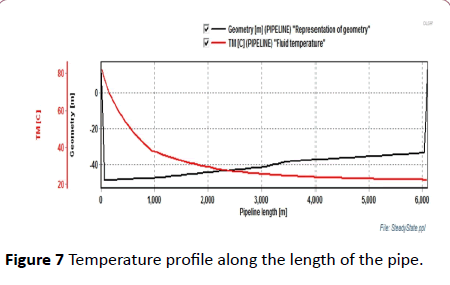
The inlet temperature was maintained at 82°C, the water temperature is 22°C. Ambient temperature (air) is assumed to be 26°C this surrounding the length of the pipe from the inlet point at 11 m over sea level, and the length of 12.2 m from sea level to outlet point. This temperature difference caused the heat transfer from the gas/liquid bulk to the surrounding. Temperature decreased along the pipeline because of the temperature difference causing transfer of heat to the surroundings (Figure 7).
Liquid holdup
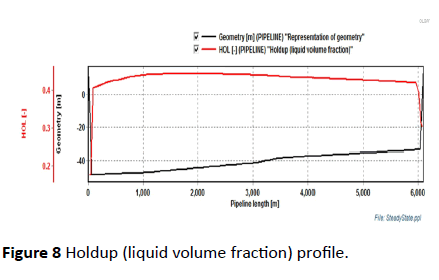
Liquid holdup (volume of liquid in a pipe/volume of the pipe) profile through the pipeline, showed the inlet holdup fraction 0.177 and at outlet about 0.31 and the maximum fraction around 0.45 as shown in Figure 8.
The locations coincided with pressure drop locations indicating a strong relationship. That pressure drops were related to the effect of gravity on the liquid phase in the uphill lengths and the frictional pressure drop moving the liquid. The liquid velocity remained fairly unchanged in the large diameter pipe increasing slippage and liquid holdup. Beggs and Brill showed the effect of inclination on liquid holdup and with 44% liquid holdup increase the chance for slugging to occur [23].
Flow regime
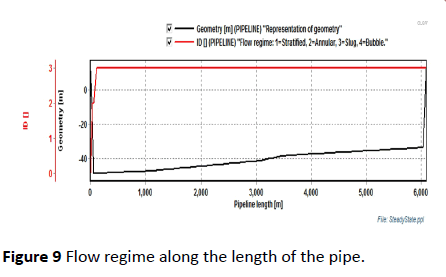
The flow regime was annular at the down corner pipeline until it reaches the seabed pipeline where transferred to the slug flow.
During the process investigation of this study, it was observed that when the gas (USG), and liquid (USL) superficial velocity, increased the liquid hold up (HOL) decreased.
OLGA show flow regime indicator code (ID) which represents four types of fluid flow, where the number represents the flow regime type. 1- Stratified wavy flow. 2- Annular flow. 3- Slug flow. And, 4- Bubble flow, as shown in Figure 9.
Slugging mitigation (sensitivity study)
• Sensitivity study is important to investigate the practical ways to mitigate or eliminate slugging throughout pipelines. Possible measures slugging includes:
• Operational changes such as choking the flow to operate outside slugging region and gas lift in the riser base to continuously lift liquid.
Design changes such as reducing the pipeline diameter, changing pipeline roughness and applying improved insulating material.
Pipeline diameter
The sensitivity analysis in OLGA simulation is very important to choose the suitable pipeline diameter that reduces slugging. In this study a range of standard pipe size diameter was investigated between (0.16 m–0.214 m) for the seabed flow pipeline. During run the sensitivity study by using a parametric study tool in OLGA, it was seen that the preferable pipeline diameter to reduce slugging is (0.1747 m).
For the down comer and riser pipeline were using a range of (0.1243 m–0.1627 m), then chosen (0.1243 m) as the preferable in results. Table 3 summarise the results of the outlet pipeline variables, where in the sensitivity study by reducing the diameter in the down comer, riser and the flow line, the slug reduced but the total liquid volume flow (QLT) is increased inside the pipe and the hold up (HOL) decreased slightly [24].
| Parameters | Pin bar | Pout bar | Tin °C | Tout °C | Dia m | Slug | HOL | QG m3/d | QLT m3/d | USG m/s | USL m/s |
|---|---|---|---|---|---|---|---|---|---|---|---|
| Case Study | - | - | - | - | 0.167 0.183 | - | - | - | - | - | - |
| Built Model | 17.4 | 13.61 | 82 | 22.51 | 0.167 0.183 | Yes | 0.3 | 4349 | 1044.7 | 2.3 | 0.6 |
| Sensitivity Study | 20.4 | 13.7 | 82.6 | 23.8 | 0.124 0.175 | Yes | 0.25 | 6072.7 | 1453.1 | 5.8 | 1.4 |
Table 3: West Africa Oil Field Data.
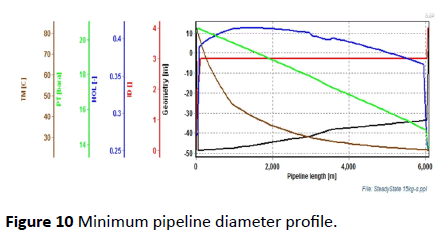
From Figure 10, it was observed that when decreasing the pipeline diameter in OLGA tool the slug decreased somewhat, and the flow regime (ID) during the riser transferred to kind 4 – bubble flow.
Pipe wall roughness
In this study, the pipe wall roughness was not indicated, so the author assumed the pipeline type commercial steel with the roughness of (0.00009 m). A sensitivity tests with pipe wall roughness were carried in line, the value of the roughness that inlet to the parametric study in OLGA in the range between (0.000045 m – 0.00009 m). The changes in wall roughness have no noticeable effect to the process variables. So for that reason the author chooses the high value to increase the possibility to reduce the slug, even slightly
Topside choke
A choke was used on the topside of the outlet pipe to investigate the effect of choke to the slug formation, and it is effect to the process variables. In this study, a sensitivity study was used the range of choke opening between (0.02 – 0.1243). The sensitivity study showed that the value increased production was 0.05. Table 4 summarizes the effect of choke to the outlet pipeline variables. It was observed by using OLGA that slugging problem reduced when reducing the topside choke valve opening. At the same time, the outline liquid hold up production decreased, which is slightly unfavorable.
| Topside Choke | Opening | Pout bar | Tout °C | Dia m | Slug | HOL | QG m3/d | QLT m3/d | USG m/s | USL m/s |
|---|---|---|---|---|---|---|---|---|---|---|
| Sensitivity Study | 0.05 | 13.55 | 21.55 | 0.124 0.175 | Yes | 0.25 | 2016.5 | 484.24 | 1.92 | 0.462 |
Table 4: Effect of topside choke opening to the outlet variables.
Gas lift (riser)
A range of gas lift amount (GTSOUR) between (0.2–1.4 kg/s) was used to study it is effect on the outlet variables of OLGA. From Figure 10, it was observed that at length 3533 m the flow regime start to change from flow type (3 – slug) to flow type (2 – annular). Then, at the length 3633 m the flow regime changed to flow type (1 – stratified).
At the riser beginning the flow changed to type (2 – annular) and then to type (3 – slug) again, as shown in Figure 10. Table 5 shows the effect of gas lift to the outlet variables. At this case gas lift unfavourable, due to huge reduction of the liquid holdup production at outlet pipe as shown in Figure 11.
| Gas Lift | GTSOUR Kg/s | Pout bar | Tout °C | Dia m | ID | HOL | QG m3/d | QLT m3/d | USG m/s | USL m/s |
|---|---|---|---|---|---|---|---|---|---|---|
| Sensitivity Study | 1.2 | 13.44 | 21.7 | 0.175 | 2313 | 0.07 | 10915 | 484.14 | 10.4 | 0.46 |
Table 5: Gas lifts effect on the outlet variables.
Steady state simulation comparison (Current study and Burke and Kashou, (1995) and the experimental results)
The steady state OLGA simulation results and the case study experimental conditions in terms of mass flow rates, pressure, temperature, holdup, and flow patterns are given in Table 6. In this study, the pipe wall roughness was chosen to be (0.00009 m) to increase the inlet pipeline pressure to achieve the experiment pressure. Table 6, shows the liquid holdup fraction calculation for Burke and Kashou, were 0.16 at the pipeline inlet 0.29 at the pipeline outlet/riser inlet, and 0.135 at the riser outlet. While, in current study the liquid hold up fraction was 0.177 at the pipeline inlet 0.3995 for the riser inlet and for the riser outlet was 0.305. The current study simulation shows that an increasing in liquid holdup occur about 9.6% at the pipeline inlet, 27.4% increase at riser inlet, and about 55.74% increase at riser outlet.
| Property | Experimental | Burke and Kashou, 1995) Simulation | Current Study Simulation | |
|---|---|---|---|---|
| Inlet Gas Mass Rate (kg/s) | 1.761 | 1.761 | 1.761 | |
| Inlet Oil Mass Rate (kg/s) | 9.025 | 9.025 | 9.025 | |
| Inlet Temperature (°C) | 83.3 | 83.3 | 82 | |
| Outlet Temperature (°C) | 23.9 | 23.9 | 22.24 | |
| Inlet Pressure (bars) | 20.7 | 20.1 | 17.4 | |
| Outlet Pressure (bars) | 13.3 | 13.3 | 13.61 | |
| Pipe Inlet | ______ | 0.16 | 0.177 | |
| Holdup | Bottom Riser | ______ | 0.29 | 0.3995 |
| Pipe Outlet | ______ | 0.135 | 0.305 | |
| Downcomer | Annular | Annular | Annular | |
| Flow Pattern | Flowline | Slug | Slug | Slug |
| Riser | Slug | Slug | Slug | |
Table 6: Steady state simulation comparison: current study, Burke and Kashou and the experiment conditions.
This as a result for pressure drop between the two studies, where at this study the pressure drop was 3.79 bars while at Burke and Kashou study the pressure drop was 6.8 bar, this drop describe the increasing in liquid holdup fraction at current study. These increasing in the liquid hold up production come from using the parameters that investigated in the sensitivity mode such as choke valve opening [25].
Conclusion
The unstable behaviour of two-phase flow in pipe systems is encountered frequently in oil production. Examples are the casing heading that occurs in oil wells working at low gas and oil flow rates, the annulus heading of some gas-lift wells, and severe slugging in pipeline/riser systems. Such situations correspond to large amplitude, Long-duration instabilities, which may reduce oil production and damage installations.
During this research, two modes of OLGA were used to eliminate of slugging represented by the sensitivity of change parameters such as pressure, temperature, liquid hold up, mass flow and flow regime at the steady state mode. Also, presented the sensitivity of operational changes such as choking the flow and gas lift; also, study the design changes such as reducing the pipeline diameter, changing pipeline roughness, at the sensitivity mode. The results of the simulation shows an increase in liquid hold up production about 55.74% in the outlet of the riser compare with the liquid hold up production of the case study.
These increasing in the liquid hold up production come from using the parameters that investigated in the sensitivity mode.
References
- Al-Yaari M (2011) Paraffin wax deposition: Mitigation & removal techniques, presented at the 2011 SPE professionals Technical Symposium held in Dhahran, Saudi-Arabia.
- Gideon AM (2013) Cold flow in long-distance subsea Pipelines, MSc Thesis, Norwegian University of Science and Technology.
- Adeyanju OA, Oyekunle LO (2013) Experimental study of wax deposition in a single phase sub-cooled oil pipelines, University of Lagos. The Nigeria Annual International Conference and Exhibition, Lagos, Nigeria.
- Burke NE, Kashou SF (1995) Slug sizing/slug volume prediction, state of the art review and simulation, Texaco Inc., OTC 7744, Offshore Technology Conference, Texas, USA.
- Botne KK (2012) Modelling wax thickness in single-phase turbulent flow, Norwegian University of Science and Technology, Department of Petroleum Engineering and Applied Geophysics.
- Beggs, HD, Brill JP (1973) A study of two-phase flow in inclined pipes. SPE Paper, pp. 1-9.
- Guo B, Song S, Chacko J, Ghalambor A (2005) Offshore pipelines, (5th edn), Oxford: Elsevier publication.
- Irmann-Jacobsen TB (2013) Flow assurance – a system perspective, MEK4450-FMC Subsea technologies, Available from: (Accessed 1 January 2014).
- Kjøraas (2012) Modelling of Wax Deposition in Subsea Pipelines, Norwegian University of Science and Technology, Department of Petroleum Engineering and Applied Geophysics.
- Lee HS (2008) Computational and rheological study of wax deposition and gelation in subsea pipelines, PhD Thesis, University of Michigan.
- Jaeyoung L (2009) Introduction to offshore pipelines and risers, P.E., (2nd edn).
- Leontaritis KJ, Geroulis E (2011), Wax deposition correlation-application in multiphase wax deposition models, Asph Wax, Inc., Offshore Technology Conference, Texas, USA.
- Mirazizi HK, Shang W, Sarica C (2012) Paraffin deposition analysis for crude oils under turbulent flow, SPT Annual Technical Conference and Exhibition, San Antonio, Texas, USA.
- Malekzadeh R (2012) Severe slugging in gas-liquid two-phase pipe flow, Master of Science in Applied Earth Sciences geboren te Ghaemshahr, Sieca Repro, ISBN 978-94-6186-059-0.
- Misra S, Baruah S, Singh K (1995) Paraffin problems in crude oil production and transportation: A Review, SPE, Oil & Natural Gas Corp, Ltd.
- OLGA 7, SPT Group, Flow Assurance, Academy of Petroleum Dynamic.
- https://www.petrofac.com/media/1957/flowassurance-petrofac.pdf
- Siljuberg MK (2012) Modelling of paraffin wax in oil pipelines, NTNU-Trondheim.
- Singh P (2000) Formation and aging of incipient thin film wax-oil gels, AIChE J.
- Ahmed T (2007) Equations of state and PVT analysis, Applications for improved reservoir modeling, Gulf Publishing Company, Houston, Texas.
- Singh P, Venkatesan R, Fogler H, Nagarajan N (2001) Morphological evolution of thick wax deposits during aging. AIChE Journal.
- Tordal A (2006) Pigging of pipelines with high wax content. Publication of Pigging Products and Services Association, Statoil ASA, Stavanger, Norway.
- Venkatesan R, Creek JL (2007) Wax deposition during production operations: SOTA, SPE, Chevron Energy Technology Co., Offshore Technology Conference, Texas, USA.
- White FM (2008) Fluid Mechanics, (6th edn), Published by McGraw-Hill, USA.
- Zhu T, Walker JA, Liang J (2008) Evaluation of wax deposition and its control during production of Alaska North Slope Oils, Final Report, University of Alaska Fairbanks, ConocoPhillips Alaska, Inc., University of Kansas, United States Department of Energy National Energy Technology Laboratory.
Open Access Journals
- Aquaculture & Veterinary Science
- Chemistry & Chemical Sciences
- Clinical Sciences
- Engineering
- General Science
- Genetics & Molecular Biology
- Health Care & Nursing
- Immunology & Microbiology
- Materials Science
- Mathematics & Physics
- Medical Sciences
- Neurology & Psychiatry
- Oncology & Cancer Science
- Pharmaceutical Sciences
