ISSN : 2574-0431
Synthesis and Catalysis: Open Access
N-Doped Graphene Quantum Dots via Thermal Pyrolysis of Fumaric Acid for Optical Detection of Hg2+
1School of Chemical and Material Engineering, Jiangnan University, Wuxi 214122, China
2Key Laboratory of Food Colloids and Biotechnology, Ministry of Education, Wuxi 214122, China
3School of Nanjing Senior High School of Jiangsu Province, Wuxi 214400, China
- *Corresponding Author:
- Zaijun Li
School of Chemical and Material Engineering
Jiangnan University
Wuxi 214122, China
Tel: +86 13912371144
E-mail: zaijunli@jiangnan.edu.cn
Received Date: March 21, 2017; Accepted Date: March 23, 2017; Published Date: March 27, 2017
Citation: Wang J, Li Z. N-Doped Graphene Quantum Dots via Thermal Pyrolysis of Fumaric Acid for Optical Detection of Hg2+. Synth Catal. 2017, 2:1.
Intensive explorations have been focused on quantum dots because of their unique optical and electrical properties [1-4]. As a new kind of quantum dots, graphene quantum dots have attracted tremendous research interest, due to their unique properties such as low toxicity, high aqueous solubility, easy preparation, high luminescent, stable PL and good biocompatibility [5,6]. Graphene quantum dots prepared by bottom-up methods have higher quantum yield. What’s more, this method offers us exciting opportunities to control the GQDs with well-defined molecular size, shape and properties [7]. Functional groups with heteroatoms can be easily introduced into the GQDs by mingling certain molecules with small organic molecules. The introduction of certain functional groups can bring GQDs some unique properties. Here, we reported a facile one step synthesis of N-GQDs from the hydrothermal carbonization of fumaric acid in ammonia.
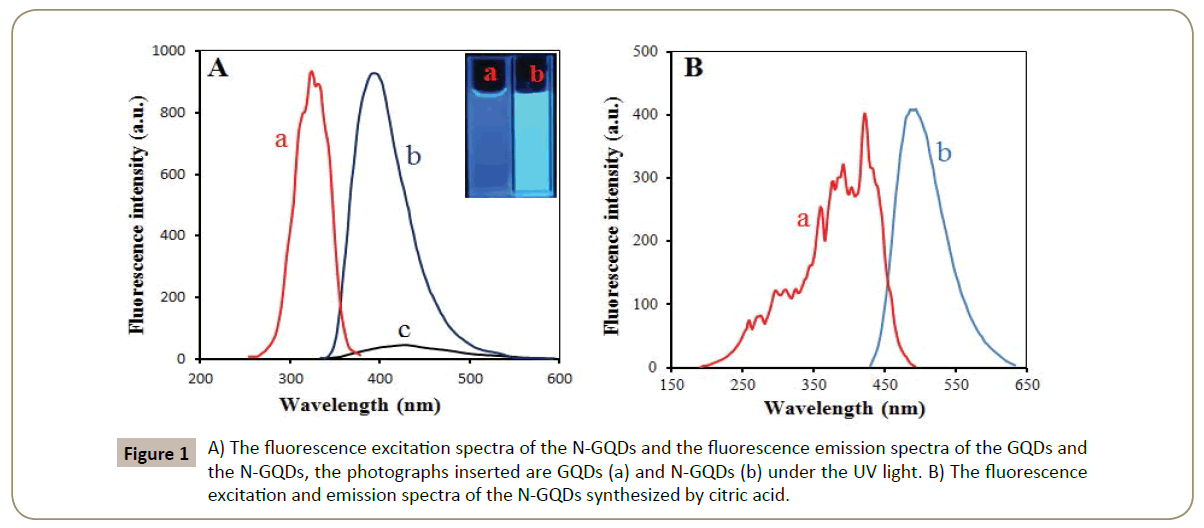
Figure 1A displays the fluorescence emission spectra and excitation spectra of the N-GQDs. In order to find out the difference between GQDs and N-GQDs, the fluorescence emission spectra of the GQDs is also displayed in Figure 1A. It can be seen that an obvious difference in fluorescence intensity between GQDs and N-GQDs. In the absence of NH3, the GQDs solution offers a much weaker fluorescence and the PL peak position shift from 392 nm to 428 nm. The introduction of NH3 leads to a rapid increase in fluorescence intensity. Besides, N-GQDs are also prepared by citric acid and NH3. The fluorescence mission spectra and excitation spectra are shown in Figure 1B. The PL peak position is a little longer at 494 nm, indicating that N-GQDs prepared by citric acid maybe have a larger size. Citric acid has more functional groups. They can combine with more ammonia so that the lattice will get larger. The excitation spectra of the N-GQDs prepared by citric acid is much broader than the N-GQDs prepared by fumaric acid, which indicates that the N-GQDs prepared by fumaric acid are much more uniform in size. The quantum dots synthesized by citric acid with more active groups are unstable. They will be broken easily so that the quantum dots are not very uniform in size. When fumaric acid or citric acid was solely used without the addition of ammonia, there is a very bad reproducibility of the undoped GQDs in size and PL intensity. The introduction of ammonia brings us an excellent reproducibility because carboxyl can react more easily with amino than carboxyl.
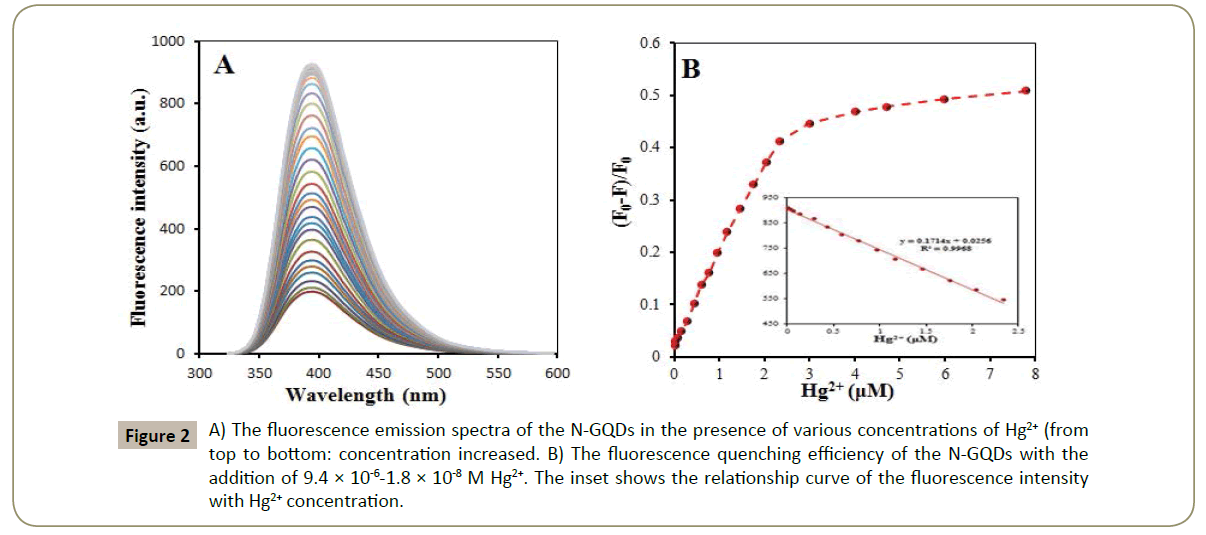
The fluorescence response of the Nano sensor for different concentrations of Hg2+ and the calibration plot of Hg2+ concentration corresponding maximum fluorescence intensity are shown in Figure 2A. Figure 2B shows that the fluorescence intensity at 392 nm linearly decreases with the increase of Hg2+ concentration in the range of 2.3 × 10⁻⁶-1.8 × 10⁻⁸ M. The linear equation was F=-2 × 10⁸ C + 903.86 with the statistically significant correlation coefficient of 0.9968, where F is fluorescence intensity at 392 nm and C is Hg2+ concentration (M). The detection limit was 5.9×10⁻⁹ M, which was obtained from the signal-to-noise characteristics of these data (S/N=3).
Figure 2: A) The fluorescence emission spectra of the N-GQDs in the presence of various concentrations of Hg2+ (from top to bottom: concentration increased. B) The fluorescence quenching efficiency of the N-GQDs with the addition of 9.4 × 10⁻⁶-1.8 × 10⁻⁸ M Hg2+. The inset shows the relationship curve of the fluorescence intensity with Hg2+ concentration.
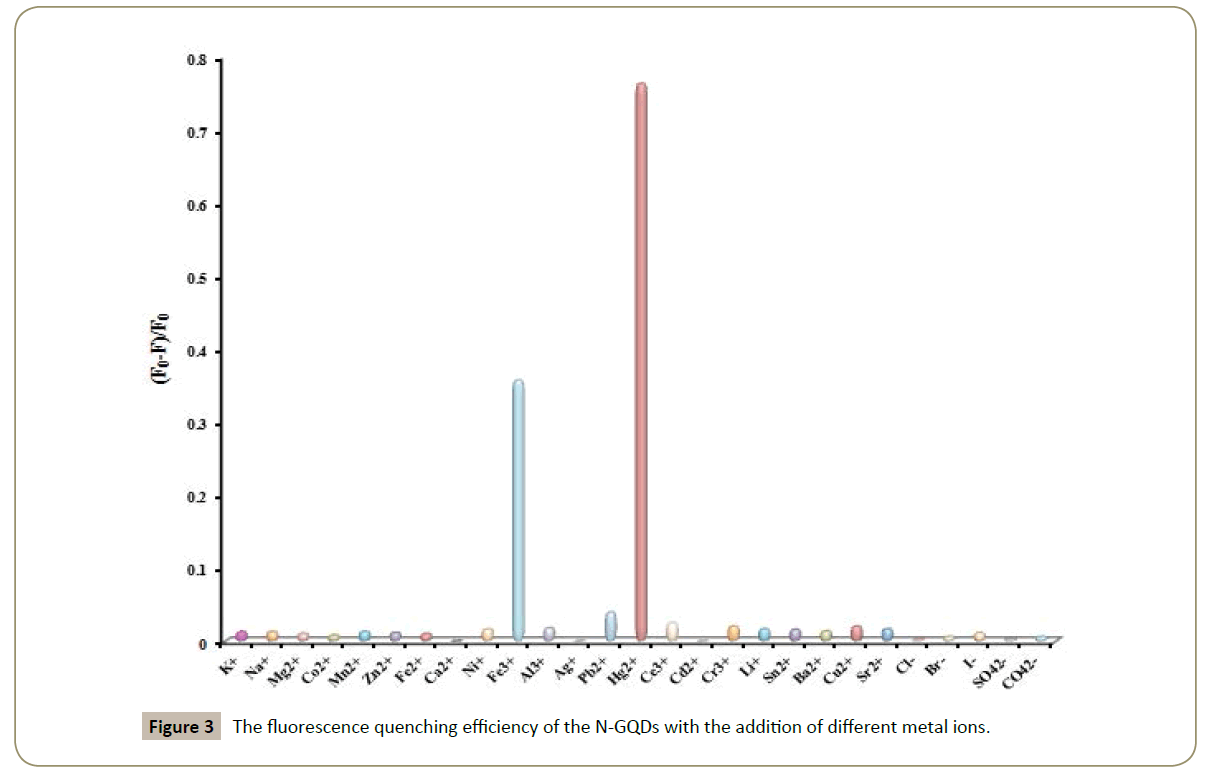
To evaluate the specificity of the sensing system based on N-GQDs for Hg2+ detection, the fluorescence quenching efficiency were examined in the presence of different metal ions under the optimal conditions. Figure 3 shows the fluorescence quenching result of the N-GQDs in the presence of K+, Na+, Mg2+, Co2+, Mn2+, Zn2+, Fe2+, Ca2+, Ni+, Fe3+, Al3+, Ag+, Pb2+, Hg2+, Ce3+, Cd2+, Cr3+, Li+, Sn2+, Ba2+, Cu2+, Sr2+, Cl-, Br-, I-, SO4 2- and CO4 2- (the concentration of all the ions above is 3×10⁻⁴ M). It is noteworthy that the fluorescence intensity of the N-GQDs is remarkably decreased in the presence of Hg2+. However, there is no obvious decrease in fluorescence intensity with the addition of K+, Na+, Mg2+, Co2+, Mn2+, Zn2+, Fe2+, Ca2+, Ni+, Al3+, Ag+, Pb2+, Hg2+, Ce3+, Cd2+, Cr3+, Li+, Sn2+, Ba2+, Cu2+, Sr2+, Cl-, Br-, I-, SO4 2- and CO4 2-. The fluorescence intensity is also quenched in the presence of Fe3+. Fortunately, Fe3+ (C ≤ 1 × 10⁻³ M) does not affect Hg2+ detection in the existence of 0.005 M L-ascorbate. Fe3+ can be reduced into Fe2+ by L-ascorbate. Besides, there is no decrease in fluorescence intensity of the N-GQDs with the addition of 0.005 M L-ascorbate. Therefore, the present fluorescence Nano probes are suitable to detect Hg2+ with high sensitivity and selectivity.
The feasibility of the newly developed method for possible applications was investigated by analysing real water samples. A water sample from a local lake was collected from Jiangsu province in China. The sample was first filtered through qualitative filter paper. No obvious fluorescence quenching was found for the pre-treated lake sample. The recovery experiments were performed by measuring fluorescence response to the sample in which known concentrations of Hg2+ were added. The concentration of Hg2+ in water samples was determined from the calibration curve and the value was used to calculate the concentration in the original samples. The recovery of Hg2+ in real water samples ranged from 97.5% to 102.0%, which demonstrated that the proposed method was satisfactory for the analysis of Hg2+.
In conclusion, we have demonstrated a novel N-GQDs synthesized from the carbonization of fumaric acid through hydrothermal treatment in the presence of ammonia. The reproducibility of the GQDs gets better after the introduction of ammonia. These synthesized N-GQDs were mostly composed of one single layer with a uniform size of about 3 nm. Compared with the N-GQDs prepared by citric acid and ammonia, the N-GQDs synthesized by our method are much more uniform in size. Due to the introduction of nitrogen atoms, N-GQDs exhibit a bright luminescence with a much higher quantum yield than GQDs. Furthermore, thanks to the less kind of the active groups, we have demonstrated that the as-prepared N-GQDs can be used as fluorescence probe for the detection of Hg2+ ions with high selectivity. The Nano sensor based on the N-GQDs has been successfully applied in the fluorescence detection of Hg2+ in real water samples. Moreover, this kind of GQDs based on fumaric acid offers a promising opportunity for the designing of GQDs based probes with higher selectivity.
References
- Otto T, Muller M, Mundra P, Lesnyak V, Demir HV, et al. (2012) Colloidal Nanocrystals Embedded in Macrocrystals: Robustness, Photostability, and Color Purity. Nano Lett 12: 5348-5354.
- Han Z, Qiu F, Eisenberg R, Holland PL, Krauss TD (2012) Robust Photogeneration of H2 in Water Using Semiconductor Nanocrystals and a Nickel Catalyst. Science 338: 1321-1324.
- Dubertret B, Skourides P, Norris DJ, Noireaux V, Brivanlou AH, et al. (2002) In vivo imaging of quantum dots encapsulated in phospholipid micelles. Science 298: 1759-1762.
- Medintz IL, Uyeda HT, Goldman ER, Mattoussi H (2005) Quantum dot bioconjugates for imaging, labelling and sensing. Nat Mater 4: 435-446.
- Shen JH, Zhu YH, Yang XL, Li CZ (2012) Graphene quantum dots: emergent nanolights for bioimaging, sensors, catalysis and photovoltaic devices. Chem Commun 48: 3686-3699
- Zhu SJ, Tang SJ, Zhang JH, Yang B (2012) Control the size and surface chemistry of graphene for the rising fluorescent materials. Chem Commun 48: 4527-4539.
- Fan ZT, Li SH, Yuan FL, Fan LZ (2015) Fluorescent graphene quantum dots for biosensing and bioimaging. RSC Adv 5: 19773-19789.
Open Access Journals
- Aquaculture & Veterinary Science
- Chemistry & Chemical Sciences
- Clinical Sciences
- Engineering
- General Science
- Genetics & Molecular Biology
- Health Care & Nursing
- Immunology & Microbiology
- Materials Science
- Mathematics & Physics
- Medical Sciences
- Neurology & Psychiatry
- Oncology & Cancer Science
- Pharmaceutical Sciences


