ISSN : 2393-8854
Global Journal of Research and Review
Molecular Analysis of Three Rabbit Genotypes Using Protein Markers
Abstract
The potential applications of protein markers reveal its importance as a powerful tool in breeding improvement. Native polyacrylamide gel electrophoresis provides an accurate method for assaying variation in plasma proteins. It is a very useful technique for the detection of different genetic expressions and understanding relationship among three rabbit genotypes namely Alexandria, V-line and Baladi Black. Also, protein molecular markers can be used as linked to quantitative traits. The results of this study revealed two specific protein markers in Alexandria rabbits; these specific protein markers may be responsible for the superiority of Alexandria line at weight. Moreover, from the dendrogram, the genetic dissimilarity values were (0.11), (0.43) and (0.22) between (V & Alex), (Alex & BB), and (BB & V), respectively. Alexandria line was distinctly different from the other genotypes related in their expressions.
Keywords
Rabbit, Genetic similarity, Protein markers, Dendrogram.
Introduction
Domestic rabbit (Oryctolagus cuniculus) has its importance as supplier of meat, and it is widely accepted thought out the world for human consumption [1]. V-Line is a breed, bring to Egypt and yet no sufficient knowledge is available. Furthermore, a synthetic paternal rabbit line named Alexandria, was produced by crossing a Vline with a local breed named Baladi Black rabbits and will be used as a selection criterion of genetic improvement for this line [2,3]. Seasonal variation on litter weight due to kindling season, is a reflection of differences in seasonal climate conditions in geographical location of the rabbitry [12].
The present study aimed to evaluate the litter weight and protein markers to found link between them and understanding relationships among three rabbit genotypes (Alex, V and BB) by studying: (i) the alteration in litter weight under two different seasons, (ii) protein fingerprint. Thence, this study supplies comprehensive approaches for studying the biochemical differences among different rabbit genotypes and carried out to investigate and evaluate the different relationships between productive traits and protein molecular markers in three strains of rabbits during production season.
Materials and Methods
The experimental work of the present study was carried out at rabbitry of the Poultry Research Center of the Poultry Production Department, Faculty of Agriculture, Egypt. It was conducted on two flocks: Alexandria (Alex), V-line (V) during the production season. While Baladi Black (BB) strain was used as a control in the biochemical genetic analysis.
Biochemical genetic analysis
Blood collection
Blood samples were collected from central artery vein of the ear in centrifuge tubes (3 ml) containing heparin sodium as anticoagulant for the biochemical analysis, from each individual of V-line, Alexandria and Baladi Black rabbits. All rabbits used were phenotypically normal and sexually fertile.
Protein electrophoresis
Protein profile was analyzed by procedure published by Pan et al., (1991). PAGE polyacrylamide resolving gels (7.5%, 1.5 mm thick) were prepared according to Nadolny and Sequeira (1980).
Scoring and analysis of proteins patterns
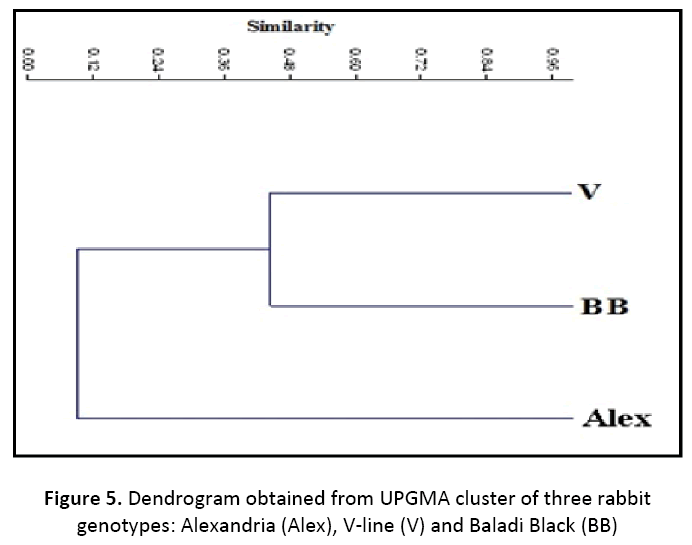
The resolved protein bands were documented and processed for data analysis; The clear, unambiguous and reproducible band represent across the protein samples were scored as (1) and absence of bands were recorded as (0) in the protein profile of different genotypes of rabbits (Table 2). The indexes of similarity were calculated across all possible pair wise comparisons among lines following the method of Nei and Hi (1979). The results of similarity matrix was subjected to UPGMA clustering using the unweighted pair group method for arithmetic means Algorithm to generate a dendrogram (Figure 5).
Table 2. Protein banding patterns expressed as presence (1) versus absence (0) of three rabbit genotypes
| Zones | MW (KDa) | Alex | V | BB |
|---|---|---|---|---|
| 1 | 274.502 | 1 | 1 | 1 |
| 2 | 267.846 | 1 | 1 | 1 |
| 3 | 266.398 | 1 | 1 | 1 |
| 4 | 245.000 | 1 | 0 | 0 |
| 5 | 223.931 | 1 | 1 | 1 |
| 6 | 221.432 | 1 | 1 | 1 |
| 7 | 170.678 | 1 | 1 | 1 |
| 8 | 136.420 | 1 | 1 | 1 |
| 9 | 105.886 | 1 | 1 | 1 |
| 10 | 85.656 | 1 | 1 | 1 |
| 11 | 74.237 | 1 | 1 | 1 |
| 12 | 70.000 | 1 | 0 | 0 |
| 13 | 64.215 | 1 | 1 | 1 |
| 14 | 62.293 | 1 | 1 | 1 |
| 15 | 51.541 | 1 | 1 | 1 |
Alex: Alexandria, V: V-line, BB: Baladi Black, MW: Molecular weight; (TotalLab Quant®, 2013).
Statistical analysis
Data of litter weight were statistically analysed using SPSS statistical program [9].
Results and Discussion
Litter weight at 21, 28 and 63 days of age
Generally, litter weight at 21 or 28 days old reflect the doe performance, specially milk output, as reported by Tawfeek (1996). Also, the peak of milk production incidence at approximately 21 days after parturition in standard breeds of rabbits. Lukefahr et al. (1990) stated that litter weight at weaning, as a composite trait reflects the contribution of fertility, maternal behavior, milk production, growth rate and viability. The results of litter weight at 21 (LW21), 28 (LW28) and 63 (LW63) days of age between the two lines and seasons studied, are presented in Table (1). In respect to LW21, the results showed that the Alexandria line and spring season had statistically significant higher litter weight than V-line and autumn season.
Table 1. Least square means and standard errors for litter weight of Alexandria and V-line at 21 (LW21), 28 (LW28) and 63 (LW63) days of age, as affected by lines and seasons, and their analysis
| Factors | Does N. | LW21 (g.) | LW28 (g.) | LW63 (g.) | |
|---|---|---|---|---|---|
| Seasons Autumn Spring LinesAlex V Seasons Ï Lines Autumn Spring |
Alex V Alex V |
135 | 2847.11B ±3.31 | 5223.23B ±4.11 | 11287.11B ±9.30 |
| 121 | 2983.10A ±3.45 | 5405.44A ±4.21 | 12907.38A ±9.55 | ||
| 119 | 3022.13α ±3.22 | 5160.34α ±4.12 | 12588.65α ±9.45 | ||
| 137 | 2973.15β ±3.33 | 5093.17β ±4.32 | 11351.19β ±9.42 | ||
| 62 | 3040.12b ±3.07 | 5312.55b ±4.34 | 11651.23b ±8.03 | ||
| 73 | 2816.15d ±3.26 | 5130.20c ±4.27 | 11180.21d ±9.62 | ||
| 57 | 3147.22a ±3.19 | 5564.12a ±5.10 | 12725.77a ±9.42 | ||
| 64 | 2915.61c ±3.20 | 5223.76b ±5.09 | 11365.14c ±9.39 | ||
| ANOVA | |||||
| SOV | df | Significance | |||
| Seasons | 1 | *** | *** | ** | |
| Lines | 1 | *** | ** | *** | |
| SeasonsÏLines | 1 | *** | *** | ** | |
| Error | 255 | ||||
Means in the same column with different superscript letters are significantly different for each effect.
**Significant P≤ 0.01
***Significant P≤ 0.001
Protein banding patterns
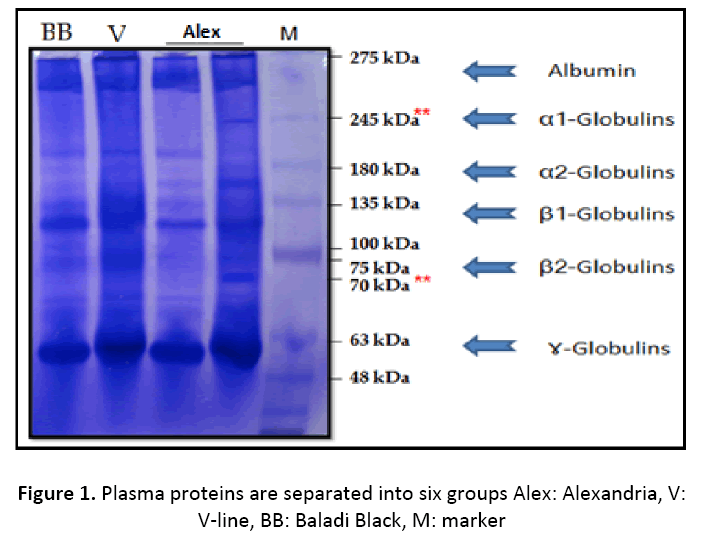
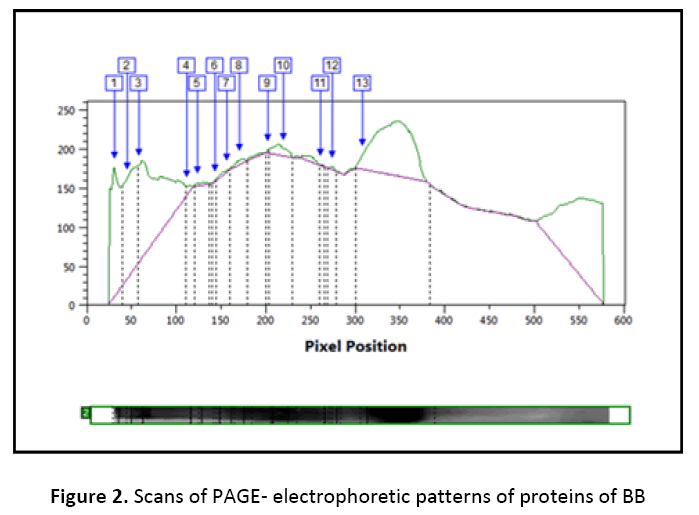
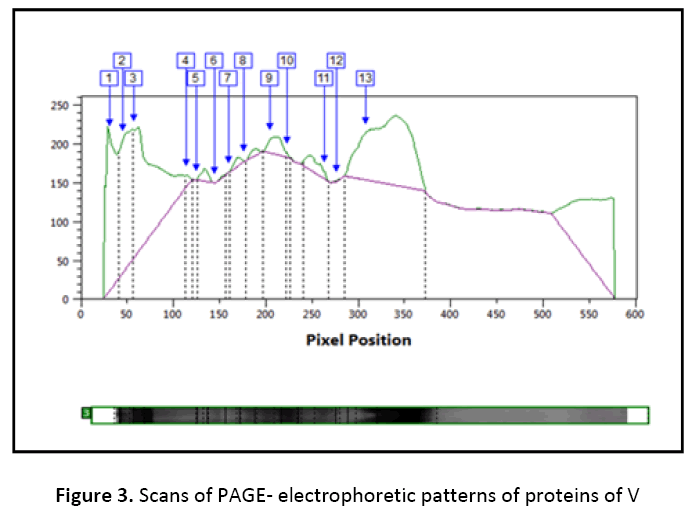
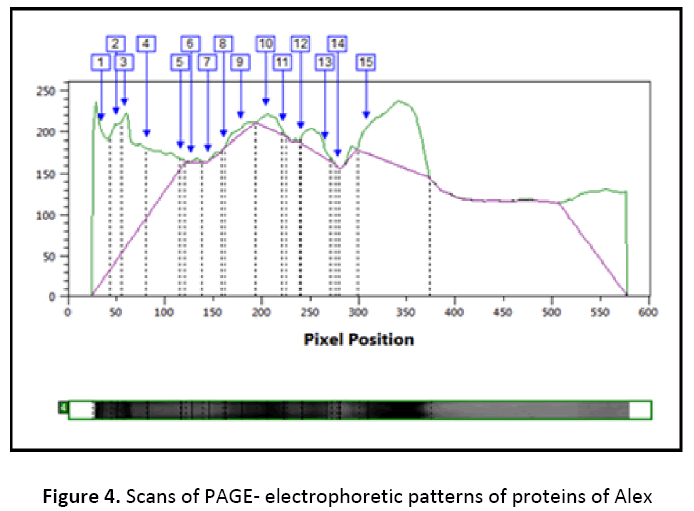
The polymorphism of protein markers gives some beneficial information in studies of animal breeding such as the relationships among breeds and their evolution. Variation in protein profile reflects changes in the genes that code for them. Figure 1, shows photograph of electrophoretic patterns developed by Alex, V and BB respectively. Scans of PAGEelectrophoretic patterns of proteins of BB, V and Alex shown in Figure 2, 3 and 4. Native polyacrylamide gel electrophoresis provides an accurate method for assaying variation in plasma proteins. The protein banding pattern of each genotype reveals a biochemical genetic fingerprint and each band in the pattern reflects a separate transcriptional level. The banding protein patterns showed 15 protein bands are diagnostic to Alex line, while 13 bands are detected for V-line as well as BB breed. The results revealed two specific bands which could be used as specific protein markers to characterize Alexandria rabbits. These specific protein markers are expression genes and these genes may be responsible for the superiority of Alexandria line at weight.
Protein electrophoresis separates proteins based on their size and electrical charge. It is a screening test with high resolution that measures the major blood proteins by separating them. The major plasma proteins of rabbit blood can be classified as follows: albumin and globulin proteins. Globulin protein is divided into: α1, 2-globulins, transferrins (β1, 2- globulins) and immunoglobulins (ɤglobulins) (Figure 1). Moreover, the profile of proteins classification can used to estimate, diagnose and observe a variety of diseases and conditions. It can be used for these purposes because the levels of different blood proteins increase or decrease in response to such disorders at intestinal or kidney protein wasting syndromes, disorders of the immune system, liver dysfunction, impaired nutrition, and chronic fluid retaining conditions [7].
The results of similarity among the three rabbit genotypes can contribute significantly to the development of genetic improvement programs in rabbits. The UPGMA dendrogram, based on Nei’s distance, depicts the relationships among the investigated rabbit genotypes (Figure 5). The genetic dissimilarity values were (0.11), (0.43) and (0.22) between (V & Alex), (Alex & BB), and (BB & V), respectively (Table 3). Alexandria line was distinctly different from the other genotypes related in their expressions.
Table 3. Similarity index of three rabbit genotypes, as determined by protein analysis
| Alex | V | BB | |
|---|---|---|---|
| Alex | 1 | 0.1133 | 0. 4310 |
| V | 0.1133 | 1 | 0.2220 |
| BB | 0. 4310 | 0.2220 | 1 |
Conclusion
Molecular analysis among rabbit breeds through protein electrophoresis still can be used as a tool to detect different genetic expressions and understand the variability in some productive traits in rabbits. Also, protein electrophoresis tests give a good practitioner estimate of the present or absent of abnormal protein fraction. These results can be helpful to enhance the genetics programs in rabbits.
References
- Colin, M. and F., Lebas, 1996. Rabbit meat production in the world. Aproposal for every country. In Proc.: 6th World Rabbit Congr, Toulouse, France, 323-330.
- El-Raffa, A.M., 2005. Genetic analysis for productive and reproductive traits of V line rabbits raised under Egyptian conditions. Egyptian Journal of Poultry Science. Vol. 25(IV):1217-1231.
- El-Raffa, A.M., 2007. Formation of a rabbit synthetic line (Alexandria line) and primary analysis of its productive and reproductive performance. Egypt Poult. Sci. Vol (27) (II): 321-334.
- Nadolny, L. and L., Sequeira, 1980. Increases in peroxidase activities are not directly involved in induced resistance in Tobacco. Physiological and Molecular Plant Pathology. 16:1-8.
- Nei, M. and W.H., Li, 1979. Mathematical model for studying genetic variation in terms of restriction endonuclease. Proceeding of national academy of science U.S.A., 7: 5269-5273.
- Lukefahr, S.; Cheeke, P.R.; and Patton, N.M. 1990. Prediction and causation of litter market traits from preweaning and weaning characteristics in commercial meat rabbits. J. Anim. Sci., 68:2222-2234.
- Pagana, K.D., 1998. Mosby's Manual of Diagnostic and Laboratory Tests. St. Louis: Mosby, Inc..
- Pan, S., X., Ye, and J., Kuc, 1991. A technique for detection of chitinases, B-1, 3- glucanases and protein pattern, after single separation using PAGE or isoelectric focusing. Phytopathol., 81:970-974.
- SPSS®, 2011. SPSS User’s Guide: Statistics, Version 20.0, Institute, Inc., Cary, NC, USA.
- Tawfeek, M.I. 1996. Effect of feeding system and supplemented diet with Kemzyme on growth, blood constituents, carcass traits and reproductive performance in rabbits, under intensive production conditions, Egypt. J. Rabbit Sci., 6 (1):21- 37.
- TotalLab Quant® 2013. User’s Guide: Version 13, Inc., NC, USA.
- Youssef, M.K., 1992. The productive performance of purebred and crossbred rabbits, M. Sc. Thesis, Fac. Agric., Moshtohor, Zagazig Univ., Banha Branch, Egypt.
Open Access Journals
- Aquaculture & Veterinary Science
- Chemistry & Chemical Sciences
- Clinical Sciences
- Engineering
- General Science
- Genetics & Molecular Biology
- Health Care & Nursing
- Immunology & Microbiology
- Materials Science
- Mathematics & Physics
- Medical Sciences
- Neurology & Psychiatry
- Oncology & Cancer Science
- Pharmaceutical Sciences
