Modeling the Degradation Process of Tomato Paste Color during the Thermal Process Using Artificial Neural Networks Methodology
Seyedeh Sedigheh Hashemi*, Mohamad Reza Mozafarian and Mohammad Ganjeh
Department of Food Process Engineering, University of Kherad Institute of Higher Education, Bushehr, Iran
- *Corresponding Author:
- Seyedeh Sedigheh
Hashemi
Department of Food Process Engineering,
University of Kherad Institute of Higher Education, Bushehr,
Iran,
Tel: 09353359789
E-mail:mrs.sedighehashemi@gmail.com
Received date: April 25, 2022, Manuscript No. IPJPSAR-22-13297; Editor assigned date: April 28, 2022, PreQC No. IPJPSAR-22-13297 (PQ); Reviewed date: May 13, 2022, QC No. IPJPSAR-22-13297; Revised date: June 27, 2022, Manuscript No. IPJPSAR-22-13297 (R); Published date: July 05, 2022, DOI: 10.36648/IPJPS AR.6.5.085
Citation: HHashemi SS, Mozafarian MR, Ganjeh M (2022) Modeling the Degradation Process of Tomato Paste Color during the Thermal Process Using Artificial Neural Networks Methodology. J Plant Sci Agri Res Vol:6 No:5.
Abstract
Color is one of the important quality factors of processed tomato products such as paste and is strongly affected by the thermal process. The main purpose of this study was to evaluate the kinetics of paste color degradation during the thermal process using artificial neural networks. For this purpose, tomato paste was processed at three temperatures of 60, 70 and 80 degrees Celsius for 25 to 100 minutes and using three main color indicators including: L, a, and b, a/b ratio, Color Difference Overall (TCD), saturation index and Hugh angle were determined. The degradation kinetics of these parameters was investigated and modeled using an artificial neural network model. Index b with the highest and TCD and a/b with the lowest activation energy had the highest and lowest sensitivity to temperature changes, respectively. According to the values of MSE and R2 presented in the present study, the feed neural network with logarithmic transfer function and topology 3-8-3 (input layer with three neurons-a hidden layer with eight neuron-output layer with three neurons) with more than R2 1.38 and MSE equal to 1.2228 were selected as the optimal neural network. Application of artificial neural network in this project proved to be a useful tool to determine the tomato paste quality through non-invasive, low-cost and real time processes.
Keywords
Color degradation; Tomato paste; Neural network methodology
Introduction
Among agricultural products, tomatoes and their products are one of the most important products of the processing industry in the world, whose economic importance has increased day by day and is the second most important vegetable in the world, which is divided into two Fresh and processed form is consumed [1,2]. According to recorded statistics, about 1.2 million tons of tomatoes produced are used for processing and paste production [3]. In the tomato paste production line, after sorting, the product is crushed. Chopped tomatoes enter the preheater through a shredding hopper, which is usually used in factories in two methods, hot breaking (high temperature) and cold breaking (low-temperature) to process and produce tomatoes [4]. After washing and sorting, the tomatoes are cut into smaller pieces by a shredder and then for initial heating (breaking temperature), in the hot brick method, at a temperature above 90°C for 5 They are heated for up to 10 minutes and in the cold break method, this operation is performed at a temperature below 77°C [5]. The hot brick method inactivates effective enzymes on the surface, especially methyl pectin esterase and endopolygalacturonase [6]. These two enzymes destroy pectin [7]. In the cold break method, by increasing the activity of enzymes, products with lower viscosity, fresh taste and more natural color are obtained than the hot break method [8]. In an industrial plant, this heat treatment is performed under vacuum to break down enzymes to minimize oxidation [9]. Then, by reducing the juice content of tomato in various evaporation systems, the concentration of tomato paste reaches 30 to 32 degrees Brix [10]. Maintaining the quality of the paste is very important in the tomato processing industry. From consumers' point of view, color is a very important quality factor in processed tomato products that affects consumer acceptance [11]. Some of the reactions that occur during heat treatment affect the final color of the product. Among them, the most common and common is the loss of pigments, especially carotenoids (lycopene, xanthophyll and chlorophyll) [12]. Color is usually defined by three characteristics L, a, and b. Determining the color using the three main characteristics in the food industry and especially in products such as tomato paste that have high color is the most appropriate method [13]. The L-factor indicates the brightness and gloss of the product and is graded from 100 for full white to zero for absolute black. Positive values a indicate redness and negative values indicate the greenness of the product, also positive values b indicate the amount of yellow color and negative values indicate the amount of blue color of the product [14]. Other parameters derived from these three main parameters include total color loss, saturation index, or chroma, which is an indicator of color saturation and intensity, a/b ratio, and HU angle) cited [15]. The a/b ratio is used as a characteristic of the color quality of tomato products. Values of 2 and above indicate excellent color quality of the product and values less than 1.80 are unacceptable [16]. Hugh angle is another parameter that is widely used in color evaluation of food products. The value of zero or 360 degrees of this angle indicates the red color of the product, while the values of 90, 180 and 270 degrees of this angle indicate the yellow, green and blue colors respectively [17].
Artificial neural network models have a significant place in modeling and controlling food industry processes. Artificial neural networks are a good tool for dynamic modeling because they do not require the parameters of physical models, have the ability to learn how to solve problems from a series of laboratory data, and can perform complex and nonlinear systems. Manage and control. Based on the results of various researchers, the use of this modeling method is suitable for food processes such as filtration, extrusion, drying, etc. [18]. In the research conducted by Anchor et al. on the techniques of color characteristic extraction in fruits, artificial intelligence and fuzzy logic methods have been used and valuable results have been achieved in this field [19]. Another study confirmed by Marcus et al. on tomato color based on artificial intelligence modeling also contains useful and practical information [20]. During another study done in 2015, George Matthew used a combination of components to create color and a combination of techniques to identify components by performing image processing in Matlab environment in the form of an RGB color model [21]. In addition Harna Yoshi, et al. used artificial neural network modeling system to study the color of mango, which was able to distinguish ripe or concentrated mango with 94% accuracy Sarhadi, et al. [22]. Also used artificial neural networks for modeling to predict the effect of ozone, chitosan and temperature treatments on the acidity of Mazafati dates during storage [23]. Also, Shahin et al. used a method to handle apples. They presented the use of an optimized neural network and fuzzy ligand classifier [24]. And in another study, Iraji, et al. Used artificial intelligence modeling and fuzzy logic to grade tomatoes [25].
In addition, Taqdami and his colleagues used artificial neural network technique to determine the color parameters of cherries during pouring [26]. Due to the limited studies on modeling food color change during thermal processes, especially in the case of tomato paste, the purpose of this study is to present a new approach using neural networks and find the optimal network topology. An artificial nerve is used to study the discoloration of tomato paste during thermal processes..
Materials and Methods
Sample preparation and determination of its initial characteristics: Tomato paste samples were prepared in the summer of 2011 from Kamnoosh Food Industries Factory located in Gorgan and used to perform tests. Due to the fact that most of the heat process during the production of tomato paste is done on the almost concentrated product (during the concentration process in evaporators), for this research, tomato paste was used instead of extract or other intermediate products. To test the effect of heat and time on it. The physicochemical characteristics of the prototype (Table 1) were determined according to the Iranian National Standard No. 761. Evaluation of color changes: To evaluate the thermal degradation of the product color, a steam bath was used and the samples were placed in glass jars with lids at temperatures of 60, 70 and 80 degrees celsius and at 25, 75 and 100 minutes on samples color analysis was performed. For this purpose, the samples were first brought to 12.5 brix using distilled water based on the usual method of color measurement in paste factories and the concentration required to work with Gardner colorimetric device, so that Free of any air bubbles and then the color of the samples was measured using a Gardner device (model LS 2000 made in Italy) and the factors L, a and b were recorded, then a/b and the factors TCD, S and HU was evaluated using equations 1, 2 and 3, respectively. During the test, the samples were mixed at a uniform rate to prevent local heating of the samples. Next to the steam bath, a zero-degree cold water container was provided, and immediately after the process, at the specified times, the samples were taken out of the hot water and placed in cold water to prevent over- processing.
| Level | Factor | Level | Factor |
|---|---|---|---|
| 1/2% | Salt | 27 B | Brix |
| 3/4% | PH | 15/2 | Color ( a/b) |
| 1/7 cm per second | Consistency of Bust wick | 1.7 grams of citric acid per 100 grams of sample | Acidity (% citric acid) |
Table 1: Basic physicochemical properties of tomato paste.
TCD=((L0-L) 2+(a0-a) 2+(b0-b).
1/2 2) SI=(a2+b2) 1/2
Hu angle=tan-1 a/b
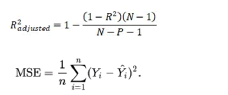
Modeling by artificial neural networks: To determine the optimal neural network, the Neural Network tool of MATLAB software version R2 013a was used. By testing neural networks with different transmission functions as well as different number of hidden layers and number of neurons in this layer, two types of feed networks (NEWFF) and feedback (NEWCF) with two hyperbolic sigmoid tangent transmission functions (TANSIG) and logarithmic (LOGSIG) with a hidden layer and a maximum of 10 neurons in this layer, Lunberg-Marquatt learning model and 1000 learning cycle were selected. To select the optimal network, two criteria for evaluating the correlation coefficient (R2) and the Mean Squared Error (MSE), which are determined by equations 1 and 2, respectively, were used:
In these equations, pi X is the humidity ratio predicted by the ei X grid, the actual humidity ratio obtained from the experiments, and X is the average of the laboratory humidity ratios and N is the total number of observations.
Results and Discussion
In addition to predicting the parameters, the use of RNA is mainly used to classify foods or some of their properties, which in most studies found a high correlation percentage.
In Table 2, we see the measured values for each of the desired color parameters in different temperature and time treatments. The color of tomato paste tends to darken over time during the thermal process and also with increasing temperature, which can be clearly seen in Figure 1, which shows a decrease in L, which is an indicator of brightness and gloss of the product.
| SI | TCD | HU | a / b | L | b | A | Treatment |
|---|---|---|---|---|---|---|---|
| 1/40 | 0/22 | 25/6 | 2/08 | 27/7 | 0/61 | 1/26 | 25 min-60 °C |
| 1/37 | 0/42 | 26/0 | 2/05 | 27/5 | 0/60 | 1/23 | 25 min-70 °C |
| 1/34 | 0/98 | 26/5 | 2/00 | 26/9 | 0/59 | 1/20 | 25 min-80 °C |
Table 2: The amount of color parameters measured in different treatments.

Figure 1: Changes in the values predicted by the neural network for optimal topology (7-8-2) versus laboratory values in the process of changing tomato paste during the thermal process.
Table 3 shows the comparison of the effect of the number of hidden layer neurons on the prediction accuracy of feedbacks and feedbacks neural networks with two hyperbolic and logarithmic sigmoid tangent transfer functions, Lnberg-Marquatt learning pattern and 1111 learning cycle. According to the values of MSE and R2 presented in this table, the feed neural network with logarithmic transfer function and topology 3-8-3 (input layer with three neurons-a hidden layer with eight neurons-output layers with three neurons) with R2 more than 1.38 and MSE equal to 1.2228 are selected as the optimal neural network. Studies done by Poligne, et al. [27] who used neural networks to model the processing of pork in glucose solution with the flavoring of liquid smoke, the high efficiency of this model with a correlation coefficient of 1.31 for WL and 30. 1 approved for SG. In a study by Dębska and Guzowska Swider, they evaluated the characteristics of a beer brand by means of parameters such as transparency, color, taste, degree of fermentation, pH, acidity, etc., via an RNA in which categorised as "good" or "bad". In that stydy, a multilayer perceptron was used, this included an input layer, one or more hidden layers, and an output layer with a radial base pattern. RNA implementation made it possible to distinguish between the qualities of the samples with 100% efficiency in predicting the beverages studied. Gorska Horczyczak, on the other hand, sought to distinguish the neck, waist, and ham from frozen, fresh, and rotten pork to prevent fraudulent sales. This study was performed using an electronic nose supported by the RNA model, which was based on three nonlinear perceptron layers [28]. The results showed effective detection of 90%, 85% and 80% for rotten frozen samples and fresh pork, respectively, which shows the usefulness of this method for its inherent speed, efficiency and resonable price.
| Input weight | |
|---|---|
| 7.640201 | -1.4844 |
| -5.52916 | -5.14836 |
| 6.159784 | 4.930758 |
| 7.875152 | 0.609985 |
| 6.396361 | 4.554277 |
| -6.75411 | -4.08501 |
| -6.35568 | -4.59691 |
| 4.82381 | 6.904842 |
Table 3: Input weight in different layers.
Moreover, Haji Mahmoudi, et al. [29] following the classification of five types of vinegar (distilled, apple, grape, pomegranate and unclassified) from the measurement of their organic acid composition using High Performance Liquid Chromatography (HPLC) using an RNA with multilayer type post-diffusion feedback. He found the proposed model with an accuracy of 88.6%, which successfully classified various types of vinegar, even unclassified samples. Another study suggested a way to classify four types of oils: canola, sunflower, corn, and soy from a variety of tools, including the use of three-layer RNA, each with four neurons. Fluorescence spectral values were used as input data. It was found that the proposed model is able to classify oils with a yield of 72% [30]. Similarly, it was proposed using the methodology RNA was scaled to identify the origin of the extra virgin olive oil using a multilayer perceptron model and a conjugate gradient algorithm. For classification, three methods were used: meteorological services, near infrared data and nuclear magnetic resonance, gaining more capacity to classify products in the last method mentioned, with accuracy values higher than 99% [31]. Three species of Rio de Janeiro fish were classified in a study conducted by Hauser-Davis et al. [32] using a multilayered perceptron with four hidden layers and six neurons in each, and this list was 100% Achieved the correct distribution. By comparing these results with the results used using discriminatory analysis, 92% of the correct classifications were generated. Cevoli et al. [33]. Classified the type of Pecorino cheese using volatile component analysis and artificial neural networks, the latter with different architectures made in the number of input units: 19, 6 and 184. The best the results were obtained in each case with 10, 4 and 35 neurons in the hidden layer, respectively, and the percentage of correct classification reached 100, 75 and 100%, respectively.
On the other hand, in another scientifical study performed by Almida, et al. [34], gelatin was prepared from chicken legs with different formulations. A classification of sensory experiments with 50 trained taste buds was developed using Kohonen-type RNA, which makes it possible to identify the acceptability of gelatins and obtains very satisfactory results using the lattice. Anjos, et al. [35] determining the biological origin of honey used in its experiments, using 14 different architectures and obtaining the best results by configuring 25 neurons in the hidden layer and four input variables (color, electrical conductivity, Content of total polyphenols and ash) which makes 100% of the correct determinations. Similarly, the results obtained with the architecture of 25 neurons in the latent layer and three input variables were the least satisfactory with 20% of the correct determinations, and Muñiz-Valencia, et al. [36] followed its instruction as well to classification of Mexican coffee using a multilayer perceptron with six neurons in the input layer, five neurons in the input layer, five neurons in the latent layer and four neurons in the output layer, using coffee from four different sources. Exposure rates were 100%, 94%, 94% and 81% for coffee from Chiapas, Colima, Oaxaca and Veracruz. Furthermore, Lertworasirikul Saetan and the best model of artificial neural network to predict the rate of water depletion and absorption of solids in the osmotic process of lemon peel as a feed network with Levenberg-Marquat learning algorithm and a hidden layer consisting of 5 neurons [37]. A ponte-Ayala and Martinez-Ochoa in the process of osmotic dehydration of apples also examined neural networks with 1 to 0 neurons in the hidden layer and introduced the optimal network as a lattice with a hidden layer containing 1 neuron with correlation coefficients of/30 1 and 1.83 were able to predict laboratory data for WL and SG, respectively [38]. Likewise, Zhu and Linko stated that neural models with a hidden layer are suitable for continuous and nonlinear phenomena, and models with more than one hidden layer are used only for special cases [39]. In 2009, Zita Bla in the case of osmotic drying of mangoes, tested neural networks with 1 to 11 neurons in the hidden layer, and finally, by examining the values of MSE and R in each of these networks, we tested the topology 1-2-1 with an R value above 1.30 as they chose the optimal topology. As shown in Figure, weight and bias values are required to connect the 3 input layer neurons to the 8 hidden layer neurons and also to connect the hidden layer neurons to the 3 output layer neurons. The weight matrix for the input layer to the hidden layer is a 3 × 8 matrix (connecting three input layer neurons to eight hidden layer neurons) and for the hidden layer to the output layer an 8 × matrix (connecting eight hidden layer neurons to the three output layer neurons) to Are in the form of matrices A and B, respectively. In addition, the bias matrix for the input layer to the hidden layer will be a Hussein 1 1 matrix (matrix C) and for the hidden layer to the output layer will be a 1 × 1 matrix (matrix D) (Tables 4-6).
| Output weight | ||||||
|---|---|---|---|---|---|---|
| -0.25876 | 0.204841 | 0.372863 | -0.16842 | 0.236635 | -0.18615 | 0.138362 |
| -1.50634 | 1.075648 | 1.414475 | -0.81308 | 1.179871 | 1.421085 | 1.134768 |
| -0.4072 | -0.59042 | 0.078583 | 0.810433 | 0.043895 | -0.14326 | -0.30591 |
| 0.130742 | -0.14306 | -0.11547 | -0.23589 | -0.62484 | 0.909792 | -0.05761 |
| 0.770474 | 0.118075 | -0.41301 | 0.400632 | 0.044976 | -1.06868 | -0.40338 |
| 0.14734 | 0.235381 | 0.057136 | 0.012182 | 0.291482 | -0.17447 | -0.0838 |
| 0.199615 | -0.10809 | -0.23198 | -0.11114 | -0.26166 | 0.117143 | 0.036102 |
| 0.400618 | -0.2221 | -0.37797 | 0.146589 | -0.24129 | -0.33893 | -0.17603 |
Table 4: Output weight in different layer.
| Matrix C | Matrix D |
|---|---|
| 8.058581 | -0.20568 |
| 6.31383 | -0.18826 |
| -3.37327 | -0.41444 |
| -0.99716 | 0.056627 |
| 1.231444 | -0.56155 |
| -3.35811 | -0.37384 |
| -5.60012 | 0.381664 |
| 7.265988 |
Table 5: Matrix layer for the input (hidden) layer to output layer.
| Feed Neural Network | ||||
|---|---|---|---|---|
| Tansig | Logstic | Multiplicity of Neurons in the hidden layer | ||
| R2 | RMSE | R2 | RMSE | |
| 0.061 | 0.166 | 0.9867 | 0.9867 | 2 |
| 0.9406 | 0.0591 | 0.9733 | 0.9733 | 3 |
| 0.9964 | 0.0164 | 0.9771 | 0.9771 | 4 |
| 0.9841 | 0.0345 | 0.9356 | 0.9356 | 5 |
| 0.8842 | 0.0839 | 0.9193 | 0.9193 | 6 |
| 0.9431 | 0.0593 | 0.9155 | 0.9155 | 7 |
| 0.845 | 0.0887 | 0.98939 | 0.98939 | 8 |
| 0.8752 | 0.0858 | 0.9391 | 0.9391 | 9 |
| 0.7985 | 0.1181 | 0.9443 | 0.9443 | 10 |
Table 6 : The amount of weight for the hidden layer to the output layer.
Conclusion
Artificial Neural Networks (RNA) are a technological tool consisting of a set of nodes and interactions that allow us to model different behaviors of a process Without the need for assumptions such as those required by conventional mathematical models, they have a similar function to the human brain through neurons and dendrites, and also have a great ability to learn and solve specific problems in various fields. The advantage of RNA is that it allows data analysis and parameterization through various learning Algorithms that facilitate the performance of training tests for the next prediction output values According to the input values by the simulations, in addition to the proposed models having dynamic systems adaptable to the process conditions, even in the event of a new situation, these responses are given in real time. This is why it is one of the main advantages compared to other systems for determining parameters. Due to the complexity and multiplicity of factors affecting the thermal change of tomato paste color and the results of this study, the proposed neural model can be introduced as an acceptable model for modeling these processes. By determining the activation function in neural networks, which in this study is the function of hyperbolic sigmoid tangent, and also having weight and bias values, the relationships created by the neural model can be extracted. By defining this simple mathematical relation created in computer software such as Excel, it is possible to create a practical, simple and accurate program to predict the desired parameters in changing the color of tomato paste. Due to the higher accuracy of the fuzzy- neural model than the response surface method in general, the prediction of these models can be trusted with much more confidence than the regression models and these models can be used to optimize and control the process of thermal discoloration of tomato paste. This can lead to energy and time savings and, on the other hand, create a more desirable end product.
References
- Anese M, Falcone P, Fogliano V, Nicoli MC, Massini R (2002) Effect of equivalent thermal treatments on the color and the antioxidant activity of tomato puree. J Food Sci 67:3442–3446
[Crossref] [Googlescholar] [Indexed]
- Chiang GH (1995) Process for products of improved flavor. United States Patent 5:436,022
- Joseph R, Wagner JR, Jackson CM (1967) Consistency of tomato Products: 1-The Effects of Tomato Enzyme Inhibition by Additives. Food Technol 21:114-117
- Jackson CM, Wagner JR, Sanshuck DW (1967) Consistency of tomato Products: Effect of pH During Extraction on Tomato Juice Consistency. Food Technol 21:117-120
- Basim AJ, Banat F, Jumah R, AL-Asheh S, Hammad S (2004) A comparative study of rheological characteristics of tomato paste and tomato powder solutions. Int J Food Prop 7:483–497
[Crossref] [Googlescholar] [Indexed]
- Bramley PM (2000) Is lycopene beneficial to human health? Phytochem 54:233–236
[Crossref] [Googlescholar] [Indexed]
- Anthon GE, Diaz JV, Barrett DM (2008) Changes in pectins and product consistency during the concentration of tomato juice to paste. J Agric Food Chem 56:7100–7105
[Crossref] [Googlescholar] [Indexed]
- Apaiah RK, Barringer SA (2001) Quality loss during tomato paste production versus sauce storage. J Food Process Preserv 25:237–250
[Crossref] [Googlescholar] [Indexed]
- Bayod E, Willers EP, Tornberg E (2008) Rheological and structural characterization of tomato paste and its influence on the quality of ketchup. LWT - Food Sci Technol 41:1289–1300
[Crossref] [Googlescholar] [Indexed]
- Barreiro JA, Milano M, Sandoval AJ (1997) Kinetics of colour change of double concentrated tomato paste during thermal treatment. J Food Eng 33:359- 371
[Crossref] [Googlescholar] [Indexed]
- Barrette DM, Garcia E, Wayne JE (1988) Textural modification of processing tomatoes. Crit Rev Food Sci Nutr 38:173-258
[Crossref] [Googlescholar] [Indexed]
- Boumendjel M, Samar M, Sabegh H, Houhamdi M, Boutebba A, et al. (2011) Heat treatment effect on the technological quality of processed tomato paste. Can J Chem Eng 3:27-40
- Canene-Adams K, Cambell JK, Zaripheh S, Jeffery EH, Erdman JW (2005) The tomato as a functional food. J Nutr 135:1226-30
[Crossref] [Googlescholar] [Indexed]
- Capanoglu E, Beekwilde J, Boyaciogl D, Hall R, de Vos R (2008) Changes in Antioxidant and Metabolite Profile during Production of Tomato Paste. J Agric Food Chem 56:964–973
[Crossref] [Googlescholar] [Indexed]
- Del Valle MM, Camara M, Torija MAE (2003) Effect of pomace addition on tomato paste quality. Acta Hort 613:399-405
[Crossref] [Googlescholar] [Indexed]
- Davies JN, Hobson GE (1981) The constituents of tomato genotype —The Influence of Environment, Nutrition, and Genotype. Crit Rev Food Sci Nutr 15: 205-208
[Crossref] [Googlescholar] [Indexed]
- Ciruelos A, Gonza´lez C, Latorre A, Ruiz RM, Rodrı´guez A (2001) Effect of heat treatment on the pectins of tomatoes during tomato paste manufacturing. Acta Horticulturae 542:181–185
- Chang CH, Liu YC (2007) Study on lycopene and antioxidant contents variations in tomatoes under air-drying process. J Food Sci 72:532–540
[Crossref] [Googlescholar] [Indexed]
- Dewanto v, Wu X, Adom KK, Liu RH (2002) Thermal processing enhances the nutritional value of tomatoes by increasing total antioxidant activity. J Agric food chem 50:3010-3014
[Crossref] [Googlescholar] [Indexed]
- Diaz JV, Anthon GE, Barrett DM (2007) Nonenzymatic degradation of citrus pectin and pectate during prolonged heating: effects of pH, temperature, and degree of methyl esterification. J Agric Food Chem 55:5131–5136
- Durak I, Birib H, Avci A, Sozen S (2003) Tomato juice inhibits adenosine deaminase activity in human prostate tissue from patient with prostate cancer. Nutr Res 23:1183–1188
[Crossref] [Googlescholar] [Indexed]
- Barrette DM, Garcia E, Wayne JE (1988) Textural Modification of Processing Tomatoes. Crit Rev Food Sci Nutr 38:173-258
[Crossref] [Googlescholar] [Indexed]
- Mohammadi Ash, Rafiee Z, Emam-Djomeh, Keyhani AR (2008) Kinetic models for color changes in kiwifruit slices during hot air drying. World J Agric Sci 4:376-383
[Googlescholar] [Indexed]
- Antonio GC, Alves DG, Azoubel PM, Murr FEX, Park KJ (2008) Influence of osmotic dehydration and high temperature short time processes on dried sweet potato (Ipomoea batatas Lam.). J Food Eng 84:375–382
[Crossref] [Googlescholar] [Indexed]
- Poligne I, Broyart B, Trystram G, Collignal A (2002) Prediction of mass transfer kinetics and product quality changes during a dehydration–impregnation–soaking process using artificial neural net-works. Application topork curing. Lebensm Wiss Technol 35:748–756
[Crossref] [Googlescholar] [Indexed]
- Dębska B, Guzowska-Świder B (2011) Application of artificial neural network in food classification. Anal Chim Acta 705:283–291
[Crossref] [Googlescholar] [Indexed]
- Hajimahmoodi M, Khanavi M, Sadeghpour O, Ardekani M, Mazde F, et al. (2016) Application of organic acid based Artificial Neural Network modeling for assessment of commercial vinegar authenticity. Food Anal Methods 9:3451–3459
[Crossref] [Googlescholar] [Indexed]
- Ragone S, Zelasco E, Perri C, Montemurro R, Valentini D, et al. (2017) Cultivar classification of Apulian olive oils: Use of artificial neural networks for comparing NMR, NIR and merceological data. Food Chem 219:131–138
[Crossref] [Googlescholar] [Indexed]
- Tanajura da Silva CE, Filardi VL, Pepe IM, Chaves MA, Santos CMS (2015) Classification of food vegetable oils by fluorimetry and artificial neural networks. Food Control 47:86–91
[Crossref] [Googlescholar] [Indexed]
- Hauser-Davis RA, Oliveira TF, Silveira TM, Silva TB, Ziolli RL (2010) Case study: Comparing the use of nonlinear discriminating analysis and Artificial Neural Networks in the classification of three fish species: Acaras (Geophagus brasiliensis), tilapias (Tilapia rendalli) and mullets (Mugil liza). Ecol Inform 5:474–478
[Crossref] [Googlescholar] [Indexed]
- Cevoli C, Cerretani L, Gori A, Caboni MF, Gallina Toschi T, et al. (2011) Classification of Pecorino cheeses using electronic nose combined with artificial neural network and comparison with GC–MS analysis of volatile compounds. Food Chem 129:1315–1319
[Crossref] [Googlescholar] [Indexed]
- Almeida PF, Alves WAL, Farias TMB, Santana JCC (2012) Elaboraciony clasificacion sensorial de gelatinas de patas de pollos: Correlación usando redes neuronales artificiales. Inf Tecnol 23:129–136
[Crossref] [Googlescholar] [Indexed]
- Anjos O, Iglesias C, Peres F, Martínez J, García A, et al. (2015) Neural networks applied to discriminate botanical origin of honeys. Food Chem 175:128–136
[Crossref] [Googlescholar] [Indexed]
- Muniz-Valencia R, Jurado JM, Ceballos-Magana SG, Alcázar A, Hernandez-Diaz J (2014) Characterization of Mexican coffee according to mineral contents by means of multilayer perceptrons artificial neural networks. J Food Compos Anal 34:7–11
[Crossref] [Googlescholar] [Indexed]
- Lertworasirikul S, Saetan S (2010) Artificial neural network modeling of mass transfer during osmotic dehydration of kaffir lime peel. J Food Eng 98:214–223
[Crossref] [Googlescholar] [Indexed]
- Giovannucci E, Rimm EB, Liu Y, Stampfer MJ, Willett WC (2002) A prospective study of tomato products lycopene, and prostate cancer risk. J Natl Cancer Inst 94:391–398
[Crossref] [Googlescholar] [Indexed]
- Linko P, Zhu YH (1991) Neural networkprogramming in bioprocess variable estimation and state prediction. J Biotechnol 21:253–270
[Crossref] [Googlescholar] [Indexed]
- Bla Zita NE, Emmanuel N, Patrice K, Ismael D, Benjamin Y (2009) Modeling of Osmotic Dehydration of Mango (Mangifera Indica) byRecurrent ArtificialNeural Network andExperimental Design. J Agric Boil Sci 5:754-761
[Googlescholar] [Indexed]
- Goodman CL, Fawcett S, Barringer SA (2002) Flavor, viscosity, and color analyses of hot and cold break tomato juices. J Food Sci 67:404–408
[Crossref] [Googlescholar] [Indexed]

Open Access Journals
- Aquaculture & Veterinary Science
- Chemistry & Chemical Sciences
- Clinical Sciences
- Engineering
- General Science
- Genetics & Molecular Biology
- Health Care & Nursing
- Immunology & Microbiology
- Materials Science
- Mathematics & Physics
- Medical Sciences
- Neurology & Psychiatry
- Oncology & Cancer Science
- Pharmaceutical Sciences