ISSN : 2349-3917
American Journal of Computer Science and Information Technology
Modeling of Climate Effect on Arable Crops Production of Oryza sativa and Zea mays in Nigeria Using Fuzzy Logic
Gilbert Aimufua1*, Akimoh JO2, Jegede AJ3 and Owate PA4
1Department of Computer Science, Nasarawa State University, Keffi, Nigeria
2Department of Computer Science, Federal Polytechnic, Nasarawa, Nigeria
3Department of Computer Science, University of Jos, Jos, Nigeria
4Department of Computer Science, Lagos State University, Ojo, Nigeria
- *Corresponding Author:
- Gilbert Aimufua
Department of Computer Science,
Nasarawa State University,
Keffi,
Nigeria;
E-mail: aimufuagio@yahoo.com
Received date: December 16, 2022, Manuscript No. IPACSIT-22-15417; Editor assigned date: December 19, 2022, PreQC No. IPACSIT-22-15417 (PQ); Reviewed date: January 03, 2023, QC No. IPACSIT-22-15417; Revised date: March 16, 2023, Manuscript No. IPACSIT-22-15417 (R); Published date March 24, 2023, DOI: 10.36648/2349-3917.11.5.1
Citation: Aimufua G, Akimoh JO, Jegede AJ, Owate PA (2023) Modeling of Climate Effect on Arable Crops Production of Oryza sativa and Zea mays in Nigeria Using Fuzzy Logic. Am J Compt Sci Inform Technol Vol:11 No:5
Abstract
The production of food, especially rice and maize, has been negatively impacted by climate change in Nigeria, where farmers make up one-third of the workforce. The government and other relevant stakeholders' initiatives and efforts to address the impact on agricultural activities have had limited success because they are the primary staple foods in the nation. High precipitation owing to moisture levels negates agricultural yields, according to the impacts of temperature and moisture levels on agriculture productivity. Weather disasters, deforestation, disease transmission and species extinction are all climate variables that limit agricultural production rates. The goal of this research is to use machine learning algorithms to determine the best weather conditions for arable crops. To model and predict agricultural yields, fuzzy logic was used. Secondary data, pre-processing and processing, modeling, and the user interface are the five sections that make up the system design. The harvesting outcomes for each of the months specified from January through December, the majority of the data obtained revealed harvest values of low (54.8%), fair (23.6%) and good (21.5%) quality. Agricultural activities should be carried out between May and September, whereas crops that require a lot of rain should be sown between July and August when rainfall is at its highest. The study concluded that agricultural operations should be carried out between May and September in order to achieve good harvest quality, based on the data collected, extracted, and assessed. The findings of the study will guide policymakers and farmers toward a bumper harvest, increased income, and a rise in the country's GDP. Finally, crops that require a lot of rain, like rice, should be planted between July and August, according to the research.
Keywords
Climate change; Fuzzy logic; Agricultural yield; Machine learning algorithm; Rainfall
Introduction
Humanity has relied on the earth's bountiful resources for vital needs, survival and nutrition since the dawn of time. Humans continue to seek safe and suitable living situations with fundamental necessities such as clean air, water, food and shelter. This always has negative consequences for the environment. As a result, governments around the world are working to establish legislation and sign international treaties to protect and improve the environment for the sake of their citizens' well-being. However, due to the detrimental effects of climate change on agriculture, climate change has remained a severe environmental concern, making it harder to tackle poverty, sickness and hunger.
The majority of people on the planet eat rice, wheat, maize, millet, sorghum, potatoes, cassava, yams, and animal products like meat, milk, eggs, cheese, and fish. Rice (Oryza sativa) and maize (Zea mays) are both grown in a variety of agro-ecological conditions around the world. In Sub-Saharan Africa, they are key cereal crops, as well as important staple crops in Nigeria. Rice (Oryza sativa) is one of the world's most significant crops, directly feeding more people than any other crop. Rice is a Nigerian staple cuisine that has gained popularity among Nigerians over the years, particularly in urban areas, displacing several traditional staple foods from the Nigerian menu. Rice can be produced in many parts of the country where rice is grown in irrigated lowland areas.
Maize (Zea mays), the world's third largest cereal grain after wheat and rice, is another major staple food in Nigeria [1]. Nigeria produced more corn in 2021 than it did in 1960 when the country gained independence [2].
In Nigeria, farmers account for more than a third of the workforce. These farmers toil tirelessly to produce crops for human survival such as rice, maize, sorghum, almonds, rice, and soybeans. 88% of all farmers in Nigeria are smallholders. They produce fewer crops than their competitors due to their limited land space [3]. Small scale farmers, on the other hand, grow almost 70% of Nigeria's food, according to the food and agriculture Organization, but their crops are increasingly exposed to harsh weather linked to climate change [4]. As a result of the effects of climate change, agricultural activity in Nigeria has recently dwindled. Low productivity and insufficient earnings from agricultural activities have had an impact on farmers. Traditional study findings are difficult to extrapolate to all conceivable fields since they are dependent on specific soil types, climatic circumstances, and background management combinations that aren't relevant or applicable to all farms [5].
Trends in Nigeria's six geopolitical zones reflect changes in the climatic environment, which have resulted in upheavals ranging from droughts to flooding coastal areas to the loss of agricultural lands. These shifts frequently serve as key catalysts for conflict across the country. Poor populations and fragile states in Northern Nigeria have been particularly hard struck by climate change and resource constraints [6]. Drought caused by climate change, exacerbated by insecurity concerns such as insurgency and banditry, is hastening desertification and destroying farmlands and forests in most of the region's states. This can sometimes devolve into a shortage of resources and violent disputes, posing a threat to internal security.
A predicting system is an approach to learning from the past such that historical data is obtained and evaluated in order to comprehend past behavior, which may be utilized to forecast likely future behavior [7]. Any event prediction demands an understanding of historical results. In most cases, historical data is used to identify previous patterns. While learning from the past can help in predicting the future to some extent. Vaidehi, et al. asserted that historical data gives information on the specific pattern of learning of data. Fuzzy logic models have been developed in numerous studies to predict a variety of events, including the likelihood of traffic accidents, stock market fluctuations, strokes, and rainfall.
Despite the government's and other relevant stakeholders' strategies and measures to address climate change's impact on agricultural activities in Nigeria, the country has continued to be threatened by climate change, which has had negative effects on food production, particularly rice and maize, which are major staple foods in Nasarawa state. The impact of climate change on rice and maize production in Nasarawa state was examined against this backdrop in this study. The findings indicate that the most reasonable time in which climate change would not affect the planting of rice and maize production for maximal yield is between May and September.
Literature Review
Machine learning allows for self-learning and has been proven to be effective in data mining and agricultural analysis, such as crop production prediction. Crop production can be predicted using historical data, weather and soil parameters, and organic data, among other factors. Various studies on climate change in relation to machine language algorithms, global warming, agriculture, and national security have been done in recent years. According to the work of which centered on climate forecasting using production functions and the "Ricardian Model" that measures the impact of climate change on the value of land resources [8]. The study concluded that global efforts to regulate Greenhouse Gas (GHG) emissions should be maintained in order to reduce the detrimental effects of rising temperatures on rice and maize harvests. Furthermore, Ganesh’s findings revealed that, due to limited government support, there had been low harvest despite no modifications in planting/harvesting times or agricultural instruments utilized. It becomes imperative in using fuzzy logic to predict the most reasonable planting/harvesting period in order to improve yield.
According to Tarfa, et al. as the volume of rainfall decreases, the temperature rises owing to climate change, resulting in severe effects on agricultural productivity and affecting people's livelihoods in Nasarawa state, Nigeria. Furthermore, Chikezie, et al. discovered an inconsistent climatic trend with peak points throughout the study period. Using the Augmented Dickey-Fuller test for unit root, it was discovered that the outputs of yam, maize, and cassava were non-stationary before differencing. In order to attain appreciable crop productivity, the authors recommended that the government take suitable mitigation and adaptation measures to reduce the consequences of climate change.
According to Muhammad, as temperature and weather disasters rise to their peak levels, farm production falls to its lowest point. The impacts of rising temperature are balanced by the quantity of available water, indicating that temperature and water availability have a homogenous influence on agriculture productivity. In addition, the impacts of temperature and monsoon level on agricultural productivity show that heavy precipitation caused by the monsoon level decreases agricultural production. Furthermore, medium agriculture productivity is produced by moderate temperature and pure water availability as a result of moderate monsoon levels. Climate variables such as weather disasters, deforestation, disease spread, and species extinction impact agricultural output rates, according to the researcher.
Upadhya and Mathew, using a suitable model, projected the impact of climate variations on agricultural production output. Crop yield was calculated using a fuzzy logic based model, with temperature, humidity, and soil moisture as input parameters, and the "Trapezoidal membership function" factored into the fuzzy logic modeling. The scientists used a theoretical framework to confirm that air humidity of 65-75 percent, the temperature of 18℃-290℃, and soil wetness of 60%-80% result in good crop yield. However, the research focused on vegetable crops rather than cereals like maize and rice.
Monda investigated the "impact of climatic variability on Aman rice production using fuzzy logic" and found that temperature and rainfall are important factors in rice planting and harvesting. The authors discovered the effect of temperature on rice production, but they failed to link their findings to the process. Furthermore, the authors ignored the influence of temperature and rainfall on climate change on rice yield by employing fuzzy logic.
Using fuzzy logic, Shahjala investigated the effects of climate change and natural catastrophes on agricultural harvest in Bangladesh, which results in massive losses for farmers. According to the research, as temperatures and weather disasters rise to their peak levels, the harvest falls to its lowest point. The authors, on the other hand, overlooked the impact of humidity, water, and temperature on crop productivity, which this study aims to investigate. Hossain investigated the effects of climate change on farmland value in Bangladesh, finding that farmer farmland values are sensitive to climate change.
Temperature and rainfall are the primary drivers of farm production, and climate is a key influence on agricultural productivity. Climate change would, in essence, have a substantial impact on agricultural harvest [9]. Surprisingly, the impact of climate change on-farm harvest varies dramatically throughout time and geography. Within and among regions, there is significant geographic disparity, especially in tropical and non-industrialized countries, as well as arable and semi-arable land. Ojo and Baiyegunhi investigated the drivers of Climate Change Perception (CCP), the level of perception, and its impact on rice farmers' net farm revenue in South-West Nigeria, which has arable lands. Nasarawa state, in Nigeria's middle belt, is a semi-arid territory with variable degrees of spatial fluctuation in terms of rainfall and temperature. As a result, the goal of this study is to determine the influence of climate change on agricultural productivity in Nigeria's Nasarawa state [10].
Methodology
As shown in Figure 3, the system design consists of five components. The first three are secondary data collection, structure data, data pre-processing, and processing. Modeling and user interface are the last two sections, which are numbered 4 and 5.

Figure 1: System design architecture.
The secondary data was obtained from NiMet (Nigerian Meteorological agency) in Abuja, and structured data was extracted. Pre-processing and processing are the third and final parts of the procedure. Pre-processing is a method of cleansing unstructured data that has been acquired [11]. The data was pre-processed before being modeled with data mining tools and fuzzy logic.
The fuzzy logic system framework is shown in Figure 2.

Figure 2: Fuzzy logic system framework.
The build classifier system was used to model fuzzy logic in this work. One of the most widely used tools in data mining is constructing classifier systems. These systems are fed a set of cases, each of which belongs to one of a few classes. This is referred to as its significance for a collection of characteristics, and it results in a classifier that can accurately predict the class to which a new example belongs. Controlled machine learning methods enable the assignment of a group of data, particularly the input variable, to a target class, which is the harvest measure for "Poor, Fair, and Good". To achieve the modeling purpose, the Fuzzy logic model employs a triangle membership function with the help of equations (1) and (2).
Mathematical model
Equation (1) stated below

Where, μv (x) is the membership function of x in V and μv is the degree membership of x in v interval of (0, 1).
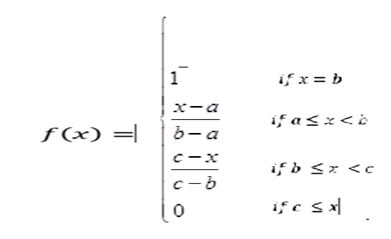
Where a, b and c, are points in the triangle called triangular membership functions. The fuzzification of the variable is shown in Table 1.
| Variable name | Real values | Crisp internal values | Fuzzified values |
|---|---|---|---|
| (a) | (b) | (c) | (d) |
| Rainfall | 0 | (0 2.0 4.0) | Poor |
| 1 | (4.0 6.0 8.0) | Fair | |
| 2 | (8.0 10.0 12.0) | Good | |
| Temperature | 0 | (0 2.0 4.0) | Poor |
| 1 | (4.0 6.0 8.0) | Fair | |
| 2 | (8.0 10.0 12.0) | Good | |
| Humidity | 0 | (0 2.0 4.0) | Poor |
| 1 | (4.0 6.0 8.0) | Fair | |
| 2 | (8.0 10.0 12.0) | Good | |
| Harvest | 0 | (0 2.0 4.0) | Poor |
| 1 | (4.0 6.0 8.0) | Fair | |
| 2 | (8.0 10.0 12.0) | Good |
Table 1: Fuzzification of the variables.
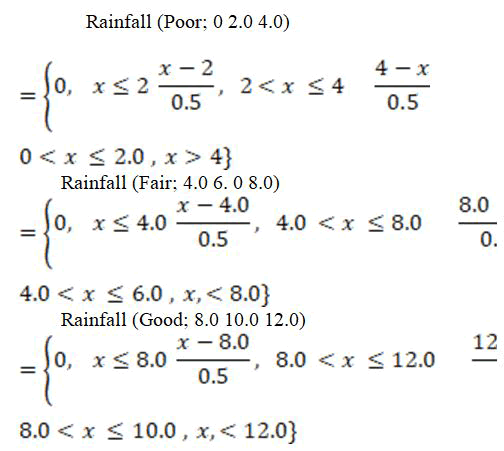
Applying equation (ii) the following is derived:
Rainfall=Poor (0 2.0 4.0), Fair (4.0 6.0 8.0) and Good (8.0 10.0 12.0)
The generation of antecedent (IF component) and consequent (Then portion) sections of if then rules of the inference engine was used to generate fuzzy rules. (Harvest=value) IF (Rainfall=value and Temperature=value AND Humidity=value).
Using a fuzzy logic system, rules are formed as xn=27 with three variables of n, (n) as input and three parameters of x, (x) as output. This suggests that the task has 27 rules. For instance, IF (rainfall=poor and temperature=poor and humidity=poor) then (harvest=Poor); IF (rainfall=poor and temperature=fair and humidity=poor) then (harvest=Poor); IF (rainfall=good and temperature=good and humidity=good) then (harvest=Good).
Fuzzification of variables
The membership functions were used to fuzzify the specified input variables in order to determine their degree of membership. As a result, the clear quantities became fuzzy values [12,13]. The output value supplied in the individual rules was then mapped to an intermediate output measuring fuzzy sets.
Defuzzification of variables
After the fuzzified, defuzzified variables were utilized to map the actual value to the parameters, the harvest value was defuzzified by mapping the crisp value back to its true value after all the fuzzified variables were taken into account. We now have 27 rules derived from all permutations for various linguistic variables, each with three parameters. Table 2 shows the rules in detail.
| Nos. | Rainfall | Temperature | Humidity | Harvest |
|---|---|---|---|---|
| (a) | (b) | (c) | (d) | (e) |
| 1. | Poor | Poor | Poor | Poor |
| 2. | Poor | Poor | Fair | Poor |
| 3. | Poor | Poor | Good | Poor |
| 4. | Poor | Fair | Poor | Poor |
| 5. | Poor | Fair | Fair | Poor |
| 6. | Poor | Fair | Good | Fair |
| 7. | Poor | Good | Poor | Poor |
| 8. | Poor | Good | Fair | Fair |
| 9. | Poor | Good | Good | Fair |
| 10. | Fair | Poor | Poor | Poor |
| 11. | Fair | Poor | Fair | Poor |
| 12. | Fair | Poor | Good | Fair |
| 13. | Fair | Fair | Poor | Poor |
| 14. | Fair | Fair | Fair | Fair |
| 15. | Fair | Fair | Good | Fair |
| 16. | Fair | Good | Poor | Fair |
| 17. | Fair | Good | Fair | Fair |
| 18. | Fair | Good | Good | Good |
| 19. | Good | Poor | Poor | Poor |
| 20. | Good | Poor | Fair | Fair |
| 21. | Good | Poor | Good | Fair |
| 22. | Good | Fair | Poor | Fair |
| 23. | Good | Fair | Fair | Fair |
| 24. | Good | Fair | Good | Good |
| 25. | Good | Good | Poor | Fair |
| 26. | Good | Good | Fair | Good |
| 27. | Good | Good | Good | Good |
Table 2: Defuzzification of variables.
Knowledge warehouse
The fuzzy logic model and the database are both part of the knowledge warehouse. It is made up of both structured and unstructured issue domain knowledge. It is made up of facts and data collection rules compiled by experts in the subject. The facts have an impact on the rules, allowing the harvest to make judgments based on the data.
Results and Discussion
To demonstrate the correctness of the finding, data is provided in the form of a table and graph. It's vital to note that the monthly harvest was modeled using fuzzy logic in this study (Table 3).
| Parameter | Jan | Feb | Mar | Apr | May | Jun | Jul | Aug | Sep | Oct | Nov | Dec | Percentage (%) | |
|---|---|---|---|---|---|---|---|---|---|---|---|---|---|---|
| Rainfall | Poor | 11 | 9 | 6 | 4 | 2 | 1 | 0 | 3 | 2 | 6 | 9 | 12 | 45.10% |
| Fair | 0 | 2 | 3 | 3 | 3 | 4 | 3 | 3 | 2 | 5 | 2 | 0 | 20.80% | |
| Good | 1 | 1 | 3 | 5 | 7 | 7 | 9 | 6 | 8 | 1 | 1 | 0 | 34.00% | |
| Temperature | Poor | 4 | 9 | 9 | 7 | 2 | 0 | 0 | 3 | 3 | 7 | 9 | 10 | 43.70% |
| Fair | 7 | 2 | 1 | 3 | 2 | 3 | 4 | 2 | 0 | 3 | 3 | 2 | 22.20% | |
| Good | 1 | 1 | 2 | 2 | 8 | 9 | 8 | 7 | 9 | 2 | 0 | 0 | 34.00% | |
| Humidity | Poor | 7 | 7 | 9 | 6 | 0 | 2 | 1 | 2 | 2 | 0 | 4 | 9 | 34.00% |
| Fair | 5 | 3 | 2 | 5 | 6 | 4 | 3 | 0 | 6 | 9 | 7 | 2 | 36.10% | |
| Good | 0 | 2 | 1 | 1 | 6 | 6 | 8 | 10 | 4 | 3 | 1 | 1 | 29.80% | |
| Harvest | Poor | 10 | 11 | 8 | 5 | 10 | 2 | 3 | 1 | 0 | 7 | 10 | 12 | 54.80% |
| Fair | 2 | 1 | 2 | 7 | 2 | 3 | 3 | 5 | 5 | 2 | 2 | 0 | 23.60% | |
| Good | 0 | 0 | 2 | 0 | 0 | 7 | 6 | 6 | 7 | 3 | 0 | 0 | 21.50% | |
| Total | 12 | 12 | 12 | 12 | 12 | 12 | 12 | 12 | 12 | 12 | 12 | 12 | 100% | |
Table 3: Monthly yields.
The purpose of employing fuzzy logic is to achieve the best results possible. Because of its parallel use, the neuro-fuzzy technique provides adaptive learning capability. It's also an excellent tool for e-Presentation, analysis and interpretation of data evaluation, modeling, and prediction employing fuzzy logic, resulting in increased efficiency in implementation [14,15].
The variables used to measure monthly harvest in the given area are listed in Table 3. rainfall, temperature and humidity are the factors considered. Each variable was graded on a scale of bad, fair and excellent. Harvest is rated as bad, fair or excellent. The months of the year under consideration are labeled January through December.
Table 3 shows the rainfall totals for the indicated months of January to December. The findings revealed that the majority of the data obtained showed bad rainfall (45.1%), followed by fair rainfall (20.8%), and good rainfall (10.9%), (34.0%). The majority of the datasets considered from January to December had weighted bad rainfall, according to Table 3.
Furthermore, the temperature results for the specified month of January, February, March, to December demonstrated that the majority of the dataset obtained revealed. The temperature of poor values (43.7%), followed by temperature of fair value (22.2%) and temperature of high value (34.0%). The bulk of the datasets selected from January, February, March, April and December had weighted bad temperatures [16].
In addition, the humidity results for the designated months of January, February, March, April and December demonstrated that the majority of the dataset obtained revealed. Humidity of poor value (34.0%) was followed by humidity of middling value (36.1%) and Humidity of good value (29.8 percent) [17]. Table 3 shows that the bulk of the datasets selected from January to December had weighted fair humidity.
Finally, the harvest results for the specified months of January, February, March, April, and December revealed that the bulk of the dataset obtained showed harvest of bad values (54.8%), fair harvest (23.6%) and good harvest (21.5%). The majority of the dataset obtained from January, February, March, April and December had weighted poor harvest, as indicated in Table 3. The value of a good harvest is compared to the value of good rainfall in Figure 3.

Figure 3: Comparison between good harvest and good rainfall dataset values.
Figure 3 depicts a comparison of good harvest and good rainfall dataset values, revealing that the climate conditions for farming activities are always favourable from May to September every year. The graph showed that beginning in May each year, rainfall is consistently higher than in prior months. This agronomically favourable climate lasted through August, but rainfall began to decline in September [18,19]. Also, according to the graph, agricultural activities should be carried out between May and September, whilst crops that require a lot of rain should be shown between July and August because that is when the most rain falls.
Fuzzy logic output
When correlating rainfall with temperature, the graphical model result for the harvest is shown in Figure 4. The figure illustrates that the good is negligible in comparison to the poor and equitable. The impoverished, on the other hand, enjoy the greatest harvest [20].

Figure 4: A fuzzy logic graphical model result obtained for the harvest when comparing the rainfall with temperature.
When comparing humidity with rainfall, Figure 5 shows the graphical model outcome for the harvest. The figure illustrates that when compared to the poor and fair, the good is quite small. The impoverished, on the other hand, enjoy the greatest harvest.

Figure 5: A fuzzy logic graphical model result obtained for the harvest when compared the humidity with rainfall.
Conclusion
The effects of climate change on the timing period of planting and harvesting of rice (Oryza sativa) and maize (Zea mays) had been of challenge in the Nigerian context. According to the findings, the fuzzy logic model projected that the environment will be favourable for farming activities from May to September every year. The model found that beginning in May of each year, rainfall is consistently higher than in the months preceding May, indicating that temperature and humidity conditions are favourable for farming and planting. This farming friendly climate lasted until August, but there will be a steady declination in September. As a result of this research, the optimal months for agricultural and planting operations are from May through September.
Furthermore, more studies should be done utilizing other classification algorithms and other data mining techniques for analysis and predictions, such as naive Bayes classifiers, genetic algorithms, artificial neural networks, and so on, to confirm the correctness of the models.
The study concluded that agricultural operations should be carried out between May and September in order to achieve good harvest quality, based on the data collected, extracted, and assessed. The findings of the study should assist policymakers and farmers in reaching a bumper harvest, increased income, and an increase in the country's GDP. Finally, crops that require a lot of rain, like rice, should be planted between July and August, according to the study.
References
- Jamil M, Sahana M, Sajjad H (2018) Crop suitability analysis in the Bijnor District, UP, using geospatial tools and fuzzy analytical hierarchy process. Agric Res 7:506-522
- Aggarwal S, Srinivas R, Puppala H, Magner J (2022) Integrated decision support for promoting crop rotation based sustainable agricultural management using geoinformatics and stochastic optimization. Comput Electron Agric 200:107213
- Danvi A, Jutten T, Giertz S, Zwart SJ, Diekkruger B (2016) A spatially explicit approach to assess the suitability for rice cultivation in an inland valley in central Benin. Agric Water Manag 177:95-106
- Sumaryanti L, Lamalewa L, Istanto T (2019) Implementation of fuzzy multiple criteria decision making for recommendation paddy fertilizer. Int J Mech Eng Technol 10:236-243 [Crossref]
- Sarkar B, Das P, Islam N, Basak A, Debnath M, et al. (2021) Land suitability analysis for paddy crop using GIS based Fuzzy-AHP (F-AHP) method in Kochbihar district, West Bengal. Geocarto Int 17:1-27
- Murakami M, Ae N, Ishikawa S (2007) Phytoextraction of cadmium by rice (Oryza sativa L.), soybean (Glycine max (L.) Merr.), and maize (Zea mays L.). Environ Pollut 145:96-103
[Crossref] [Google Scholar] [PubMed]
- Potshangbam M, Devi SI, Sahoo D, Strobel GA (2017) Functional characterization of endophytic fungal community associated with Oryza sativa L. and Zea mays L. Front Microbiol 8:325
[Crossref] [Google Scholar] [PubMed]
- Ellis JM, Griffin JL, Linscombe SD, Webster EP (2003) Rice (Oryza sativa) and corn (Zea mays) response to simulated drift of glyphosate and glufosinate. Weed Technol 17:452-460
- Abbade EB (2021) Estimating the potential for nutrition and energy production derived from maize (Zea mays L.) and rice (Oryza sativa L.) losses in Brazil. Waste Manag 134:170-176
[Crossref] [Google Scholar] [PubMed]
- Ganesh B (2021) The Perception of farmers on climate change and existing adaptation practices in Myagdi district of nepal. Master’s Thesis presented to Ritsumeikan Asia Pacific University.
- Adebanjo OM (2013) The effects of climate change adaptation strategies on food crop production efficiency in Southwestern Nigeria. Being a PhD Thesis Submitted to Department of Agricultural Economics, University of Nigeria, Nsukka.
- Onuoha FC (2014) Environmental degradation, livelihood and conflicts: A focus on the implications of the diminishing water resources of lake chad for North-Eastern Nigeria. Afr J Confl Resolut 8:35-61
- Rahman MA (2020) Improvement of rainfall prediction model by using fuzzy logic. Am J Clim. 9:391-399
- Upadhya SM, Mathew S (2020) Implementation of fuzzy logic in estimating yield of a vegetable crop. J Phys Conf Ser 1427:012013
- Tarfa PY, Ayuba HK, Onyeneke RU, Idris N, Nwajiuba CA, et al. (2019) Climate change perception and adaptation in Nigeria’s guinea savanna: Empirical evidence from farmers in Nasarawa state, Nigeria. Appl Ecol Environ Res 17:7085-70112
- Chikezie C, et al. (2015) Effect of climate change on food crop production in southeast, Nigeria: A co-integration model approach. Int J Weather Clim Chang Conserve Res 2:47-56
- Kehinde AL, et al. (2013) Effects of climate change on rice and maize production in Nigeria from 1970–2013. J Sustain Dev 7:1-6
- Monda HS, Shahadat MK, Shikha ZA, Hossain MM (2020) Impact of climatic variability on Aman rice production using fuzzy logic. Int J Sustain Agric Manag Inform 6:123–134
- Shahjala M, Alam MZ, Miah SS, Chowdhury AH (2021) Fuzzy logic approach for identifying the effects of climate change on agricultural production. Int J Agric Econ 6:181-192
- Ojo TO, Baiyegunhi IJS (2021) Climate change perception and its impact on net farm income of smallholder rice farmers in South-West, Nigeria. J Clean Prod 310:12737

Open Access Journals
- Aquaculture & Veterinary Science
- Chemistry & Chemical Sciences
- Clinical Sciences
- Engineering
- General Science
- Genetics & Molecular Biology
- Health Care & Nursing
- Immunology & Microbiology
- Materials Science
- Mathematics & Physics
- Medical Sciences
- Neurology & Psychiatry
- Oncology & Cancer Science
- Pharmaceutical Sciences