Male Hypogonadism And Erythropiotine Stmulating Agents Hyporesponsiveness In Chronic Heamodialysis Patient
Hassan Abd-Alhady Ahmed1, Mahmoud Mohamed Emara1, Khaled Mohamed Al Zorkany1 and Eslam Hassan Mohamed EL Araby2*
1Department of Medicine, Menoufia University, Al Minufiyah, Egypt
2Department of Urology and Nephrology, Mansoura Insurance Hospital, Dakahlia, Egypt
- *Corresponding Author:
- Eslam Hassan Mohamed EL Araby Department of Urology and Nephrology, Mansoura Insurance Hospital, Dakahlia, Egypt, Tel: 1004623621; E-mail:samsomty6066@gmail.com
Received: October 14, 2019, Manuscript No. IPJMRHE-19-2722; Editor assigned: October 16, 2019, PreQC No. IPJMRHE-19-2722 (PQ); Reviewed: October 30, 2019, QC No. IPJMRHE-19-2722; Revised: November 30, 2022, Manuscript No. IPJMRHE-19-2722 (R); Published: December 28, 2022, DOI: 10.36648/2393-8862.6.6.24
Citation: Araby EHME, Ahmed HAA, Emara MM, Zorkany KMA (2022) Male Hypogonadism and Erythropiotine Stmulating Agents Hyporesponsiveness in Chronic Heamodialysis Patient. J Med Res Health Educ. Vol: 6 No: 6:24
Abstract
Background: Patients with end-stage renal disease undergoing Hemodialysis (HD) commonly experience derangements in the hypothalamic-pituitary-gonadal axis together with alterations at the level of synthesis and clearance of many hormones. It has been speculated that testosterone stimulates erythropoiesis. The present study aims to study the effect of testosterone deficiency on the responsiveness to ESA therapy in the management of anemia in chronic HD male patients.
Patient and Methods: This was case control study included 60 male End Stage Renal Disease patients on regular heamodialysis from the Heamodialysis Unite of Mansoura Insurance Hospital/Egypt and 20 healthy control individuals. Venous blood samples were obtained directly through artrio venous fistula of the patients and from the veins of the arm of the controls. Lipid profile, kidney function test, serum iron, ferritine, IBC, intact PTH and serum testosterone level were tested.
Results: There were a significant lower Hb level and a significant higher ferritin level in studied HD patients compared to controls. Also, the studied patients showed higher cholesterol and triglyceride levels compared with controls. Nearly two third (63%) of the included patients had HCV infection. Testosterone level was significantly lower in HD patients compared to controls with significant negative correlation with age. 53.5% of patients showed sufficient testosterone level (>10 nmol/L) and 46.7%showed deficient level (<10 nmol/L). There was a significant difference between both groups according to patient's age and the sexual function. Most of the patients (53.3%) were receiving <12.000 unit of EPO/week and 46.7% were treated by ≥ 12.000 unit. In addition, patients with higher dose of EPO therapy showed significant lower HB levels. ERI was calculated in all patients and its range was 11.53-35.35 with mean ± SD of 20.06 ± 5.24. The patient group with higher ERI (>18.7) showed a significant lower body weight, BMI, dry body weight, Hb level and serum ferritin level compared to those with lower ERI group. The result of logistic regression concerning testosterone deficiency showed that testosterone deficiency was significantly associated with age (OR: 1.186; 95% CI: 1.059-1.329).
Conclusion: This study showed that deficiency of testosterone is common among studied patients with HD and is related to the sexual dysfunction, however it is not related to ERI among those patients.
Keywords
Dialysis; End stage renal disease; Hypogonadism; Testosterone
Abbreviations:
SD: Standard Deviation; P: Probability; IQR: Interquartile Range
Introduction
Patients with end-stage renal disease undergoing Hemodialysis (HD) commonly experience derangements in the hypothalamic-pituitary-gonadal axis together with alterations at the level of synthesis and clearance of many hormones.
This hormonal imbalance, even if asymptomatic, has recently been associated with poor outcome in those patients [1].
Testosterone is one of the hormones that were reportedly found to be deficient in HD patients. Low serum testosterone concentration may be a modifiable risk factor for adverse outcomes and poor quality of life in male HD patients [2]. It was also found that treatment with cinacalcet decreases serum total and free testosterone concentration in male hemodialysed patients with chronic kidney disease and secondary hyperparathyroidism [3]. Anemia is the most common hematologic complication in End-Stage Renal Disease (ESRD). It is ascribed to decreased erythropoietin production, shortened Red Blood Cell (RBC) lifespan, and inflammation [4].
It has been speculated that testosterone stimulates erythropoiesis. Another study recognized a statistical significant positive correlation between testosterone and hemoglobin was found in men undergoing HD. In addition, it was found that testosterone as a determinant of muscle mass in HD men [5]. So, the present study aimed to study the effect of testosterone deficiency on the responsiveness to ESA therapy in the management of anemia in chronic HD male patients [6].
Materials and Methods
This case control study included 60 male ESRD patients on regular heamodialysis and 20 healthy control individuals. Patient were selected from the Heamodialysis Unite of Mansoura Insurance Hospital/Egypt during the period from March 2018 to December 2018 [7]. Written concent is taken from evry individual enrolled in the study and the study was approved by the local medical ethical committe of the hospital [8]. Patients were selected on the basis of the following inclusion criteria: male patients between 18-50 years, maintenance HD for more than 6 months with each dialysis session lasting 3-4 hours using bicarbonate dialysate., receiving erythropoitine to treat anemia for at least 3 months, and patient with adequate iron stores (transferrin saturation tsat of >20% and (serum ferritin level of >100 ng/ml) [9]. Patients with obesity, alcohol intake and smoking, chronic diseases e.g. connective tissue diseases, decompensated cirrohosis and heart failure, endocrinal diseases including diabetes mellitus, active bleeding, history of blood transfusion within the past 3 months, patients under testosterone therapy, and drug that interfere with sex hormone synthesis e.g. statins, ACEI, ARES, antidepressants, methotrexate were excluded from the study [10].
All participants included in the study were subjected to the following: Careful medical history taking: including sexual function with stress on (libido, erection, frequency of intercourse) and dialysis history including date of starting dialysis, frequency of dialysis/week and duration of each dialysis session, type and surface area of dialyser, dialysate flow rate. Use of heparin (HMW vs. LMW) and complication of vascular access, thorough medical examination with stress on dry body weight, height, BMI (kg/ m2), blood pressure, manifestations of anemia and hypogonadism and full system examination, Laboratory investigations [11]. Peripheral venous blood samples under fasting conditions were obtained from all patients in predialysis session, and from controls, for assessment of (Hemogloin level, Fating blood glucose, Fasting Lipid profile (total cholesterol, triglycerides, LDL and HDL), Viral markers (HCV antibodies, HBS antigen and HIV), Serum creatinine, Kt/V and URR, Serum Albumin, Iron profile (S. iron, S. ferritin, Transferrin saturation and TIBC), Blood urea, and iPTH, Serum testosterone level [12]. Venous blood samples were obtained directly through artrio venous fistula of the patients and from the veins of the arm of the controls. The studied biochemichal parameters are performed via the standerd laboratory procedure using an automated analysis [13].
• Lipid profil and kidney function (blood urea, and serum creatinine) by using the open system autoanalyser synchrom CX5 (backman, USA).
• Serum iron, ferritine and IBC were assessed according to GOMELLa (2007). TSAT was calculated by serum iron and TIBC
• Intact PTH was tested by PTH ELISA test. The kits name is AGT DRG, USA which is imported by indomedix Egypt company.
• Assessement of serum testosterone level was tested by Elecsys and cobas e analyzers the kits name is Elecsys Testosterone II Immunoassay which is imported by Roche company [14].
Statistical analysis
Data were tabulated, coded then analyzed using the computer program SPSS (Statistical package for social science) version 23.0 to obtain. Descriptive statistics were calculated in the form of: Mean ± Standard Deviation (SD), minimum, maximum (range), medina, Interquartile Range (IQR), and Frequency (Numberpercent) [15].
In the statistical comparison between the different groups, the significance of difference was tested using one of the following tests: Student's t-test (Unpaired): Used to compare between mean of two different groups of numerical (parametric) data, Mann Whitney: Used to compare between mean of two different groups of numerical (non-parametric) data, Inter-group comparison of categorical data was performed by using chi square test (X2-value) or fisher exact when indicated, Pearson correlation coefficient test was used correlating different parameters, and Logistic regression was done to predict risk factors for deficiency of testosterone. A P value<0.05 was considered statistically significant [16].
Results
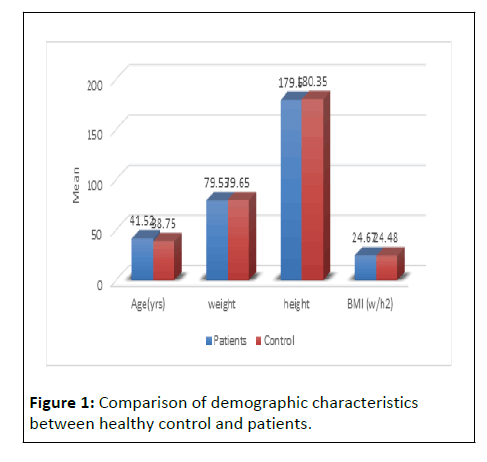
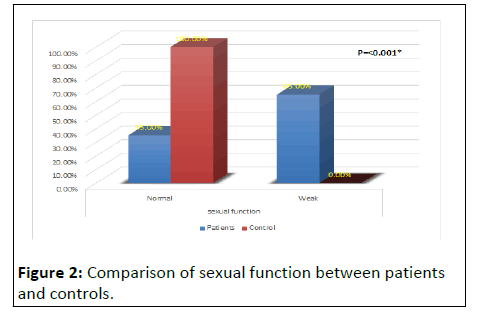
Table 1 and (Figures 1 and 2) shows that HD patients had significantly impaired sexual function levels (65%) compared to controls (0.0%) p value<0.001). However, there was no statistically significant to other demographic and clinical characteristics between patient and controls [17].
| Variables | Patients | Healthy controls | Test used | P | |
|---|---|---|---|---|---|
| Age(yrs) | 41.52 ± 7.16 | 38.75 ± 8.10 | t-test | 0.15 | |
| Weight | 79.53 ± 11.98 | 79.65 ± 8.16 | t-test | 0.96 | |
| Height | 179.60 ± 6.53 | 180.35 ± 5.56 | t-test | 0.6 | |
| BMI (w/h2) | 24.67 ± 3.28 | 24.48 ± 2.95 | t-test | 0.82 | |
| Starting dialysis (years) | 6.36 ± 4.33 | - | |||
| dry body weight | 77.22 ± 11.82 | - | |||
| HTN | Normal | 50 (83.3%) | 18 (90.0%) | Fisher exact | 0.7 |
| HTN | 10 (16.7%) | 2 (10.0%) | |||
| SBP | 125.67 ± 18.17 | 123.50 ± 15.65 | t-test | 0.63 | |
| DBP | 79.50 ± 11.71 | 83.50 ± 12.15 | t-test | 0.19 | |
| Sexual function | Normal | 21 (35.0%) | 20 (100.0%) | Fisher exact | <0.001* |
| Weak | 39 (65.0%) | 0 (0%) | |||
Note: *significance P<0.05
Table 1: Comparison of demographic and clinical characteristics between healthy control and patients.
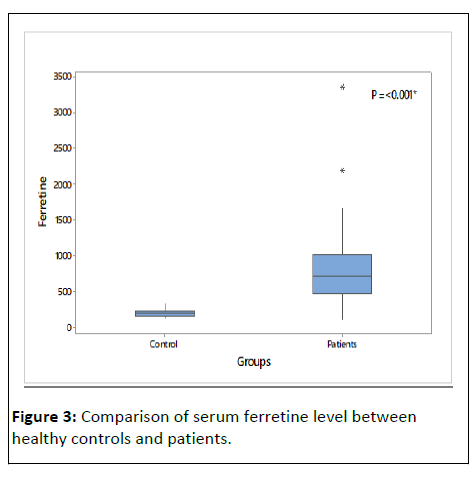
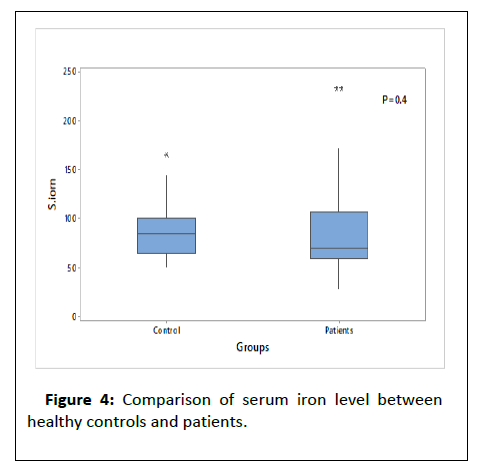
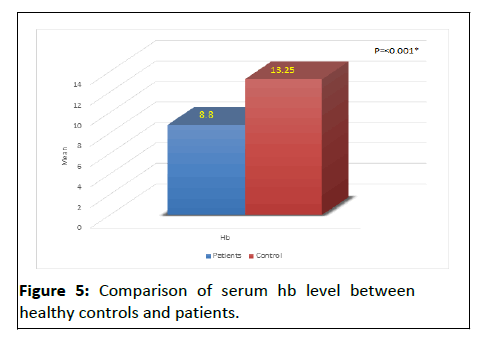
Table 2 and (Figures 3-5) shows that there were a significant lower Hb level and a significant higher ferritin level in HD patient compared to controls, also table show that t there was high significance difference as regard cholesterol, triglcerid, HCV, urea, ph, SGOT, cr, and PTH between patients and control.
| Variables | Patients | Healthy controls | Test used | P | |
|---|---|---|---|---|---|
| Hb | 8.80 ± 0.91 | 13.25 ± 1.89 | t-test | <0.001* | |
| Lipid profile | Cholest | 191.20 ± 40.80 | 172.20 ± 16.20 | t-test | 0.046* |
| Trig | 193.88 ± 49.66 | 160.15 ± 19.11 | t-test | 0.004* | |
| FBS | 90.63 ± 11.79 | 91.30 ± 10.23 | t-test | 0.8 | |
| HCV | Negative | 22 (36.7%) | 20 (100.0%) | FE | <0.001* |
| Positive | 38 (63.3%) | 0 | |||
| Cr | 10.00 (9.00-12.30) | 0.95 (0.75-1.10) | MW | <0.001* | |
| UREA | 145.82 ± 25.58 | 28.40 ± 6.61 | t-test | <0.001* | |
| SGOT | 32.61 ± 14.64 | 24.00 ± 7.10 | t-test | 0.01* | |
| SGPT | 32.15 ± 14.79 | 26.15 ± 8.05 | t-test | 0.08 | |
| Albumin | 4.00 (3.80-4.50) | 4.35 (3.85-4.95) | MW | 0.14 | |
| KT/V | 1.31 (1.15-1.42) | ||||
| URR | 65.7 ± 6.7 | ||||
| Ca | 9.13 ± 1.19 | 8.99 ± 0.73 | t-test | 0.6 | |
| Ph | 5.18 ± 1.41 | 4.35 ± 0.66 | t-test | 0.01* | |
| Iron | S. iron | 70.5 (59-106) | 85.00 (65.00-100.00) | MW | 0.4 |
| Ferretine | 716 (463-1002) | 190.00 (154.00-225.00) | MW | <0.001* | |
| TIBC | 273.00 ± 91.61 | 309.00 ± 41.65 | t-test | 0.1 | |
| TSAT [TSAT=(Fe/TIBC) × 100] | 32.30% ± 12.94% | 29.49% ± 10.61% | t-test | 0.4 | |
| PTH | 387.5 (195-667) | 70.0 (98.0-48.0) | MW | <0.001* | |
| Testosteron (nmol/dl) | 13.47 ± 6.21 | 27.26 ± 3.63 | t-test | <0.001* | |
| Epo (dose)/W | 9886.67 ± 2526.70 | - | |||
| ERI=(epo/week)/wieght/HB | 20.06 ± 5.24 | - | |||
Note: *significance P<0.05
Table2: Comparison of lab paramters between healthy controls and patients.
Concerning testosterone level, it was significantly lower in HD patients compared to controls. Other laboratory date show no significance between patients and control [18].
Table 3 shows that there was (53.5%) of studied HD patients have sufficient testosterone level (>10 nmol/L and 46.7%) have deficient level (<10 nmol/L).
| Variables | Testosterone (nmol/dl) | |
|---|---|---|
| <10 (Deficient) | <10 (Deficient) | |
| No | 28 | 32 |
| % | 0.467 | 0.533 |
Table3: Frequency of testosterone deficiency.
Table 4 shows that there was a significant difference between both deficient and sufficient testosterone groups according to patient's age and the sexual function. However, patients with deficient versus sufficient testosterone levels were not significantly different in other studied demographic, clinical and laboratory parameters [19].
| Variables | Testosterone (nmol/dl) | Test used | P | ||
|---|---|---|---|---|---|
| <10 (n=28) | >10 (n=32) | ||||
| Age (yrs) | 44.79 ± 4.93 | 38.66 ± 7.64 | t-test | 0.001* | |
| Weight | 81.86 ± 12.55 | 77.50 ± 11.25 | t-test | 0.16 | |
| Height | 180.96 ± 6.40 | 178.41 ± 6.51 | t-test | 0.13 | |
| BMI (w/h2) | 25.02 ± 3.43 | 24.35 ± 3.17 | t-test | 0.4 | |
| Starting dialysis(years) | 5.00 (2.00-8.50) | 6.00 (3.00-9.50) | MW | 0.5 | |
| Dry body weight | 79.50 ± 12.34 | 75.22 ± 11.16 | t-test | 0.16 | |
| HTN | Normal | 25 (89.3%) | 25 (78.1%) | FE | 0.3 |
| HTN | 3 (10.7%) | 7 (21.9%) | |||
| SBP | 125.00 ± 16.44 | 126.25 ± 19.80 | t-test | 0.8 | |
| DBP | 79.29 ± 10.86 | 79.69 ± 12.57 | t-test | 0.9 | |
| Sexual function | Normal | 0 (0.0%) | 21 (65.6%) | FE | <0.001* |
| Weak | 28 (100.0%) | 11 (34.4%) | |||
Note: *significance P<0.05
Table 4: Comparison of demographic and clinical characteristics as regard testosterone deficiency in patients.
Table 5 shows that patients with deficient versus sufficient testosterone levels were not significantly different regarding of laboratory parameters.
| Variables | Testosterone (nmol/dl) | Test used | P | ||
|---|---|---|---|---|---|
| <10 | >10 | ||||
| Hb | 8.98 ± 0.95 | 8.65 ± 0.87 | t-test | 0.17 | |
| Lipid profile | Cholest | 182.18 ± 24.91 | 199.09 ± 49.89 | t-test | 0.11 |
| Trig | 183.96 ± 36.47 | 202.56 ± 58.04 | t-test | 0.15 | |
| FBS | 91.71 ± 12.58 | 89.69 ± 11.17 | t-test | 0.5 | |
| HCV | Negative | 10 (35.7%) | 12 (37.5%) | FE | 1 |
| Positive | 18 (64.3%) | 20 (62.5%) | |||
| Cr | 10.50 (9.00-12.70) | 10.00 (9.00-12.20) | MW | 0.6 | |
| UREA (B) | 150.79 ± 31.70 | 141.47 ± 18.12 | t-test | 0.08 | |
| SGOT | 33.72 ± 12.17 | 31.63 ± 16.63 | t-test | 0.6 | |
| SGPT | 33.08 ± 12.14 | 31.34 ± 16.93 | t-test | 0.65 | |
| Albumin | 3.95 (3.75-4.80) | 4.00 (3.80-4.50) | MW | 0.8 | |
| KT/V | 1.19 (1.12-1.42) | 1.31 (1.19-1.42) | MW | 0.57 | |
| URR | 65.25 ± 6.97 | 66.16 ± 6.55 | t-test | 0.6 | |
| Ca | 9.05± 1.10 | 9.20 ± 1.29 | t-test | 0.6 | |
| Ph | 4.98 ± 1.20 | 5.36 ± 1.56 | t-test | 0.3 | |
| Iron | S. iron | 64.00 (51.00-106.50) | 76.50 (64.50-106.00) | MW | 0.2 |
| Ferretine | 675.50 (434.00-1031.50) | 726.00 (468.50-1002.00) | MW | 0.7 | |
| TIBC | 269.50 ± 83.84 | 276.16 ± 99.38 | t-test | 0.8 | |
| TSAT (TSAT=(Fe/TIB) × 100) | 31.33% ± 13.26% | 33.14% ± 12.81% | t-test | 0.6 | |
| PTH | 415.00 (175.00-697.00) | 336.00 (195.00-653.00) | MW | 0.98 | |
| Epo(dose)/W | 10000.00 ± 2036.70 | 9787.50 ± 2918.21 | t-test | 0.7 | |
| ERI=(epo/week)/wieght/HB | 19.83 ± 5.18 | 20.27 ± 5.36 | t-test | 0.75 | |
Table 5 shows that patients with deficient versus sufficient testosterone levels were not significantly different regarding of laboratory parameters.
Discussion
Hypogonadism or testosterone deficiency is a prevalent condition in men with chronic kidney disease. However, there was a significant difference between the both groups regarding the sexual function. Most of the studied patients were suffering from weak sexual function (65%). This result is in agreement, who reported that men with CKD stage-5 and on HD have significantly, lower fertility than members of the general population.
There were a significant lower Hb level and a significant higher ferritin level in HD patients compared to controls. The CKD patients had significantly lower levels of hemoglobin compared to control group. Also, serum ferritin concentrations seem to be associated with a higher risk of CKD in men.
Regarding lipid profile, the studied patients showed higher cholesterol and triglyceride levels compared with controls. This is partially consistent with who detected a linear increase in average triglyceride levels in chronic renal disease as its levels in serum began to increase in the early stage of chronic renal disease and reached the peak in stage IV despite the nonsignificant change in average cholesterol levels with progression of chronic renal disease.
The results of this study showed that nearly two third (63%) of the included patients had HCV infection. Similarly, studied Hepatitis C virus infection in patients on regular hemodialysis in Egypt and reported that the prevalence of the HCV at begin of dialysis was 60.9%.
Concerning testosterone level, it was significantly lower in HD patients compared to controls. In addition, 53.5% showed sufficient testosterone level (>10 nmol/L) and 46.7% showed deficient level (<10 nmol/L). These results are in the same line. In a study of 260 patients with ESRD, Carrero et al. found that 44% of patients were with testosterone deficiency (<10 nmol/L), 33% had testosterone insufficiency (10-14 nmol/L) and only 23% of the patients had a truly normal testosterone level.
Moreover, there was a significant difference between both deficient and sufficient testosterone groups according to patient's age. This was confirmed by the significant negative correlation that was detected between testosterone levels and age. By the same way, examined 420 male patients on HD and found that a large proportion of patients (66%) had testosterone deficiency (<10 nmol/L) with a negative significant correlation between serum testosterone levels and their age. Also, reported the significant correlation between the age and the testosterone level. In the current study, the result of logistic regression concerning testosterone deficiency showed that testosterone deficiency was significantly associated with age (OR: 1.186; 95%CI: 1.059-1.329).
According to the current results, there was a significant difference between patients with deficient and sufficient testosterone level according to the sexual function. Since all of patients with deficient testosterone had weak sexual function and most of patients with sufficient testosterone levels had normal sexual function. This result is opposite to the finding of Kerstin et al., who reported that sexual dysfunctions are common in CKD but not strongly correlated to testosterone levels.
As regared the dose of erythropoietin, the included patients were divided into two groups according to the dose of EPO per week. More than half of patients (53.3%) were receiving <12.000 unit of EPO/week and 46.7% were treated by ≥ 12.000 unit. Both groups showed significant differences in the weight, BMI, dry body weight, Hb levels and serum urea levels.
In addition to that, ERI was calculated in all patients and its range was 11.53-35.35 with mean ± SD of 20.06 ± 5.24. Then the patients were divided according to the median level of ERI (18.7) into two groups. The patient group with higher median ERI (18.7) showed a significant lower body weight, BMI, dry body weight, Hb level and serum ferritin level compared to those lower median ERI.
The current result is in agreement with who compared the two HD groups (responders and non-responders to EPO), and found that patients resistant to EPO therapy present with a low Hb level and a higher degree of inflammation, despite presenting lower BMI values compared with patients who are not resistant to therapy.
In the current study, patients with lower body weight, BMI, and dry body weight showed a higher ERI. This result can be confirmed by the fact that Malnutrition is related to inflammation and arteriosclerosis, and through common mediators, such as TNF-α and IL-6, it may play a relevant role in EPO resistance. Furthermore, the overweight condition is associated with a better clinical prognosis; the lowerthe BMI, the larger the uremic toxin load.
Also, the current Patients with higher dose of EPO therapy showed significant lower HB levels that could confirm the higher EPO resistance. Moreover, patients with higher ERI showed lower serum ferritin levels. This can be explained by the fact that iron deficiency or impairment of iron availability is the most frequent cause of EPO treatment resistance in patients under dialysis. Finally, the findings of the current work indicated that the testosterone deficiency is common on hemodialysis patients.
Moreover, testosterone has no role in the resistant to erythropoietin therapy. However, this study is limited by the small sample size.
Conclusion
In conclusion, this study showed that Testosterone deficiency is prevalent (46.6%) among male patients on chronic HD especially elderly ones. Sexual dysfunction is (65%) among HD patients and it is related to testosterone deficiency.
Responsiveness to erythropoietin therapy vary among HD patients that cannot be affected by testosterone level in HD male patients. Further studies are highly needed to study the direct correlation between testosterone and anemia in patients with CKD.
References
- Hara T, Mukai H, Nakashima T, Sagara R, Furusho M, et al. (2015) Factors contributing to erythropoietin hyporesponsiveness in patients on long-term continuous ambulatory peritoneal dialysis: A cross-sectional study. Nephron extra 5: 79-86.
[Crossref] [Googlescholar] [Indexed]
- Carrero JJ, Barany P, Yilmaz MI (2012) Testosterone deficiency is a cause of anaemia and reduced responsiveness to erythropoiesis-stimulating agents in men with chronic kidney disease. Nephrol Dial Transplant 27: 709-715.
[Crossref] [Googlescholar] [Indexed]
- Gungor O, Kircelli F, Carrero JJ, Asci G, Toz H, et al. (2010) Endogenous testosterone and mortality in male hemodialysis patients: Is it the result of aging? Clinical J American Society Nephrology 5: 2018-23.
[Crossref] [Googlescholar] [Indexed]
- Kang HT, Linton J, Kwon S, Park BJ, Lee J (2016) Ferritin level is positively associated with chronic kidney disease in korean men, based on the 2010-2012 korean national health and nutrition examination survey. Int J Environ Res Public Health 13: 1058-67.
[Crossref] [Googlescholar] [Indexed]
- Edey MM (2017) Male sexual dysfunction and chronic kidney disease. Frontiers Med 22: 32.
[Crossref] [Googlescholar] [Indexed]
- Khurana KK, Navaneethan SD, Arrigain S, Schold JD, NallyJr JV, et al. (2014) Serum testosterone levels and mortality in men with CKD stages 3-4. American J Kidney Diseases 64: 367-74.
[Crossref] [Googlescholar] [Indexed]
- Xu LG, Xu HM, Zhu XF, Jin LM, Xu B, et al. (2009) Examination of the semen quality of patients with uraemia and renal transplant recipients in comparison with a control group. Andrologia 41: 235-40.
[Crossref] [Googlescholar] [Indexed]
- López-Gómez JM, Portolés JM, Aljama P (2008) Factors that condition the response to erythropoietin in patients on hemodialysis and their relation to mortality: New strategies to prevent cardiovascular risk in chronic kidney disease. Kidney International 74: S75-81.
[Crossref] [Googlescholar] [Indexed]
- Kang HT, Linton J, Kwon S, Park BJ, Lee J (2016) Ferritin level is positively associated with chronic kidney disease in korean men, based on the 2010-2012 korean national health and nutrition examination survey. Int’l J Environ Res Public Health 13: 1058-67.
[Crossref] [Googlescholar] [Indexed]
- Zubovic SV, Kristic S, Prevljak S, Pasic IS (2016) Chronic kidney disease and lipid disorders. Med Archiv 70: 191.
[Crossref] [Googlescholar] [Indexed]
- Senosy SA, El Shabrawy EM (2016) Hepatitis C virus in patients on regular hemodialysis in Beni-Suef Governorate, Egypt. J Egypt Pub Heal Assoc 91: 86-89.
[Crossref] [Googlescholar] [Indexed]
- Carrero JJ, Qureshi AR, Nakashima A, Arver S, Parini P, et al. (2011) Prevalence and clinical implications of testosterone deficiency in men with end-stage renal disease. Nephrol Dial Transplant 26: 184-90.
[Crossref] [Googlescholar] [Indexed]
- Lehtihet M, Hylander B (2015) Semen quality in men with chronic kidney disease and its correlation with chronic kidney disease stages. Androl 47: 1103-8.
[Crossref] [Googlescholar] [Indexed]
- Yilmaz MI1, Sonmez A, Qureshi AR, Saglam M, Stenvinkel P, et al. (2011) Endogenous testosterone, endothelial dysfunction, and cardiovascular events in men with nondialysis chronic kidney disease. Clin J Am Soc Nephrol 6: 1617-25.
[Crossref] [Googlescholar] [Indexed]
- doSameiro-Faria M, Ribeiro S, Rocha-Pereira P, Fernandes J, Reis F, et al. (2013) Body mass index and resistance to recombinant human erythropoietin therapy in maintenance hemodialysis patients. Renal Failure 35: 1392-8.
[Crossref] [Googlescholar] [Indexed]
- Pecoits-Filho R, Lindholm B, Axelsson J, Stenvinkel P (2003) Update on interleukin-6 and its role in chronic renal failure. Nephrol Dial Transplant 18: 1042-1045.
[Crossref] [Googlescholar] [Indexed]
- Kotanko P, Thijssen S, Levin NW (2008) Association between eryth-ropoietin responsiveness and body composition in dialysis patients. Blood Purif 26: 82-89.
[Crossref] [Googlescholar] [Indexed]
- Okazaki M, Komatsu M, Kawaguchi H, Tsuchiya K, Nitta K (2014) Erythropoietin resistance index and the all-cause mortalityof chronic hemodialysis patients. Blood Purif 37: 106-112.
[Crossref] [Googlescholar] [Indexed]
- Alves MT, Vilaça SS, Carvalho MD, Fernandes AP, Dusse LM, et al. (2015) Resistance of dialyzed patients to erythropoietin. Revista Hematol Hemote 37: 190-7.
[Crossref] [Googlescholar] [Indexed]
Open Access Journals
- Aquaculture & Veterinary Science
- Chemistry & Chemical Sciences
- Clinical Sciences
- Engineering
- General Science
- Genetics & Molecular Biology
- Health Care & Nursing
- Immunology & Microbiology
- Materials Science
- Mathematics & Physics
- Medical Sciences
- Neurology & Psychiatry
- Oncology & Cancer Science
- Pharmaceutical Sciences
