ISSN : 2249 - 7412
Asian Journal of Plant Science & Research
Isolation and Identification of Proteins in the Flow Sap during Grape Germinating Stage
1College of Horticulture, Nanjing Agricultural University, Nanjing, China
2Jiangsu Polytechnic College of Agriculture and Forestry, Jurong, China
Abstract
The sap flowed abundantly in the tree when grape recovered to growth in spring. The flow sap delivered many kinds of nutrient substances for the grape growth. To reveal the importance of the sap during grape development the proteins from the flow sap were collected from ‘Rosario Bianco’ at different developmental stage, and then analyzed by sodium dodecyl sulfate-polyacrylamide gel electrophoresis (SDS-PAGE) and two-dimensional gel electrophoresis (2-DE). We found the protein of flow sap was annotated as peroxidases, chitinase, glycosyl hydrolase and α-Larabinofuranosidase, which play an important role at the development and growth of grape. However, there are some functions of proteins still are unknown. The unknown function group consisted of six proteins. This study will help to further explain the important role of flow sap in grape growth and development
Keywords
Grape; Flow sap; Protein; Development and growth; Function
Introduction
The various parts of higher plants, such as roots, leaves or flowers, have different physiological functions. Growth and development are dependent on the orchestration of nutrient allocation within the whole plant. To achieve this, higher plants have evolved two specialized long-distance transport systems, the phloem and the xylem. The function of xylem was transports mineral-containing water from the soil to the aerial plant parts. Nevertheless xylem sap not only contains mineral salts and water, but also amino acids, organic acids, and sugars [1]. Besides the small molecules that are transported in the sap, macromolecules plant sap contains have recently becoming the focus of investigations. Even though xylem vessels are dead, elongated cells that lack protoplasts at maturity and are therefore not capable of protein synthesis themselves, however, earlier reports have described the presence of proteins in the xylem sap of numerous plants [2,3].
Grape (Vitis vinifera L.) is one of the most widely cultivated and economically important fruit crops, with ancient historical connections to the development of human culture [4]. For perennial grape tree, sap flow was seasonal fluctuation: during wintertime, the plants were dormant because ground temperature is inferior, water deficit, air is dry and cold, and transpiration is weak. At this point, the sap flow starts to slow down or stop. When spring comes, as the temperature and moisture increases, the sap starts flowing. Grape tree begin to wake up gradually, which was the very vulnerable period of grape. The sap flowed abundantly in the tree when grape recovered to growth in spring. The flowing sap delivered many kinds of nutrient substances for the grape growth [5].
In the post-genome age, research on proteomics has become important because changes in proteins expressed by genes are the direct causes of life function changes. Therefore, proteomics has established itself as a cornerstone of systems biology and a powerful strategy for investigating many biological problems [6]. There has also quite a number of technologies tested, among which two-dimensional gel electrophoresis (2-DE) is one of the most useful methods to study complex patterns of gene expression at the level of proteins [7]
The purpose of the present study was to identify the proteins present in flow sap of healthy grape tree at three different stages (March 9 of SI, March 19 of SII, March 28 of SIII, in 2017). To achieve this, we analyzed proteins from flow sap of grape tree by sodium dodecyl sulfate-polyacrylamide gel electrophoresis (SDS-PAGE) and two-dimensional gel electrophoresis (2-DE). The objective of this study was to reveal the importance of the sap during grape development.
Materials and Methods
Collection of the Flow Sap
Sap samples were obtained after cutting the winter pruning branch approximately 5 cm from ‘Rosario Bianco’. After thorough washing of the surfaces on the cutting side with distilled water, they were blotted dry with filter paper and the exuding fluid was then collected with a hand-held pipette until sufficient sample volumes (usually 100 ml) were obtained.
RNA Extraction and qPCR Analysis
According to the manufacturer’s instructions, total RNA was extracted from the leaves and fruits by using the Huayueyang plant RNA kit (Huayueyang Biotech, Beijing, China). The integrity and concentration of the RNA was detected by 1.0 percent agarose gel electrophoresis and Nano Drop™ One/OneC (Thermo Fisher Scientific, USA). Further, the first strand of cDNA was synthesized using the Hifair® II 1st Strand cDNA Synthesis Kit (gDNA digester plus, Yeasen Biotech, Shanghai, China). Specific primers of the VvSnRK2s genes were designed by Primer Premier 5.0 and then detected by NCBI (https://www.ncbi.nlm.nih.gov/tools/primer-blast/). qPCR was performed on the Applied Biosystems 7500 (Thermo Fisher Scientific, USA) by using Hieff® qPCR SYBR Green Master Mix (Low Rox Plus, Yeasen Biotech, Shanghai, China) with a 20 μL sample volume. The reaction system was as follows: 95°C for 5 min, then 40 cycles of 95°C for 10 s, and 60°C for 30 s. For each sample, we conducted three biological and three technical replicates. The relative expression levels of each gene were calculated by the standard 2−ΔΔCT approach as compared with untreated control plants that were set as “1”.
Extraction of Total Protein
The sap was collected at the three stages (March 9/19/28, 2014). After centrifugation at 12,000 g for 30 min at 4 ᵒC, 200 mL supernatant sap was collected and concentrated to 10 ml by a vacuum. The sample and 1% β-ME were added with 5 mL of Tris-phenol (pH 8.0), and then regularly vortexed for 5min. The upper phenol phase was pipetted to fresh microtubes. At least five volumes of cold methanol plus 0.1 M ammonium acetate was added to the phenol phase, and the mixture was stored at -20ᵒC for 4 h. Precipitated proteins were recovered at 12,000 g for 30 min, and then washed with cold methanolic ammonium acetate twice and cold 80% acetone twice. The proteins were lyophilized by vacuum, and stored at -80ᵒC until use. The protein concentration was determined according to the method described by Bradford [8].
DE and Staining
First-dimension gel electrophoresis was performed on 17 cm ReadyStrip IPG Strips (Bio-Rad, Hercules, CA, USA) with a nonlinear pH gradient of pH 3-10 in a PROTEAN IEF system (Bio-Rad). The strips were rehydrated in 0.35 mL rehydration buffer containing 1.2 mg of proteins at 50 V and 19℃ for 12 h, and transferred to a strip tray. The voltage was set at 100 V for 1 h, 200 V for 1 h, 200V for 1 h, 200 V for 1 h, 500 V for 1 h, 500 V for 1 h, 1000 V for 1 h, 4000 V for 1 h, 8,000 V for 1 h, and then run at 8,000 V until the final volt-hour of 80 kVh was reached. All separations were performed at 19ᵒC.
After isoelectric focusing (IEF), the strips were equilibrated for 15 min in equilibration solution I [6 mol.L-1 urea, 0.375 mol.L-1 Tris-HCl, pH 8.8, 2% (w/v) SDS, 20% (v/v) glycerol, 2% (w/v) DTT], and equilibrated for another 15 min in equilibration solution II [6 mol.L-1 urea, 0.375 mol.L-1 Tris-HCl, pH 8.8, 2% (w/v) SDS, 20% (v/v) glycerol, 2.5% (w/v) iodoacetamide]. The strips were transferred into 20 volumes of fixing solution [10% (v/v) acetic acid, 10% (v/v) methanol, and 40% (v/v) ethanol], and fixed for 1 h. The strips were then placed in the gel in sensitization solution [1% (v/v) acetic acid, 10% (v/v) ammonium sulfate], and stirred for an additional 2h. The gel was then placed into 20 volumes of staining solution [5% (v/v) acetic acid, 45% (v/v) ethanol, and 0.125% (w/v) coomassie brilliant blue R-250], and stirred for more than 4h or overnight. The gel was transferred to destaining solution I [5% (v/v) acetic acid, 40% (v/v) ethanol] and stirred for 1h, and then transferred into destaining solution II [3% (v/v) acetic acid, 30% (v/v) ethanol] until the background was clear.
Image Acquisition and Data Analysis
The stained gels were scanned using a Versdoc 3000 scanner (Bio-Rad). Spot detection, gel matching, and group analysis of 12 gels (three independent analytical replicate gels for each developmental stage) were performed using PD Quest 8.0 software (Bio-Rad). Spot detection was manually refined as necessary. Quantitative analyses were carried out after normalizing the spot quantities (as spot optical density, OD) in all gels to compensate for nonexpression- related variations, and the individual protein spot quantities were normalized as a percentage of the total quantity of valid spots present in the gel and expressed as a percentage. Quantitative comparisons of the averaged gels at each stage were used to determine significant differentially expressed spots. Only the spots that showed at least a twofold change and those that were statistically significant in one-way ANOVA (P<0.05) for reproducible changes in three analytical replicates were considered for subsequent analysis.
Protein In-Gel Digestion and Identification by Matrix-Assisted Laser Desorption Ionization Time-of-Flight Mass Spectrometry (MALDI–TOF⁄TOF MS)
Protein spots of interest were excised from the gels and cleaned with double-distilled water before being transferred to sterilized Eppendorf tubes. The protein spots were washed with 25 mM NH4HCO3, dehydrated with 50% acetonitrile (ACN) in 25 mM NH4HCO3, reduced with 10 mM DTT in 50 mM NH4HCO3 for 1h at 56ᵒC, and alkylated in 55 mM iodoacetamide in 50 mM NH4HCO3 for 1 h at room temperature. The protein spots were washed several times with 50 mM NH4HCO3, dehydrated with ACN, dried in a vacuum centrifuge, and digested overnight at 37 ᵒC by the addition of 1.5 mL of trypsin. The resulting peptides were extracted by washing the protein spots with 0.1% trifluoroacetic acid in 67% ACN. The supernatants were collected and stored at 20 ᵒC for further use.
The resulting peptides were air-dried and analyzed with a 4800 MALDI–TOF⁄TOF Proteomics Analyzer (Applied Biosystems, Foster City, CA, USA). The UV laser was operated at a 200 Hz repetition rate, wavelength of 355nm, and accelerating voltage of 20 kV. The HCCA matrix was used for MS analyses. The protein digested with trypsin was used to calibrate the instrument as an internal calibration mode. Parent mass peaks with a mass range of 800-4000 Da and minimum S/N 20 were selected for tandem TOF/TOF analysis.
Classical protein database searches were performed with the MASCOT software. The taxonomy was restricted to “Viridiplantae” (green plants), and one missed cleavage was permitted. A Mowse score of over 71 for MS and 41 for MS/MS was considered as significant level (P<0.05). The identified proteins were assigned using information from the National Center for Biotechnology Information (NCBI, http://www.ncbi.nlm.nih.gov) databases.
Chromosome Location, Domain Search and Protein Structure Analysis
Genomic locations of the genes coding proteins were identified through the WEB-BLAT function in the Genoscope website (www.genoscope.cns.fr/blat-server/cgi-bin/vitis/webBlat). NCBI batch web Conserved Domains Search tool (http://www.ncbi.nlm.nih.gov/Structure/bwrpsb/bwrpsb.cgi) was used to analyze the domain of proteins.
The number of amino acids, molecular weight, and theoretical pI of the proteins were obtained from the Prot-Param analyses (http://cn.expasy.org/tools/protparam.html) on the basis of their sequences [9,10]. Protein secondary structure element prediction was conducted using the SOPMA server (http://npsa-pbil.ibcp.fr/cgi-bin/npsa_automat.pl?page =npsa_sopma.html) [11]. All the amino acid sequences were submitted to the SWISS-MODEL workspace server (http://swissmodel.expasy.org) [12]. The protein models were viewed and edited using Deepview/Swiss PDB Viewer v4.0 software (http://spdbv.vital-it.ch).
Results
Evaluation of Protein Content and Number of Protein Spots
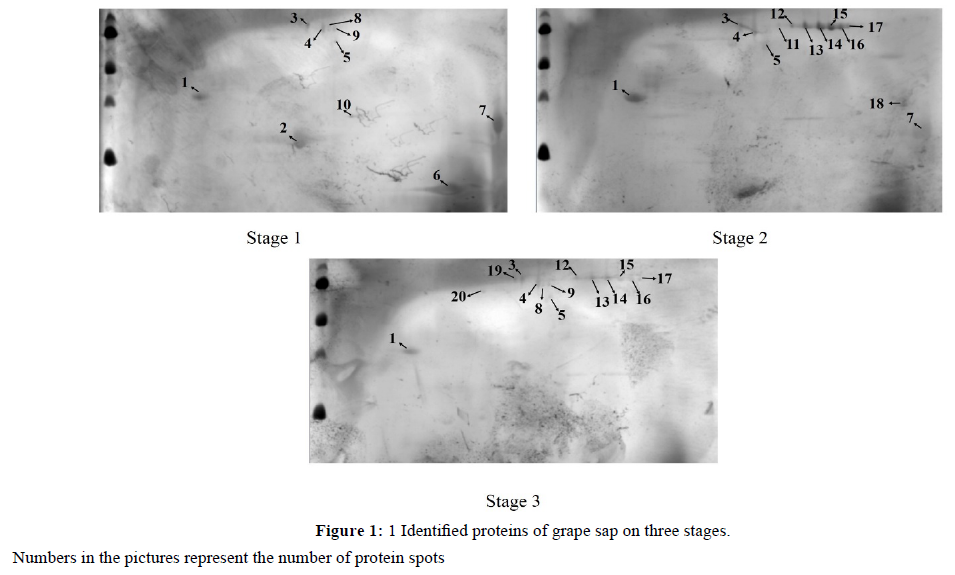
Consistent pattern of protein expression levels were observed on the gels. Image analysis revealed about 20 highly reproducible protein spots that were consistently observed in all replicates across the isoelectric point (pI) and massto- charge ratio (Mr) ranges of 3-10 and 14-110 kDa, respectively (Figure 1). The numbers of proteins at the three stages of stage I, II, III were 10, 13 and 14, respectively. Among the total selected spots, 12 protein spots were confidently identified according to the databases (Table 1).
| I | II | III | Spots Number | Gi Number | Name | Nominal Mass (Mr) | PI | Sequence Coverage(%) | MSMS Score |
|---|---|---|---|---|---|---|---|---|---|
| I | II | III | 1 | gi|359478501 | PREDICTED: cationic peroxidase 1-like | 35092 | 4.69 | 10 | 166 |
| 2 | gi|147841621 | hypothetical protein VITISV_009464 | 23146 | 5.02 | 25 | 334 | |||
| 3 | gi|225440254 | PREDICTED: alpha-L-arabinofuranosidase 1 | 75262 | 5.6 | 10 | 259 | |||
| 5 | gi|225444920 | PREDICTED: beta-galactosidase | 93282 | 7.49 | 4 | 140 | |||
| 7 | gi|225462667 | PREDICTED: acidic endochitinase | 32482 | 9.61 | 18 | 211 | |||
| 10 | gi|10880381 | chitinase | 35521 | 8.09 | 19 | 141 | |||
| 12 | gi|147853316 | hypothetical protein VITISV_030628 | 75298 | 5.42 | 2 | 122 | |||
| 13 | gi|359489522 | PREDICTED: uncharacterized protein LOC100254106 | 162971 | 7.88 | 4 | 178 | |||
| 14 | gi|296089127 | unnamed protein product, partial | 158971 | 8.67 | 1 | 106 | |||
| 16 | gi|225453855 | PREDICTED: subtilisin-like protease-like | 92160 | 5.6 | 1 | 82 | |||
| 19 | gi|225438930 | PREDICTED: subtilisin-like protease-like isoform 1 | 81712 | 5.79 | 3 | 116 | |||
| 20 | gi|297745522 | unnamed protein product, partial | 81849 | 6.63 | 5 | 111 |
Table 1: Identified proteins in the flowing saps collected at three growth stages of ‘Rosario Bianco’.
Almost all the proteins had the same expression patterns from each other, except spot 2 that were highly expressed in stageIwhile lowly expressed in stage II, III. The most proteins were highly expressed in stage II. Spot 1 and spot 5 were present in the three periods. Spot 2 was present in stage 1 and spot 19, 20 were high expressed in stage III.
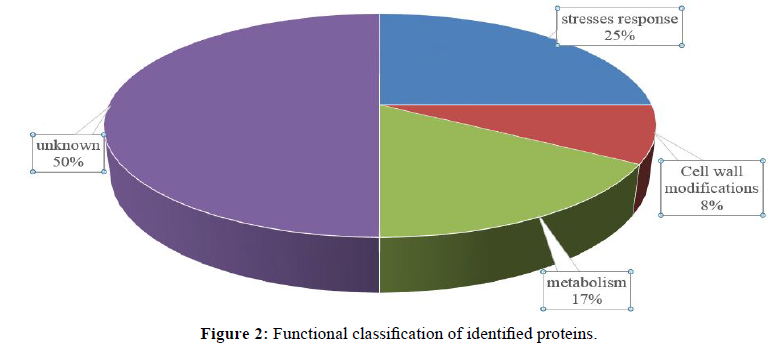
To analyze the function of the proteins identified, the identified proteins could be classified into four groups (Figure 2). The largest group is unknown function; include 6 numbers (spot 2, 5, 12, 13, 14, 20). Stresses response group include 3 number (spot 1, 7, 10), metabolism (spot 16, 19), Cell wall modifications (spot 3), and unknown function.
Structures of the Proteins Identified
Our protein sequences archived by blast aligned analysis were further used to predict protein secondary structures via SOPMA program, and bioinformatics was utilized to analyze the domains of proteins. The analysis indicated that the main secondary structures of proteins consisted of alpha helix, extended strand, beta turn, and random coil with an average of approximately 39.8%, 16%, 6.3%, and 37.7% of sequences, respectively.
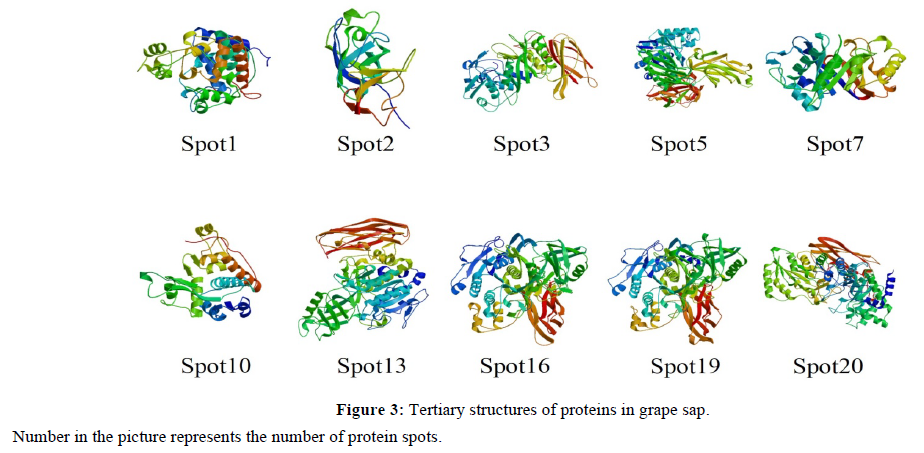
Based on the protein sequences searched in NCBI, three-dimensional structures of the differentially expressed proteins were also developed by homology modeling methods using Swiss-Model. The tertiary structures of 10 among the 12 differentially expressed proteins were successfully predicted (Figure 3). From the three-dimensional structures most proteins, we can see most proteins has a relatively independent structure itself, except the spot 16 and 19 which had high similar three-dimensional structures, suggesting they might belong to one gene family.
Genome Mapping Analysis of the Protein-Encoding Genes
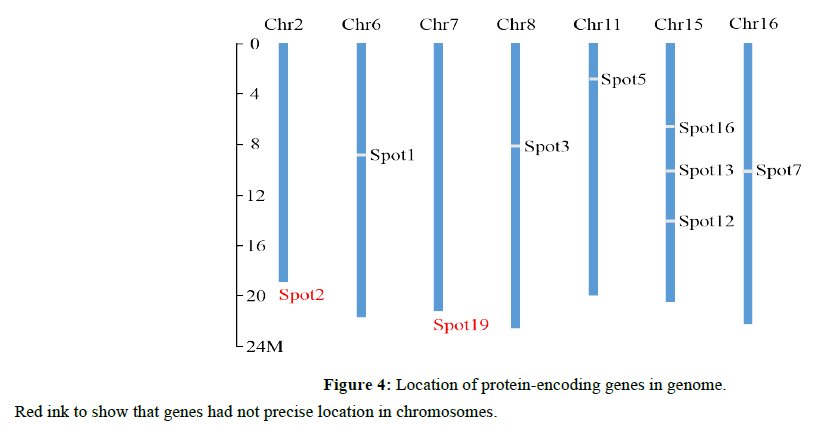
Totally, 9 genes identified as those encoding the sap proteins could be located in 7 chromosomes, the genomic analysis found that spot 2, spot 19 were known only determined in Chr2, Chr7, respectively, the precise mapping for spot 2 and 19 has not yet been finalized. Most of these chromosomes had one gene of sap protein, only Chr15 had three proteinencoding genes (Figure 4). Three genes were found in random sequences or chromosome_unknown sequences.
In our study, protein-encoding genes in sap were widely distributed in the grape genome. A total of 9 genes were distributed in 7 chromosomes, whereas three genes were distributed on random sequences or chromosome unknown sequences. Most of the chromosomes had one gene (chromosomes 2, 6, 7, 8, 11, 16) and chromosomes 15 had three protein-encoding genes. Almost one-third of the chromosomes were involved in this process, and the proteins represented numerous metabolic processes in cells. These findings illustrated that grape one-third involved a complex molecular mechanism with various metabolic and biological processes.
In addition, we searched the grape genomic database by BLAST using protein, EST, and gene sequences. A total of 6 protein-encoding genes were predicted gene structures by BLAST of Genoscope (Figure 5). Genes of sap proteins we found had an average of 10 exons. Spots 19 only had one exon, whereas spot 5 had the most number of exons (i.e., 19 exons).
Temporal and Spatial Characteristics of Gene Expression in Grape Tissues
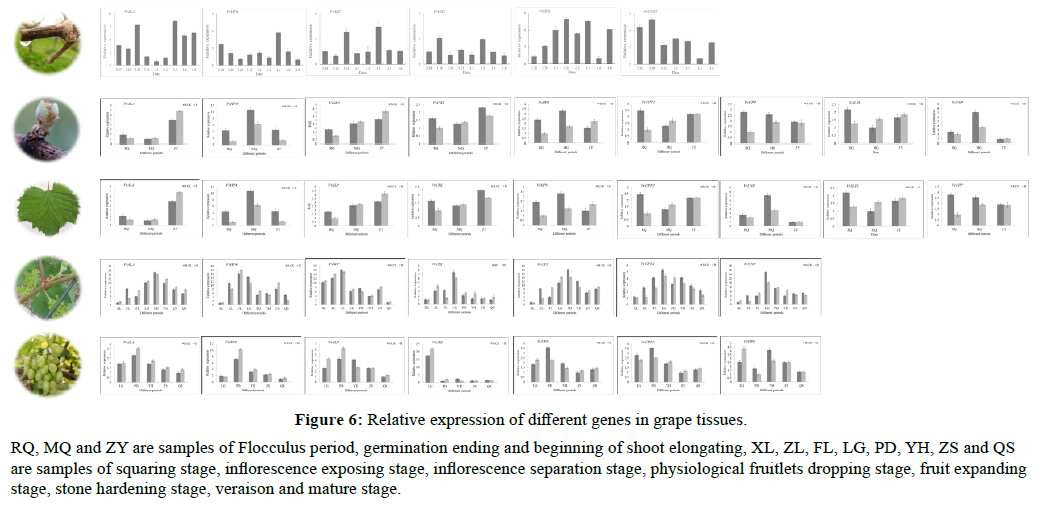
VvALA, VvHP4 and VvCHI in wound fluid changed with the date of wound, and there was a certain regular change in the expression level. Among them, the relative expression level of VvALA in the above-mentioned four kinds of wound fluids first decreased and then increased over time, and the lowest value appeared around April 2, and then increased; the relative expression level of VvHP4 was on April 3. It reached the maximum value and then decreased; the expression of VvCHI in the pre-traumatic period fluctuated to a certain extent, but it was at a relatively high level on April 3. The expression level of other genes has no obvious regularity.
The expression levels of genes in buds are quite different. Among them, VvSLP has the highest expression level during the development of buds; while VvUNP is at a low level during the development of leaves; VvALA is at a low level during the growth of buds, both at the pompon stage and the end of the bud. In the leaf development stage, the expression level has been significantly improved.
In leaves, the expression of VvCHI, VvHP4, VvALA, VvSLP, and VvSLPL have certain regularity during growth and development. The relative expression of VvCHI is at a high level during the physiological fruit dropping and fruit expansion phases of grapes; VvHP4 reaches a high level after the inflorescence is separated; VvALA has a high expression during the fruit expansion phase. The expression of VvSLPL was at a higher level during the period of physiological fruit drop, and then began to decrease.
The overall trend of VvCHI in stems is similar to that in leaves, with higher levels in the physiological fruit-falling period and fruit swelling period; VvHP4 has higher levels in the inflorescence separation to the physiological fruitfalling period; VvUPP in the physiological fruit-falling period. There is a higher level at the hard-core stage of the fruit; VvALA is at a higher level in the physiological fruit-falling and swelling stages of the fruit; VvSLP is at a higher expression level from the budding stage to the inflorescence separation stage; VvUNP and VvUPP are both at physiological fruit dropping period reaches a higher level.
The expression profiles of VvCHI, VvHP4, VvSLP and VvUPP in the fruits have certain regularity. VvCHI was the highest in the physiological fruit dropping stage, while the expression levels of VvHP4 and VvSLP reached the maximum in the fruit swelling stage, VvUPP reached a higher expression level in the physiological fruit dropping stage and the fruit swelling stage, and then began to decrease (Figure 6).
Figure 6: Relative expression of different genes in grape tissues.
RQ, MQ and ZY are samples of Flocculus period, germination ending and beginning of shoot elongating, XL, ZL, FL, LG, PD, YH, ZS and QS are samples of squaring stage, inflorescence exposing stage, inflorescence separation stage, physiological fruitlets dropping stage, fruit expanding stage, stone hardening stage, veraison and mature stage.
Expression of VvChis Gene in Bleeding Fluid of Grape at Different Stages
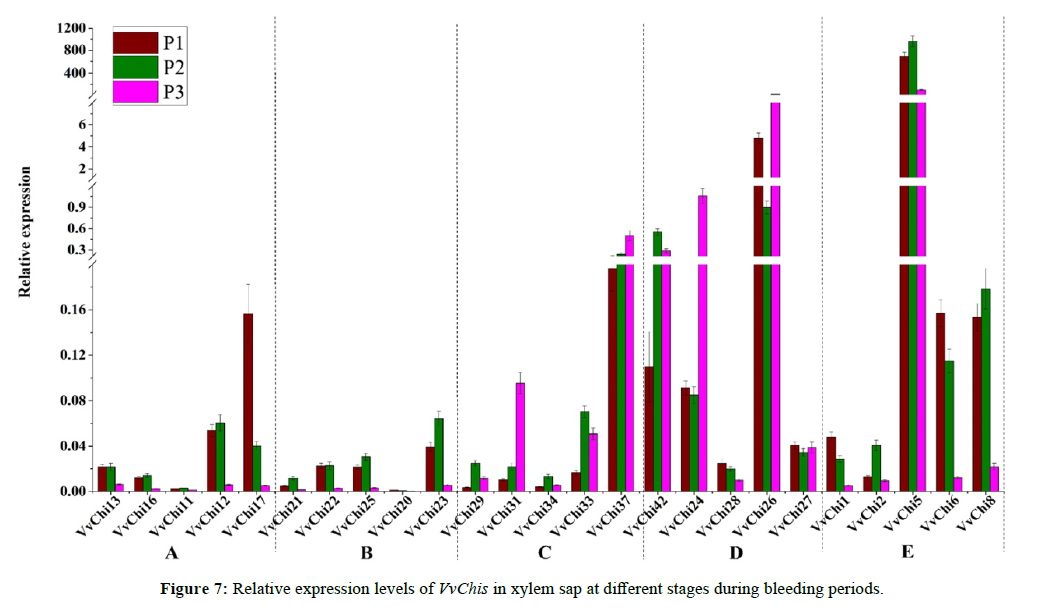
Based on the proteins identified, we found a chitinase that was related to disease resistance, so we had a further study. There are 42 members of chitinase family in Grape [13]. The expression of 25 VvChis in tree sap at different stages of bleeding stage was analyzed (Figure 7). It was found that the gene expression levels of group A and group B of gh18 family were relatively low, and the expression levels of group C, D and E were relatively high, especially those of Group D. The expression of chitinase gene in group A, B and E from GH18 family was higher in the early and middle stages of bleeding, and showed a downward trend in the later stage, and the trend was obvious; the expression of group C and D from GH19 family was lower in the initial stage of bleeding, but increased in the middle and late stage. The expression patterns of five genes in the same group were basically the same, but the expression levels were significantly different. The expression levels of VvChi28 in group D and VvChi28 and VvChi2 in Group E were very low compared with other members in this group, while the expression levels of VvChi26 and VvChi26 in group D were much higher than those in other groups.
Discussion
The xylem sap exuding from excised plant stems is known to contain some polypeptides and enzymatic activitie [14,15]. It is supposed that proteins transported in the xylem may have specific physiological functions in aerial organs. Since the information about the nature of sap proteins was incomplete for grape tree during sprouting in the early spring, the intentions of the present study were to compare the protein composition of flow sap collected at different growing stages and to identify the abundant proteins.
Source of Xylem Proteins
Flow sap samples were obtained by cutting stems from grape tree. The purity of samples is crucial, especially because the first exudate obtained after cutting is a mixture of xylem and phloem saps [16]. Because of that, we stripped the phloem from branch. Since functional xylem vessel elements are dead and autolysed, they are not able to produce proteins by themselves, in addition, it is probably difficult to deliver repair proteins from neighboring cells to the vessels against the direction of water flow [17]. So we assured the proteins collected from real xylem components.
Identity and Possible Functions of the Sap Proteins
The proteins detected from the flowing saps indicated that this sap flowing was important to the early grow and development of grape in spring.
Peroxidases have specific functions in cell wall formation and in particular, lignin biosynthesis [18]. Moreover, peroxidase was found in zucchini, in which the enzyme was located in the cell wall and produced in the next hypocotyl elongation areas; peroxidase in zucchini controlled hypocotyl elongation [19]. Peroxidase from Arabidopsis promotes cell elongation [20]. The expression of peroxidase indicated that this enzyme is related to cell elongation during the laticifer developmental process and is involved in plant defense responses.
Chitinase (CHTs) catalyze the hydrolysis of chitin, a linear homopolymer of b-1,4-linked N-acetylglucosamine. The molecular mass of most plant CHTs ranges between 10 and 30 kDa. Chitin is a common component of the cell walls of fungi, organisms that include many important plant pathogens. Therefore, plant CHTs are believed to act primarily against fungal pathogens, but there are also indications of additional non-defensive roles during normal plant development [21].
Acidic endochitinase and chitinase were important pathogenesis-related protein, which universally exists in higher plant, and participate in cell wall macromolecule catabolic process.
Metabolism group had two members (spot 16, 19), belongs to the glycosyl hydrolase 51 family, and contains 1 CBMcenC (cenC-type cellulose-binding) domain. Subtilisin-like protease is component of the xylem sap [22-24]. Only has very limited information on their action in plants is available. Their functions seem to be diverse, covering nodule formation, pathogen response, determination of cell fate [25,26].
Alpha-L-arabinofuranosidase 1 may be involved in the coordinated dissolution of the cell wall matrix during abscission and in the secondary cell wall formation in xylem vessels [27]. It expressed in roots, leaves, flowers, stems, siliques and seedlings. Observed in zones of cell proliferation, the vascular system and floral abscission zones. Expressed in the guard cells in stems, in xylem vessels and parenchyma cells surrounding the vessels, in the cambium and in the phloem, but not in the secondary xylem [28].
Protein of Unknown Function
The unknown function group consisted of six proteins. Among these proteins, spot 2 has a specific hit named DPBB1, The function of DPBB1 is not well understood in plant. Glyco-hydro 35 is the domain of protein spot 5 belong to the Alpha amylase catalytic domain family that comprised the largest family of glycoside hydrolases (GH), with the majority of enzymes acting on starch, glycogen, and related oligo-and polysaccharides. The primary analysis indicates that the function of spot 5 was closely related to the glucose metabolism. Protein spot 8 was a multi-domain protein composed of Peptidase inhibitor I9, Peptidase S8 and PA_subtilisin_like, which influence the stability and accessibility of the site to substrate.
On the basis of the analysis above, during grape tree, stresses response and cell wall modifications proteins could be expressed abundantly in sap, to increase the tree resistance and facilitates the formation of new tissue.
Declarations
Acknowledgements
This work was supported and funded by China National Natural Science Fund (31361140358).
Compliance with Ethical Standards
Conflict of interest
The authors declare that they have no conflict of interest.
Ethical approval
This article does not contain any studies with human subjects or animals performed by any of the authors.
References
- Lopez-Millan AF, Morales F, Abadia A, Abadia J. Effects of iron deficiency on the composition of the leaf apoplastic fluid and xylem sap in sugar beet. Implications for iron and carbon transport. Plant Physiol. 2000, 124(2):873-884.
- Rep M, Dekker HL, Vossen JH, de Boer AD, Houterman PM, et al. Mass spectrometric identification of isoforms of PR proteins in xylem sap of fungus-infected tomato. Plant Physiol. 2002, 130(2):904-917
- Masuda S, Sakuta C, Satoh S. cDNA cloning of a novel lectin-like xylem sap protein and its root-specific expression in cucumber. Plant Cell Physiol. 1999, 40(11):1177-1181
- Swain SM, Singh DP. Tall tales from sly dwarves: gibberellins and plant development. Trends Plant Sci. 2005, 10(3):123-129.
- Dinant S, Bonnemain JL, Girousse C, Kehr J. Phloem sap intricacy and interplay with aphid feeding. C R Biol. 2010, 333(6-7):504-515.
- Whitelegge JP, Komatsu S, Jorrin-Novo J. Diverse facets of plant proteomics. Phytochemistry. 2011, 72(10):961-962.
- Celis JE, Ostergaard M, Jensen NA, Gromova I, Rasmussen HH, et al. Human and mouse proteomic databases: novel resources in the protein universe. FEBS Lett. 1998, 430 (1-2):64-72.
- Bradford MM. A rapid and sensitive method for the quantitation of microgram quantities of protein utilizing the principle of protein–dye binding. Analytical Biochemistry. 1976, 72:248-254.
- Kyte J, Doolittle RF. A simple method for displaying the hydropathic character of a protein. J Mol Biol. 1982, 157(1):105-132.
- Guruprasad K, Reddy BV, Pandit MW. Correlation between stability of a protein and its dipeptide composition: a novel approach for predicting in vivo stability of a protein from its primary sequence. Protein Eng. 1990, 4(2): 155-161.
- Geourjon C, Deleage G. SOPMA: significant improvements in protein secondary structure prediction by consensus prediction from multiple alignments. Comput Appl Biosci. 1995, 11(6):681-684.
- Arnold K, Bordoli L, Kopp J, Schwede T. The SWISS-MODEL workspace: a web-based environment for protein structure homology modelling. Bioinformatics. 2006, 22(2):195-201.
- Ting Zheng, Kekun Zhang, Ehsan Sadeghnezhad, Xudong Zhu, Songtao Jiu, et al. Chitinase family genes in grape differentially expressed in a manner specific to fruit species in response to Botrytis cinerea [published online ahead of print]. Mol Biol Rep, 2020.
- Biles CL, Abeles FB. Xylem sap proteins. Plant Physiol. 1991, 96(2):597-601.
- Biles CL, Martyn RD, Wilson HD. Isozymes and general proteins from various watermelon cultivars and tissue types. HortScience. 1989, 24:810-812.
- Satoh S, Iizuka C, Kikuchi A, Nakamura N, Fujii T. Proteins and carbohydrates in xylem sap from squash root. Plant Cell Physiol. 1992, 33(7): 841-847.
- Sakuta C, Satoh S. Vascular tissue-specific gene expression of xylem sap glycine-rich proteins in root and their localization in the walls of metaxylem vessels in cucumber. Plant Cell Physiol. 2000, 41(5):627-638.
- Martinez-Cortes T, Pomar F, Espineira JM, Merino F, Novo-Uzal E, et al. Purification and kinetic characterization of two peroxidases of Selaginella martensii Spring involved in lignification. Plant Physiol Biochem. 2012, 52: 130-139.
- Cosio C, Vuillemin L, De Meyer M, Kevers C, Penel C, et al. An anionic class III peroxidase from zucchini may regulate hypocotyl elongation through its auxin oxidase activity. Planta. 2009, 229(4):823-836.
- Passardi F, Tognolli M, De Meyer M, Penel C, Dunand C, et al. Two cell wall associated peroxidases from Arabidopsis influence root elongation. Planta. 2006, 223(5): 965-974.
- Zhong R, Kays SJ, Schroeder BP, Ye ZH. Mutation of a chitinase-like gene causes ectopic deposition of lignin, aberrant cell shapes, and overproduction of ethylene. Plant Cell. 2002, 14(1):165-179.
- Ribeiro A, Akkermans ADL, van Kammen A, Bisseling T, Pawlowski K, et al. A nodule-specific gene encoding a subtilisinlike protease is expressed in early stages of actinorhizal nodule development. Plant Cell. 1995, 7(6):785-794.
- Tornero P, Conejero V, Vera P. Primary structure and expression of a pathogen-induced protease (PR-P69) in tomato plants: similarity of functional domains to subtilisin-like endoproteases. Proc Natl Acad Sci USA. 1996, 93(1):6332-6337.
- Jorda L, Coego A, Conjero V, Vera P. Genomic cluster containing four differentially regulated subtilisin-like processing protease genes in tomato plants. J Biol Chem. 1999, 274(4):2360-2365.
- Neuteboom LW, Ng JMY, Kuyper M, Clijdesdale OR, Hooykaas PJJ, et al. Isolation and characterisation of cDNA clones corresponding with mRNAs that accumulate during auxin-induced lateral root formation. Plant Mol Biol. 1999, 39(2): 273-287.
- Berger D, Altmann T. A subtilisin-like serine protease involved in the regulation of stomatal density and distribution in Arabidopsis thaliana. Genes Dev. 2000, 14(9):1119-1131
- Chavez Montes RA, Ranocha P, Martinez Y, Minic Z, Jouanin L, et al. Cell wall modifications in Arabidopsis plants with altered alpha-L-arabinofuranosidase activity. Plant Physiol. 2008, 147(1):63-77
- Fulton LM. Cobbett CS. Two alpha-L-arabinofuranosidase genes in Arabidopsis thaliana are differentially expressed during vegetative growth and flower development. J Exp Bot. 2003, 54(392):2467-2477

Open Access Journals
- Aquaculture & Veterinary Science
- Chemistry & Chemical Sciences
- Clinical Sciences
- Engineering
- General Science
- Genetics & Molecular Biology
- Health Care & Nursing
- Immunology & Microbiology
- Materials Science
- Mathematics & Physics
- Medical Sciences
- Neurology & Psychiatry
- Oncology & Cancer Science
- Pharmaceutical Sciences
