ISSN : 2393-8854
Global Journal of Research and Review
Influence of Zinc and Boron upon Grain Mass and Total Protein of some Rice Cultivars
1Food Quality & Safety Research Institute, SARC, PARC, Pakistan
2National Sugar Crops Research Institute, SARC, PARC, Pakistan
- *Corresponding Author:
- Muhamamad Abbas Bhutto
Food Quality & Safety Research Institute
Southern-Zone Agricultural Research Center
Pakistan Agricultural Research Council
University of Karachi, Pakistan
Tel: +92-51-0800-84420
E-mail: abbasbhutto@hotmail.com
Received Date: November 13, 2018; Accepted Date: December 06, 2018; Published Date: December 14, 2018
Citation: Bhutto MA, Anwar F, Riaz S, Sitara U, Ali QM, et al. (2018) Influence of Zinc and Boron upon Grain Mass and Total Protein of some Rice Cultivars. Glob J Res Rev Vol.5 No.2:13
DOI: 10.21767/2393-8854.100042
Abstract
Nutrients required to rice plants are supplied through soil in the form of fertilizers and manures. Intensive cropping, application of soil amendments in problematic soils and heavy dose of major nutrients particularly phosphorus has resulted in deficiency of several micro-nutrients, especially zinc and boron in rice fields. Physicochemical attributes may vary upon micronutrient via; Zn and B application with the recommended doses of N and P. Therefore, field experiment was conducted to assess the response in terms of some physicochemical attributes (grain mass and total protein content of five rice varieties; IRRI-6, IRRI-9, DR-92, DR-84 and Shahkaar over different treatments of fertilizers. Experimental field was divided into fifty-five (55) sub-plot of 3 x 5 m2 each. Ureaas N, DAPas P, Zinc Sulphateas Zn and Boric Acid as B were applied. Higher GM: 25.7 g, 24.3 g, 24.3 g, 25.4 g and 25.8 g; and total protein content: 11.1, 10.7, 10.4, 10.5 and 10.9% was found in IRRI-6, IRRI-9, DR-92, DR-84 and Shahkaar respectively. GM and protein significantly (p<0.05) increased within varieties at each treatment.
Keywords
Rice; Zinc; Boron; Grain mass; Protein
Introduction
Rice (Oryzasativa, L) among cereals alone is the main source of energy that serves as major source of calories to population in Asia, Africa and Latin America. In increasing trends population of world food security is becoming serious concern and may reach alarming situation by 2025 in Asia continent [1]. Food growth rate in Pakistan only 1% is not sufficient upon population growth of 3%. According to an estimate majority of world population may be shifted to rice consumption resultant increase may reach to 760 million tons by 2025 [2]. Apart from the future need, country's rice is production 35% less than existing actual requirement. In order to fill-up void to meet future needs, it has become imperative to increase acreage of cultivation, growing high yielding rice varieties. The desired results may be obtained by implementing good agricultural practices at field level and by supplying balanced quantities of required nutrients elements that are received to the plant from soil; the medium for crop.
Soil is a heterogeneous material consist of three phases, liquid, gaseous and solids. Solid phase also is known as the reservoir and is the main route from which nutritional requirement is fulfilled by plants. Organic fraction of soils is the best source of nitrogen only but major quantities of other nutrients are being released in soil solution (labile pool) from clay colloids. Microbial biomass and small fraction of soil organic matter, humus, is also a substantial source of some nutrients such as phosphorus and micronutrient elements.
Soils of Pakistan are exhausted due to continuous and intensive cropping. The problem has been doubled due to lack of interest in applying good agricultural practices by grower particularly the crop rotation. Majority of soils are low in organic matter resulting in decreased nitrogen, available phosphorus but at the same time sufficient quantities of potassium and other micronutrients are found in these soils [3]. For optimum growth and production of rice crop, supply of all essential nutrients, macro and micro, are the prime requirements and imbalance supply may hamper growth and ultimately the yield of the target crop [4]. Thus, continuous supply of the nutrients is essential to balance the removal of same nutrients from soil by plants. This equilibrium is maintained by applying organic and inorganic fertilizers in soils. Majority of the growers do apply nitrogen and phosphorus fertilizers but micronutrients are to not consider increasing yield of crops except rice. But in recent studies it is reported that application micronutrient such as molybdenum, boron and zinc as an additional fertilizers, has increased yield and improved quality of produce in crops.
Out of the elements explored yet, plants need only twenty nutrients to complete during growing season [5]. Each nutrient carry separate behavior and function within soil and into plants, Some of these nutrients such as nitrogen is the indispensable part of protein and potassium re is required mainly for enzyme activation. Micronutrients are also essentially needed and playing specific role up to the maturity of crop plants. Carbon, hydrogen and oxygen that constitute of about ninety percent or more of the dry matter of plants are obtained by plants from air and water. Whereas remaining essential nutrients; macro and micro are absorbed by plants from soil solution. Soils of Pakistan contain sufficient quantities calcium, magnesium and sulphur hence application of these nutrient fertilizers is not recommended in general. Whereas other traces elements such as Zinc, Boron, Copper, Iron, Manganese and Molybdenum though in minute quantities but are essentially required to plants.
Material and Methods
Experiment upon influence of Zn and B application upon grain mass and total protein content was carried out during harvest 2009-2011 at RRI (Rice Research Institute, Larkana (Latitude 24 56' 00' and Longitude 67 11' 00'). Five rice varieties (IR6, IR8, DR92, DR83 and Shahkar) were grown on recommended fertilizer dozes. Three replicates of each treatment were taken and experimental plots in the field were designed accordingly. At the harvesting, paddy samples of around 2 Kg in weight of each variety from respective trial plot were drawn. Samples preserved into polyethylene bags and after marking then were bought to the laboratory- PARC-Food Quality & Testing Laboratory, Karachi.
After recording grain mass (g) expressed in TGM (thousand grain mass) was recorded using Seed Counter and weighing on computer grain scale followed by conversion factor into tons per hectare, manual de-husking by hand was done and white polished rice grain were preserved again into polyethylene bags. These samples were analyzed to total protein content (%). 2.0 g of polished and mashed rice of each variety was taken into glass tube; 18.0 ml of concentrated sulphuric acid was added. After capping tubes then were placed over digestion attached with scrubber to avoid distribution of hazardous acidic fumes for about fifty minutes digestion process. Samples were taken out of the unit for cooling down in the fuming hood. Following reference and manufacturer method samples then were analyzed on Autokhjeldal for total protein content expressed percent [6]. Statistical analysis among variables was calculated using SPSS software [7].
Results
Result obtained from the study that was conducted to investigate the impact of micronutrient [8] addition along with primary recommended dose of nitrogen and Phosphorus on some physicochemical properties. Physiochemical properties of rice are primary indicators grains that may help assessing the effect of these properties on other quality indices and processing. Supply balanced nutrition from soils may have impact on these properties.
Grain mass (g)
Grain mass (GM) of paddy rice, expressed thousand grain mass (g) is an important component use for determining soundness that reflect the total yield. This physical attribute of paddy rice may be influenced by nutrient supply in plant system. Table 1 shows analysis of variance among effects of treatments, variety and harvest year on GM of paddy rice. Result given in the Table 1 indicated that influence of the treatment and variety on GM was found to be highly significant (p<0.001). However, the magnitude of impact of treatment was found to be much larger (about 10 times) than that of variety. The harvest year also influenced the GM though less significant (p<0.05) than treatment and variety. Influence of interactions was statistically significant. However the impact of V×T was found to be highest among the influence of interactions.
Table 1 Analysis of variance for thousand grain mass of rice varieties.
| Source | Type III Sum of Squares | Degree of Freedom | Mean Square | F-Value | Sig. |
|---|---|---|---|---|---|
| Corrected Model | 496.410 | 44 | 11.282 | 26.584 | .000 |
| Intercept | 230380.268 | 1 | 230380.268 | 542843.893 | .000 |
| Variety (V) | 68.519 | 4 | 17.130 | 40.363 | .000 |
| Treatment (T) | 343.112 | 2 | 171.556 | 404.237 | .000 |
| Harvest year (Y) | 3.355 | 2 | 1.678 | 3.953 | .020 |
| V × T | 35.335 | 8 | 4.417 | 10.408 | .000 |
| V× HY | 10.738 | 8 | 1.342 | 3.163 | .002 |
| T × HY | 10.485 | 4 | 2.621 | 6.177 | .000 |
| V × T × HY | 24.865 | 16 | 1.554 | 3.662 | .000 |
| Error | 152.782 | 360 | .424 | ||
| Total | 231029.460 | 405 | |||
| Corrected Total | 649.192 | 404 |
a R Squared = 0.765 (Adjusted R Squared = 0.736)
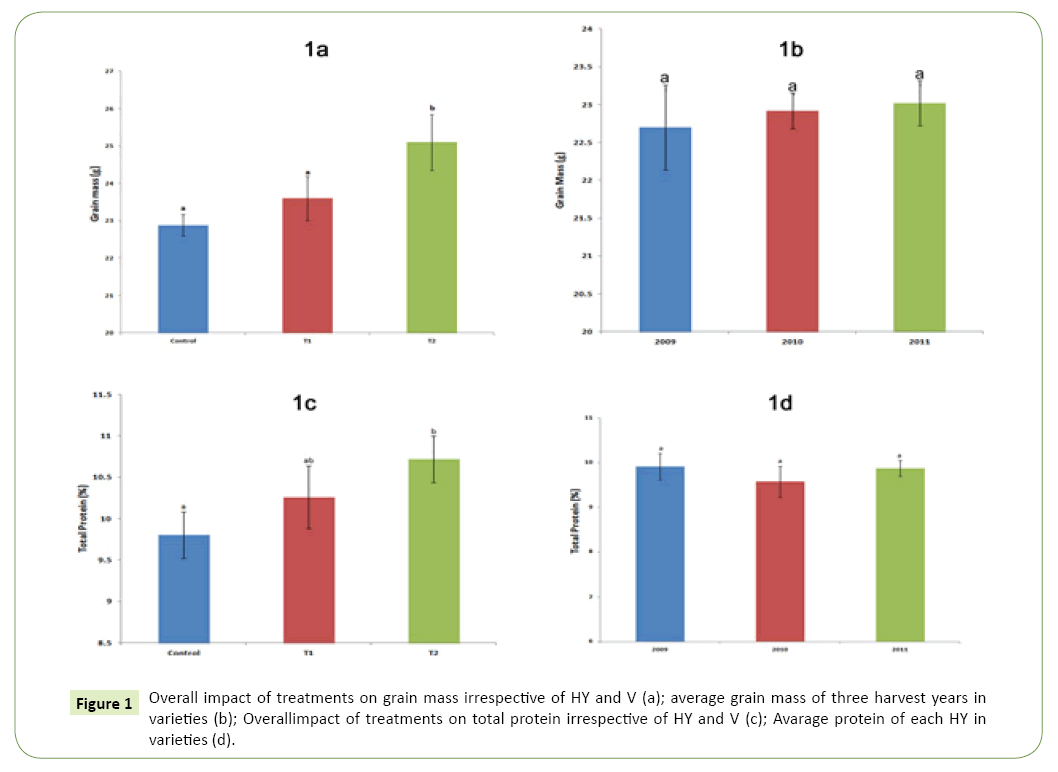
Overall influence of the treatments T1 and T2 irrespective of harvest years and varieties are depicted in Figure 1. It is apparent from the Figure 1a that Zn addition alone and Zn with B increase the GM in rice over control. The difference of increase between GM at control and T1 was found to be statistically insignificant (p<0.05) whereas T2, the increase was significant (p<0.05) over control and T1.
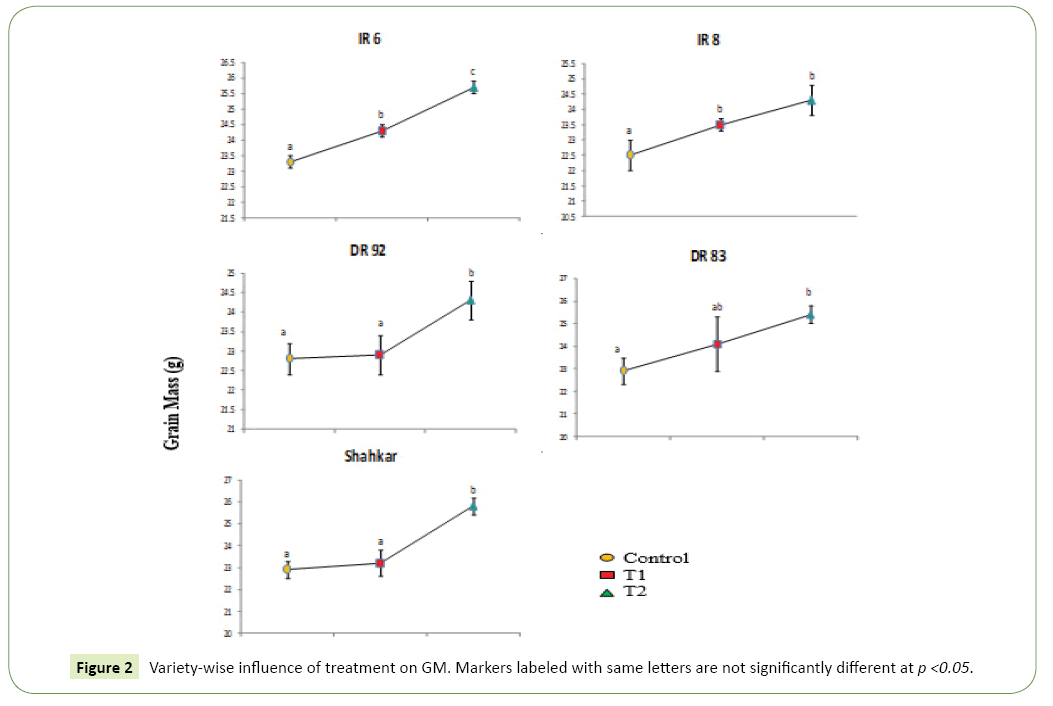
Figure 2 shows thousand grain mass obtained at control, T1 and T2 within varieties. The impact of T2 (Zn and B) on GM of each variety was found to be significant (p<0.05) whereas Zn alone was found to be significant (p<0.05) over control in IR6 and IR8. By comparing T1 and T2, all the varieties (except DR83 and IR8) was found to be statistically significant (p<0.05).
GM of rice in overall three different harvest years irrespective of treatments and varieties are shown in Figure 1b. The difference of GM among each harvest year was found to be statistically insignificant (p<0.05). Minimum GM (22.7 g) in harvest year 2009 and the maximum (23.0 g) in 2011 was found.
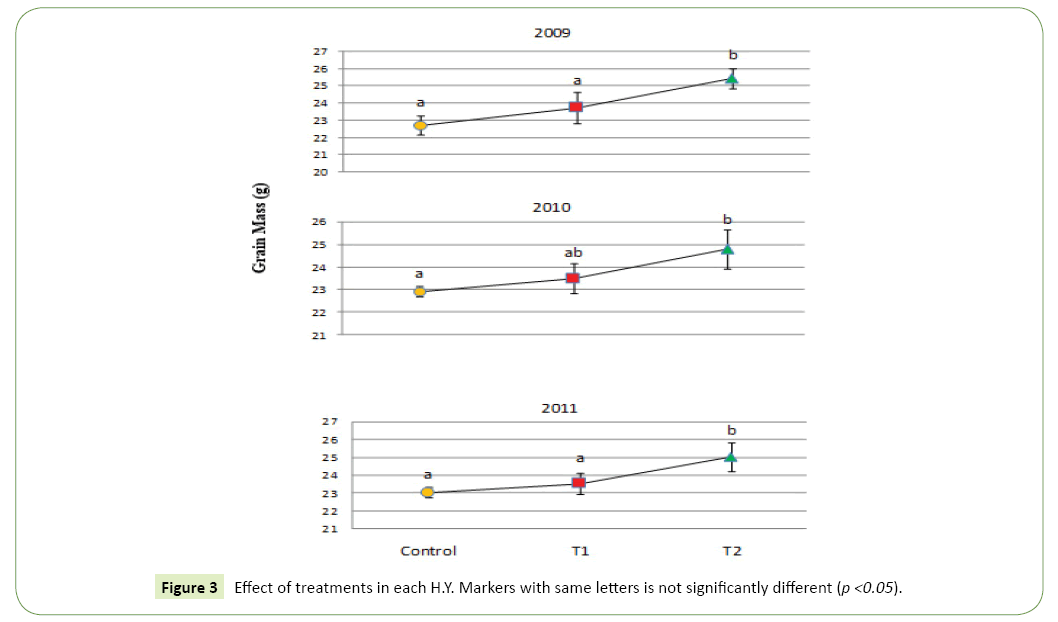
Effect of treatments on GM in each harvest year is depicted in Figure 3 shows that the influence of Zn addition alone (T1) over control on GM was found to be statistically insignificant (p<0.05) in all years whereas addition of Zn plus B (T2) in all harvest years was found to be significantly (p<0.05) different from control.
Total protein content (%)
Result given in the Table 2 showed that influence of the treatment and variety on protein content of rice grain was found to be highly significant (p<0.001). However, the magnitude of impact of treatment was found to be much larger (about six times) than that of variety. The harvest year also influenced the protein contents though less significant (p<0.05) than treatment and variety. Influence of interactions of V×HY and V×T×HY was also statistically significant.
Table 2 Analysis of variance in protein of rice varieties.
| Source | Type III Sum of Squares | Degree of Freedom | Mean Square | F-Value | Sig. |
|---|---|---|---|---|---|
| Corrected Model | 107.490 | 44 | 2.443 | 7.499 | .000 |
| Intercept | 42641.586 | 1 | 42641.586 | 130899.077 | .000 |
| Variety (V) | 21.152 | 4 | 5.288 | 16.233 | .000 |
| Treatment (T) | 58.801 | 2 | 29.401 | 90.253 | .000 |
| Harvest year (HY) | 2.175 | 2 | 1.088 | 3.338 | .037 |
| V × T | 5.016 | 8 | .627 | 1.925 | .055 |
| V× HY | 6.285 | 8 | .786 | 2.412 | .015 |
| T × HY | 2.699 | 4 | .675 | 2.071 | .084 |
| V × T × HY | 11.362 | 16 | .710 | 2.180 | .006 |
| Error | 117.273 | 360 | .326 | ||
| Total | 42866.350 | 405 | |||
| Corrected Total | 224.764 | 404 |
a R Squared = 0.478 (Adjusted R Squared = 0.414)
Overall Influence of the treatments T1 (N+P+Zn) and T2 (N+P+Zn+B) irrespective of harvest years and varieties is depicted in Figure 1c. It is apparent from the figure that Zn addition alone and Zn with B increased protein content in rice grain over control. The difference of increase between control and T2 was found to be statistically significant (p<0.05)
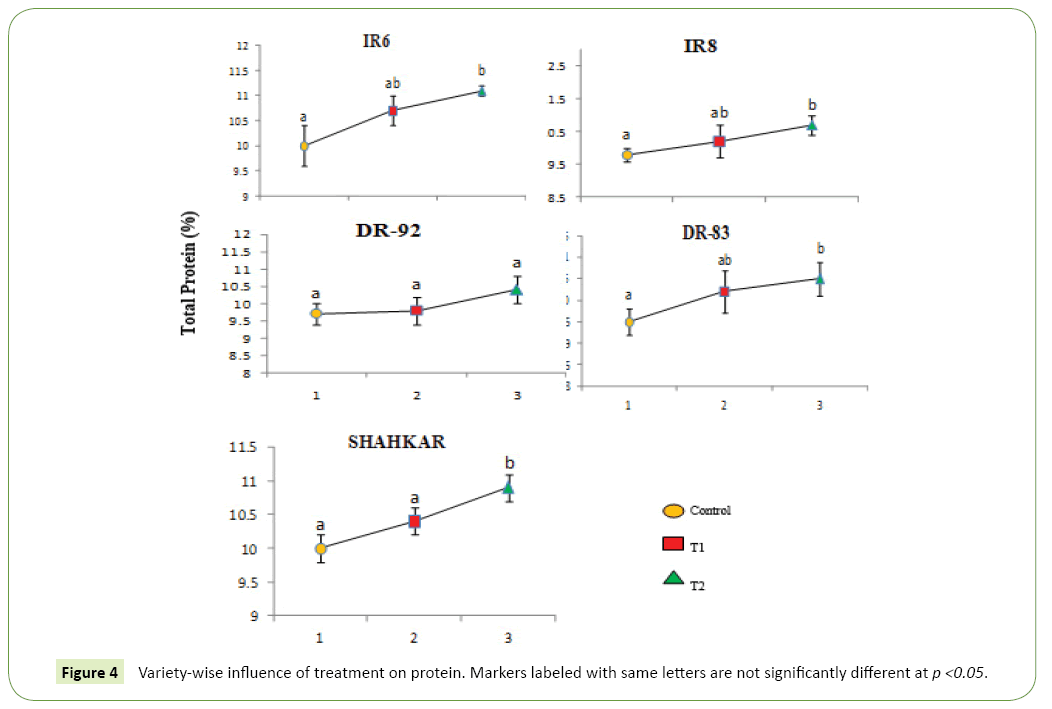
Data presented in Figure 4 shows that protein content obtained in control, T1 (N+P+Zn) and T2 (N+P+Zn+B) within each variety. The impact of Zn plus B addition (T2) over control was found to be significant (p<0.05) in all varieties except DR92 whereas, the difference in protein upon T1 was found to be insignificant in all varieties. By comparing T1 and T2, the significant difference was only found in a variety Shahkaar.
Protein content of rice grain in each harvest year is shown in Figure 1d. Minimum contents (9.6 %) in harvest year 2010 and the maximum (9.9%) in 2011 were found. More over the difference of contents among each harvest year was found to be statistically insignificant (p<0.05).
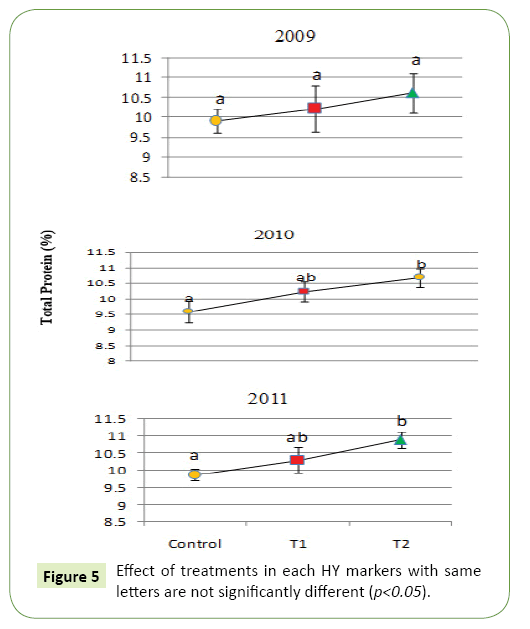
Effect of treatments on protein in each harvest year is depicted in Figure 5. The influence of T1 alone upon control was found to be statistically insignificant (p<0.05) in all harvest years whereas addition of T2 over control in harvest years 2010 and 2011 was found to be significant (p<0.05). Furthermore, in 2009 all the treatments found to be insignificantly different from each other.
Discussion
Nutrient uptake through roots begins soon after germination of rice seedlings after transplantation. The extent of accumulation of nutrients and their resultant effects are dependable of root growth. Uptake of these nutrient elements is in low at early stage of planting but as the plants continues to grow their need rise. Phosphorus and nitrogen that help improving germination of root system and vegetation are major nutrients but the requirement of some other trace nutrients is also as important as macro. All these nutrient elements contribute in several metabolic processes and are indispensable for rice plants survival [5,9]. Out of other yield contributing attributes, TGM (thousand grains mass) of paddy rice expressed grams is an important characteristic. Increase in paddy rice yield is a result of cumulative factors including environment and application of fertilizers [8]. Revealed that varietal difference in paddy rice yield and was because of the difference in genotypes. Biswas et al., and Abid et al. [10,11] reported that cultivars that produce higher number of effective tillers/hill and high number of grain/panicle resulted in higher paddy rice yield. Micronutrients as well, zinc and boron in rice fields has exerted beneficial effects not only over paddy rice yield but also on quality of polished rice. Amin et al. and Anand [12,13] have reported that application of Zn and B fertilizers in addition to N and P showed significant increase in yield and yield contributing attributes. Our results are comparable to these studies and are in line with investigations of Jones [14] who reported that significant effect of Zn and B on yield and variety.
Grain mass is influenced by nutrient supply to rice fields. This attribute directly reflect grain filling and paddy rice yield. In research studies it is found that Zn and B applied with recommended doses of nitrogen and phosphorus increased grain mass and the yield [15]. Differential thousand grain mass of paddy rice doesn’t only indicate the judicious supply of nutrient element from soil but also may be due to varied specific genetic behavior. Some varieties show higher and others lower grain mass in the similar environmental regimes. Investigations of Ashraffuzaman et al., [16] showed that difference in paddy rice mass among varieties was due to differential genetic behavior of rice plants. In present study significant responses of treatment and variety was found. Findings are in conformity of with the results obtained by Cayton et al. and Jiang et al., [17,18]. Brown PH and Hu H [19] reported that both the zinc and boron play key role for nucleic metabolism within plant system. Zinc functions as metal activator for several enzymescarbonic hydrogenase, alchohal dehydrogenase, superoxidase dismutase and ribonucleic polymerase. Protein content in rice grain in Zn-deficient soils was due to restricted synthesis of auxin or indoleacetic acid from tryptophane and ribonucleic acid synthesis [20]. Rice protein percent is directly correlated with the contents of nitrogen within plant. Application of nitrogen along with zinc significantly increased protein content of rice grain [18]. Juliano and Goddard [21] investigated environmental influences on yield and its contributing attributes and quality of polished rice grain in relation to protein and fat content. They reported that short period of growth and cloudy weather at grain filling stage particularly in submerged surroundings, are major factors increased protein percent. This is due to enhanced availability and uptake of nitrogen by plants and low volatilization losses. Environmental factor such as type of soils, ambient temperatures at grain ripening and length of growth stages showed nosignificant response over fat percent. Fertilize application, and residual mineral nutrient elements present in soil and organic matter showed significant impact on protein percent of rice grain [22]. Similar responses of protein content were studied and the investigations are in agreement with [11,23] who reported that nitrogen uptake by rice plant root system ultimately increased protein percent of rice grain.
Conclusion and Suggestion
The result obtained from the study showed that application Zn and B at 10 and 2 Kgha-1 along with recommended doses of NP increased GM and protein. Most of farmers of rice catchments are witnessed apply only Zn as an additional amendment. Based upon the result it may be suggested that economic yield and quality of rice grain irrespective of varieties may be obtained with application of both Zn and B.
References
- Gangaiah B, Parsad R (2000) Response of Scanted Rice (Oryza sativa) to fertilization. Indian J Agronomy 44: 294-296.
- GOP (2012) Economic Survey of Pakistan, Federal Bureau of Statistics. Ministry of Food and Agric.
- Bozdar L (1991) Assessing Zn availability status of wheat areas of district Hyderabad through analysis of soil and associated plant tissue. Deptt Soil Sci.
- Jamil Y, Haq Z, Iqbal M, Jamil T, Amin N, et al. (2012) Enhancement in growth and yield of mushroom (Pleurotus ostreatus) using magnetic field treatment. Int Agrophys 26: 375-380.
- Tisdale SL, Nelson WL, Bealon JD (1985) Soil fertility and fertilizers, 4th Ed. New York, Maemillan publishing Co.
- American Assoc. of Cereal Chemists (2000) Approved Methods of the AACC.
- Torrie JH, Steel RGD (1980) Principles and procedures of statistics. (2nd Ed), McGraw-Hill Book Company Inc.
- Alam SM (2003) Effect of Zinc and Boron applications on two rice genotypes. Pak J Soil 22: 67.
- Johnson SE, Lauren GE, Welch RM, Duxbury JM (2005) A comparison of the effects of micronutrient seed priming and soil fertilization on the mineral nutrition of chickpea (Cicer arietinum), lentil (Lens culinaris), rice (Oryza sativa) and wheat (Triticum aestivum) in Nepal. Experimental Agriculture 41: 427-448.
- Biswas JK, Hossain MA, Sarker BC, Hassan M, Haque MZ, et al. (1998) Yield performance of several rice varieties seeded directly as late aman crops. J Life Sci 10: 47-52.
- Abid M, Niaz A, Maqsood J, Iftikhar A (2002) Effect of zinc, iron and manganese on growth and yield of rice. Pak J Agri Sc 39: 177-180.
- Amin M, Ayaz MK, Ejaz AK, Ramzan M (2004) Effect of increased plant intensity and fertilizer doze on yield of rice variety (IRRI-6). J Res Sci 15: 9-16.
- Anand S (1993) Zinc and Manganese nutrition of wetland rice on gypsum amended sodic soils. Plant and Soils 155: 477-480.
- Jones R (1972) Comparative studies of plant growth and distribution in relation to waterlogging V The uptake of iron and manganese by dune and dune slack plants. J Ecology 60: 131-139.
- Cakmak IO, Eker S, Torun B, Kalfa HI, Yilmaz A, et al. (1997) Concentration of zinc and activity of copper/zinc-superoxide dismutase in leaves of rye and wheat cultivars differing in sensitivity to zinc deficiency. J Plant Physiol 151: 91-95.
- Ashraffuzaman M, Rafiq MD, Ismail MR, Shahidullah, Hanif SM (2009) Evaluation of six Agromatic rice varieties for yield and yield contributing characteristics. Int J Agric & Biology 11: 616-620.
- Cayton MT, Reyes ED, Neue HU (1985) Effect of zinc fertilization on the mineral nutrition of rice differing in tolerance to zinc deficiency. Plant Soil 87: 319-327.
- Jiang W, Struik PC, Keulen HV, Zhao M, Jin LN (2008) Does increased zinc uptake enhance grain zinc mass concentration in rice? Res Article 153: 135-147.
- Brown PH, Hu H (1997) Does boron play only a structural role in the growing tissues of higher plants. Plant Soil 196: 211-215.
- Cao CF, Kong LC, Wang JL, Zhao B, Zhao Z, et al. (2004) Effect of nitrogen nutrition on quality of different type of grain. J Triti crops 24: 47-50.
- Juliano BO, Goddard MS (1986) Cause of varietal difference in insulin and glucose responses to ingested rice. Plant Foods Hum Nutr 36: 35-41.
- Bowen JE (1979) Kinetics of Boron, Zinc, and Copper Uptake by Barley and Sugar Cane, IN Trace Element Stress i Plants, Pp: 6-9.
- Basu SK, Talukder NM, Rahman MM, Prodhan MY (2012) Evaluation of nutritional status of grain of Boro rice applying Chem. J Prog Sci Tech 10: 53-56.
Open Access Journals
- Aquaculture & Veterinary Science
- Chemistry & Chemical Sciences
- Clinical Sciences
- Engineering
- General Science
- Genetics & Molecular Biology
- Health Care & Nursing
- Immunology & Microbiology
- Materials Science
- Mathematics & Physics
- Medical Sciences
- Neurology & Psychiatry
- Oncology & Cancer Science
- Pharmaceutical Sciences
