ISSN : 0976-8505
Der Chemica Sinica
Growth and Characterization of Oxalic Acid Doped with Tryptophan Crystal for Antimicrobial Activity
C Muthuselvi*, A Arunkumar and G Rajaperumal
Department of Physics, Devanga Arts College, Aruppukottai, Tamilnadu, India
Abstract
Single crystals of pure oxalic acid and oxalic acid doped with tryptophan have been grown by slow evaporation method. These crystals are characterized by single crystal XRD, Powder XRD, FT-IR and UV-Visible spectral analyses. Effect of tryptophan as an impurity on the properties of oxalic acid has also been investigated. X-ray diffraction analysis indicates the crystal system as monoclinic. The functional groups have been identified using Fourier transform infrared spectral analysis. The UV-Vis spectral analysis shows that these crystals have wide transparency range in the entire visible region. The pure and doped crystals were analysed by the antimicrobial activity study against the gram positive and gram negative bacteria by disk diffusion method.
Keywords
Antimicrobial activity, Oxalic acid, Tryptophan, XRD, FT-IR, UV-Visible spectroscopy
Introduction
The organic compound of oxalic acid is act as a hydrogen-bonded material in which two carboxyl groups are joined directly [1,2]. Oxalic acid, also known as ethanedioic acid, is a naturally occurring compound which is found in many different types of vegetables. For humans, oral and topical applications of this acid are highly toxic to the body due to its bleach-like and corrosive properties [3]. The addition of amino acids in the organic material may perform changes in the lattices of crystal behavior. The effect of amino acid as dopant on the growth and the properties of single crystal were investigated by many researchers [4-9]. In the similar manner the effect of tryptophan as additives on the growth of oxalic acid was investigated in present study by employing various characterization techniques such as single crystal XRD, powder XRD, FT-IR, UV-Visible spectroscopy and antimicrobial activity studies.
Materials and Methods
Materials
The materials used for this crystallization are oxalic acid; deionized water and tryptophan were purchased from the Merck, India Ltd, Mumbai.
Slow evaporation method
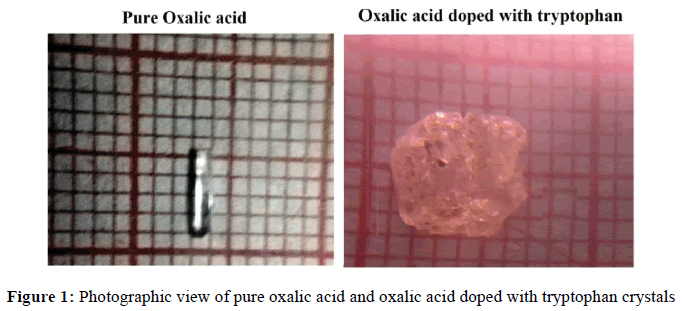
Analytical Reagent grade of oxalic acid and tryptophan are taken in the equimolar ratio (1:1) and dissolved in doubly deionized water. The solution was stirred well at constant rate to get homogeneity. The solution was transferred to a beaker and it was allowed to evaporate at room temperature for a few days to get the crystal. Similar procedure was followed to obtain the pure oxalic acid. Good quality crystals of pure and doped crystals are yielded within a period of 15 to 20 days. The photographic view of the grown crystals is shown in Figure 1.
Results and Discussion
Single crystal XRD analyzes
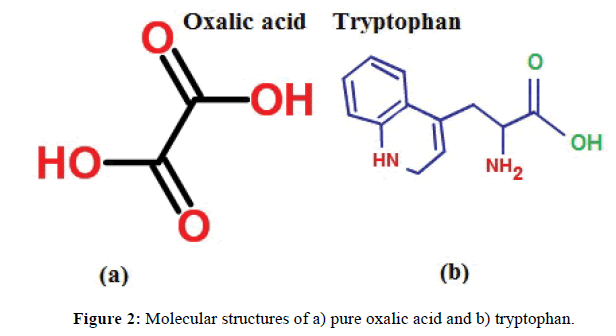
The measurement of unit cell dimensions of pure oxalic acid and oxalic acid doped with tryptophan crystals are carried out using the SMARTAPEX CCD area-detector diffractometer with Mo Kα radiation (λ=0.71073 Å). It gives the unit cell parameter values of the pure oxalic acid and oxalic acid doped with tryptophan crystals. The unit cell dimensions for doped oxalic acid tryptophan crystal are compared with that of pure oxalic acid crystal and are given in Table 1. The molecular structures of oxalic acid and tryptophan are depicted in Figure 2a and Figure 2b respectively.
| Cell parameters | Pure oxalic acid | Oxalic acid doped with tryptophan |
|---|---|---|
| a | 6.114 A˚ | 6.113 A˚ |
| b | 3.587A˚ | 3.605A˚ |
| c | 12.011A˚ | 11.866A˚ |
| α | 90◦ | 90◦ |
| β | 106.13◦ | 103.18◦ |
| γ | 90◦ | 90◦ |
| v | 253.1 Å3 | 254.6Å3 |
| Crystal system | Monoclinic | Monoclinic |
Table 1: Unit cell parameter values of pure oxalic acid and oxalic acid doped with tryptophan crystals
It was observed from the single XRD measurement that pure and doped crystals belong to monoclinic system. The addition of tryptophan in oxalic acid slightly changes the crystal lattice of pure oxalic acid. This lattice distortion of pure oxalic acid confirms the incorporation of tryptophan into lattice site of oxalic acid crystal.
Powder XRD analyzes
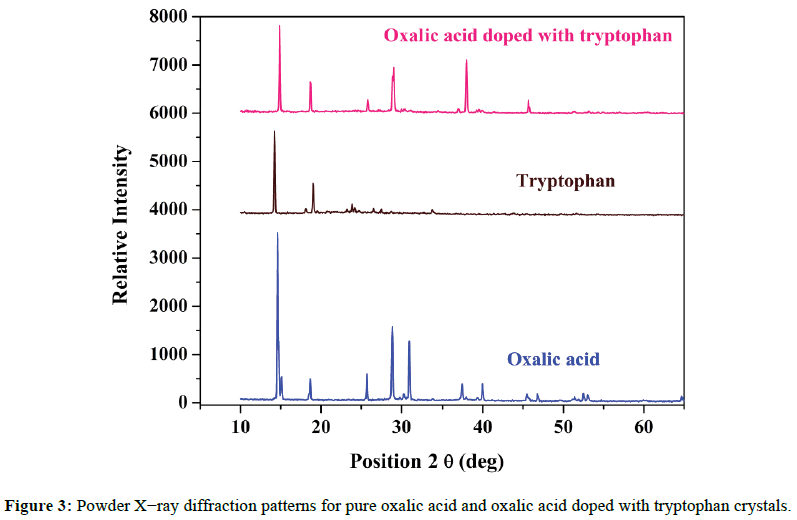
Powder X-ray diffraction analysis was carried out to pure and doped crystals using a XPERT-PRO X-ray diffractometer with Cu Kα (λ=1.54060 Å) radiation. It is used to identify crystalline phases and to qualitatively examine changes in crystallinity. The PXRD diffractograms of pure oxalic acid, tryptophan and the oxalic acid doped with tryptophan crystals are shown in Figure 3. The d-spacing and 2θ values of oxalic acid doped with tryptophan are compared with that of pure oxalic acid crystal which is shown in Table 2. This study reveals that 2θ and d-spacing values of doped crystal are different from that of pure oxalic acid crystal which confirms the presence of tryptophan in the oxalic acid crystal.
| Pure oxalic acid | Pure Tryptophan | Oxalic acid doped with tryptophan | |||
|---|---|---|---|---|---|
| Position [°2θ] | d–spacing [Å] | Position [°2θ] | d–spacing [Å] | Position [°2θ] | d– spacing [Å] |
| 14.5888 | 6.07193 | 14.2329 | 6.22295 | 14.8742 | 5.95606 |
| 15.1026 | 5.86649 | 18.1173 | 4.89654 | 18.6935 | 4.74689 |
| 18.6601 | 4.75532 | 19.0364 | 4.66215 | 25.8245 | 3.45002 |
| 25.7377 | 3.46146 | 23.2532 | 3.82536 | 29.0711 | 3.07170 |
| 28.8703 | 3.09261 | 23.8829 | 3.72591 | 30.4427 | 2.93635 |
| 30.2872 | 2.95108 | 26.5678 | 3.35516 | 34.4203 | 2.60560 |
| 30.9862 | 2.88608 | 33.6879 | 2.66055 | 36.9690 | 2.43161 |
| 33.7763 | 2.65379 | 43.8313 | 2.06552 | 37.9731 | 2.36959 |
| 37.4101 | 2.40395 | 49.6522 | 1.83615 | 39.6691 | 2.27210 |
| 37.9522 | 2.37085 | - | - | 41.3454 | 2.18378 |
| 39.3222 | 2.29135 | - | - | 45.7156 | 1.98467 |
| 39.9675 | 2.25583 | - | - | 51.3322 | 1.77994 |
| 45.4587 | 1.99529 | - | - | 53.1674 | 1.72275 |
| 46.8252 | 1.94020 | - | - | 54.3159 | 1.68900 |
| 49.5899 | 1.83831 | - | - | 54.9480 | 1.67106 |
| 51.4138 | 1.77731 | - | - | 57.0200 | 1.61516 |
| 52.4920 | 1.74331 | - | - | 60.3803 | 1.53307 |
| 53.0482 | 1.72634 | - | - | - | - |
| 60.0623 | 1.54042 | - | - | - | - |
| 64.6839 | 1.44108 | - | - | - | - |
| 66.5815 | 1.40338 | - | - | - | - |
| 70.2638 | 1.33858 | - | - | - | - |
| 80.0746 | 1.19744 | - | - | - | - |
Table 2: Powder XRD data of pure oxalic acid, pure tryptophan and oxalic acid doped with tryptophan crystals
From the powdered X-ray analysis, it was confirmed that both pure and doped crystals crystallized in the monoclinic structure. Narrow peaks indicate the good crystallinity of the material. Some new peaks were observed in XRD patterns by doping with tryptophan amino acid. Due to the slight changes in intensity of some peaks were observed as a result of doping. There is also a slight change in the lattice parameters of the doped crystals. The slight change in the intensity of peaks and lattice parameters may be due to lattice distortion by doping in the parent crystal. Hence it is revealed that dopant can enter in the lattice of oxalic acid without causing much distortion.
The crystalline size of the pure and doped crystals were determined by using the Debye-Scherrer equation, which can be written as
D=Kλ/(β Cosθ) (1)
Where,
D=crystallite size
K=dimensionless shape factor (0.94)
λ=wavelength of X-ray radiation (Cu Kα =1.54060 Å)
θ=diffraction angle
β=Full width at half maximum intensity
The Dislocation density can be calculated from,
δ=(1/D2)m2 (2)
Where,
δ=dislocation density,
D=crystallite size
The average crystalline size of oxalic acid is found to be as 30 nm. But the crystalline size of the doped oxalic acid is decreased to 23 nm which confirms the presence of tryptophan in the crystal lattice of oxalic acid (Table 3). Also the dislocation density of oxalic acid is smaller than that of doped oxalic acid crystal.
| XRD parameters | Oxalic acid | Oxalic acid doped with tryptophan |
|---|---|---|
| Average crystalline size | 30 nm | 23 nm |
| Dislocation density | 1.12 × 10¹⁵ m2 | 1.93 ×10¹⁵ m2 |
Table 3: Average Crystalline size and Dislocation density results.
Vibrational analysis
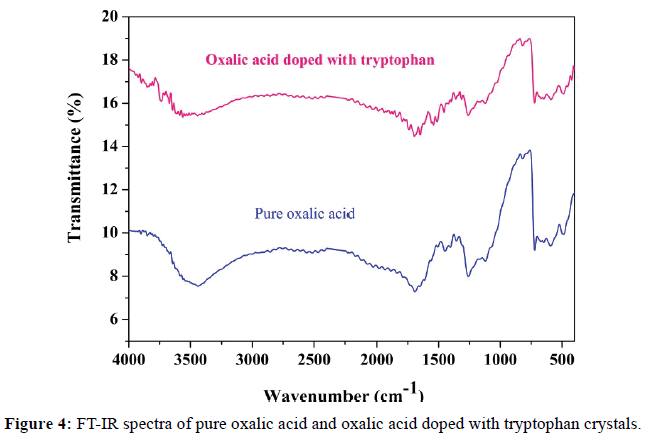
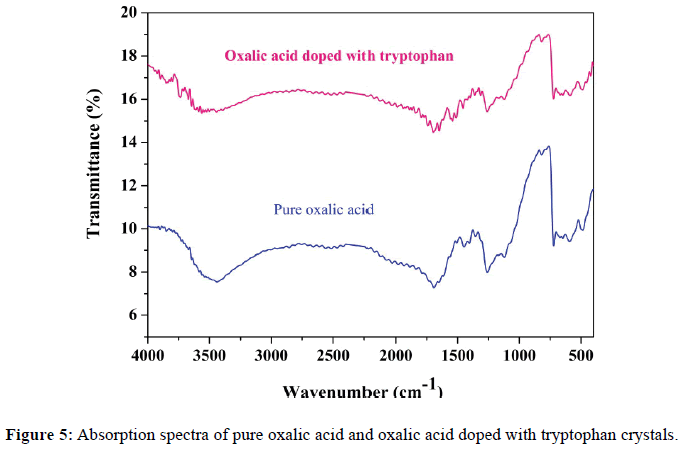
FT-IR spectrum of the pure and doped oxalic acid crystals were carried out using SHIMADZU FT-IR spectrometer in the range 4000-400 cm-1. This study is used to characterize the vibrations of various functional groups present in both crystals. The observed FT-IR spectra for pure doped crystals are given in Figure 4. The detailed assignments of absorption bands/peaks observed in the FT-IR spectrum of pure and doped oxalic acid crystals are shown in the Table 4.
| Pure oxalic acid | Oxalic acid doped with tryptophan | Assignment |
|---|---|---|
| FT – IR (á¿¡ / cm-1) | FT – IR (á¿¡ / cm-1) | |
| – | 3563(m) | u N-H |
| – | 3345(m) | uas NH2 |
| – | 3280(w) | usNH2 |
| 1762(s) | 1742(s) | u C=O |
| – | 1605(sh) | u C=C |
| – | 1580(w) | u C-C |
| – | 1541(m) | δNH2 |
| – | 1456(w) | δCH2 |
| 1354(w) | 1362(w) | β (OH) |
| – | 1315(w) | u C-N+ wCH2 |
| 1260(s) | 1260(s) | u C-O |
| – | 1167(w) | ρNH2 |
| – | 915(sh) | ωNH2 |
| – | 856(sh) | ρCH2 |
| 820(w) | 820(w) | γ (OH) |
| – | 455(w) | γ -NH |
Table 4: Observed wavenumbers in both spectra and their assignments for pure oxalic acid and oxalic acid doped with tryptophan crystals
Vibrations of oxalic acid
The organic compound of oxalic acid has two carboxylic acid COOH groups (Figure 2a). The -C(=O)OH group is characterized by the OH stretch, the C=O stretch, C-O stretch, OH in-plane deformation and the OH out-of-plane deformation modes.
Carboxylic group vibration
The C=O stretching vibration in the spectra of carboxylic acids gives rise to strong band in the region 1725 ± 65 cm-1 [10,11]. In the present study, C=O stretching mode is attributed at 1762 cm-1( weak) and 1742 cm-1 (strong) bands in IR spectrum for pure oxalic acid oxalic acid doped with tryptophan respectively. The C=O in-plane deformation is weakly to moderately active in the region 725 ± 95 cm-1. The bands observed at 721 cm-1 and 723 cm-1 are assigned as β (C=O) mode of pure and doped oxalic acid crystals respectively. The C=O rock has a weak intensity peak in the region 445 ± 120 cm-1. In the present case it is observed at 488 cm-1 and 490 cm-1 in IR spectrum of pure and doped crystals respectively. The C-O stretching of carboxylic acids appears near the region 1320 cm-1 to 1210 cm-1 in the spectra [12,13]. In the present study, the C-O stretching of carboxylic acid is identified at 1260 cm-1 in the IR spectrum of both compounds. The OH in-plane deformation is expected in the region 1390 ± 55 cm-1. The out-of-plane OH deformation exhibits a moderate band in the region 905 ± 65 cm-1 [14]. The band observed at 1354 cm-1 is assigned as β (OH) of carboxylic group of pure oxalic acid. But this mode is shifted to 1362 cm-1 for oxalic acid doped with tryptophan. The γ (OH) mode is identified at 820 cm-1 in IR spectrum of both compounds.
Vibrations of tryptophan
The aromatic amino acid of Tryptophan has an amino group, carboxyl group with one five-membered ring with a nitrogen atom bonded to a benzene ring (Indole ring, Figure 2b).
Amino group vibrations: The NH2 antisymmetric stretching and symmetric stretching vibrations of primary amine occurs in the region 3365 ± 25 cm-1 and 3290 ± 30 cm-1 respectively [15]. In the vibrational spectra of oxalic acid doped with tryptophan show the absorption peaks at 3345 cm-1 and 3280 cm-1 are assigned to antisymmetric and symmetric stretching of NH2 modes respectively. The NH2 scissoring vibration gives rise to a broad strong band in the region 1600 ± 50 cm-1 [14,15]. For oxalic acid doped with tryptophan, this mode is identified at 1541 cm-1 in the IR spectrum. The NH2 torsion is expected in the region 290 ± 130 cm -1. Rocking/twisting NH2 mode is expected in the region 1160 ± 140 cm-1. In the present case, it is attributed at 1167 cm-1 in the IR spectrum. The wagging mode of NH2 group show broad band at 840 ± 55 cm-1 in IR. For the doped crystal, the band observed at 915 cm-1 (IR) is assigned as ωNH2 mode. The C-N stretching vibration of the amide group is only weakly to moderately active in the region 1385 ± 85 cm-1 and is difficult to detect. But this mode is downshifted to 1315 cm-1 in the IR spectrum of doped oxalic crystal due to the formation of hydrogen bonding.
CH2 group vibrations: Normally, the antisymmetric stretch(υ asCH2), symmetric stretch (υsCH2), scissoring ( δ CH2) and wagging vibration (ω CH2) of the CH2 group appear in the regions 3000 ± 50, 2965 ± 30, 1455 ± 55 and 1350 ± 85 cm, respectively [12,14]. The antisymmetric and symmetric stretching of CH2 group bands is not observed experimentally in IR spectrum of doped oxalic acid crystal. The scissoring and wagging modes of CH2 group are observed at 1456 cm-1 and 1315 cm-1 in the IR spectrum of doped oxalic crystal with tryptophan. The rocking mode of ρ CH2 is expected in the range 895 ± 85 cm-1[14]. The band at 856 cm-1 in the IR spectrum is assigned as ρ CH2 mode for the doped compound.
Indole ring vibrations: Absorption arising from C-H stretching mode of benzene ring occurs in the general region of 3000 cm-1 to 2840 cm-1 [10,11]. The CH stretching vibration is not observed experimentally. The ring carbon-carbon (C=C) stretching vibration occurs nearly in the region 1600 and 1500 cm-1 and is usually stronger [14]. In the present work, the C=C modes are observed experimentally as weak bands at 1605 cm-1 for doped crystal. In the case of substituted benzene, the C-C stretching mode vibrations produce the bands at 1620 cm-1 to 1565 cm-1 with the groups [15]. In the present work, the band at 1580 cm-1 in IR spectrum is assigned to C-C stretching vibration for doped oxalic crystal only. The N-H stretching mode is observed between 3700 cm-1 to 3100 cm-1 in the IR spectrum [10]. This mode is observed at 3563 cm-1 in the IR spectrum of doped oxalic crystal with tryptophan crystal only. The N- H out-ofplane bending is assigned to 455 cm-1 in the present work of oxalic acid doped with tryptophan crystal.
Ultraviolet visible spectroscopy analyzes
The UV-Visible spectroscopy analyzes is one of the most frequently employed techniques to analyze the pharmaceutical compound. The optical transmittance and absorption spectrum of grown crystals has been recorded with SHIMADZUUV1800, double beam spectrometer. Transmittance and absorbance data were observed for both crystals in the wavelength range 200-1100 nm insteps of 1 nm. The slit width chosen was 1 nm. The wavelength rate was in medium mode. The observed values of absorbance were recorded and stored in the memory of a computer and plotted. The absorbance spectrum of pure oxalic acid and oxalic acid doped with tryptophan crystals is shown in Figure 5.
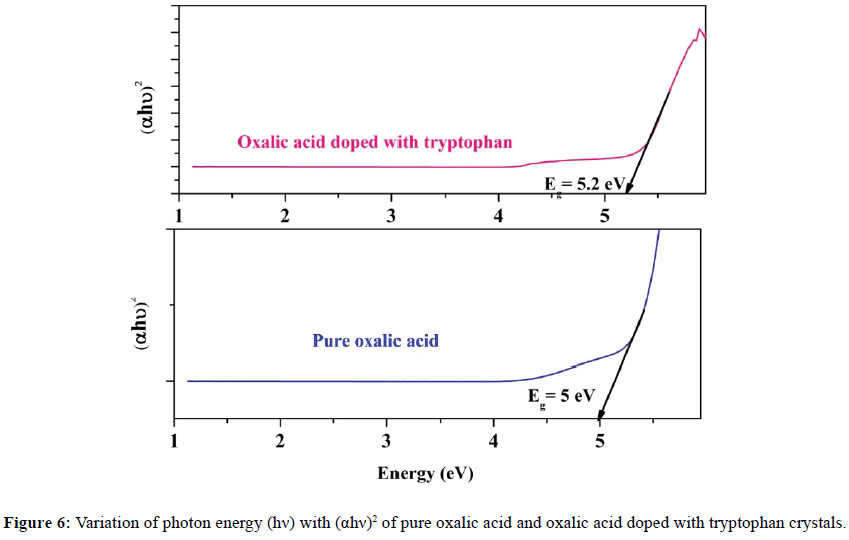
The maximum absorbance wavelength (λmax) for pure and doped oxalic acid crystals are found to be at 214 nm, 207 nm and the lower cut-off wavelength is observed at 289 nm, 299 nm respectively. From the absorbance spectrum, the pure and doped oxalic acid crystals shows the good transmittance in the entire range of visible region.
The band gap of the crystals were estimated by using the following the relation [16].
Eg=(1.243 × 10³)/λmax (3)
The optical band gap was evaluated by plotting (αhν)2 vs. hν as shown in Figure 6 and extrapolating the linear portion of absorption edge (αhν)2 to the photon energy axis gives the optical band gap of the crystal. The band gap value of the crystal was found to be as 5 eV and 5.2 eV for pure and doped oxalic acid crystals respectively. The band gap value slightly increases while the dopant was added to pure oxalic acid. The high value of band gap indicates that the grown crystals may be act as a typical of dielectric material. It is also inferred from the spectra that both pure and doped crystals have large transmission window in the entire visible region. The incorporation of tryptophan in the oxalic acid compound as a dopant progressively improved the optical quality of oxalic acid crystals with higher transparency.
Antimicrobial activity study
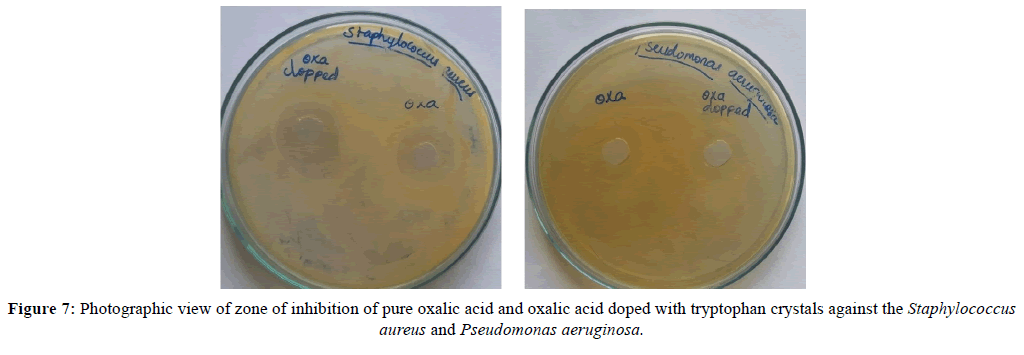
The antimicrobial activities of pure and doped crystals were analyzed by disk diffusion method. They are tested by two different microorganisms (Staphylococcus aureus and Pseudomonas aeruginosa). Their consultancy results are shown in Table 5. The photographic view of zone of inhibition of both microorganisms for pure and doped crystals is shown in Figure 7.
| S. No. | Microorganisms | Zone of Inhibition in mm (50μl) | |
|---|---|---|---|
| Oxalic acid | Oxalic acid doped with tryptophan | ||
| 1 | Staphylococcus aureus | 12 | 17 |
| 2 | Pseudomonas aeruginosa | 10 | 11 |
Table 5: Antibacterial activity of oxalic acid and oxalic acid doped with tryptophan crystals against Staphylococcus aureus and Pseudomonas aeruginosa bacterial strains.
This results show that doped oxalic acid crystal enhance the antimicrobial activity against the Staphylococcus aureus than the Pseudomonas aeruginosa microorganism species. Due to the drug resistance property of Pseudomonas aeruginosa gram negative bacteria, pure and doped crystal has almost the same diameter of zone of inhibition.
Conclusion
Pure oxalic acid and oxalic acid doped with tryptophan are grown by slow evaporation method. Single crystal XRD and powder XRD studies confirm that both the pure and doped oxalic acid crystals belong to monoclinic system. The data obtained by XRD analysis and evaluation of lattice parameters have confirmed that the dopant tryptophan has entered into the lattices of oxalic acid crystals. The FT-IR study confirmed the presence of functional groups of the oxalic acid and tryptophan. The UV-Vis spectral analysis reveals that the pure and doped crystals have high transparency in the entire visible region. The antimicrobial test is performed for pure and doped oxalic acid crystals against the gram positive and gram negative bacteria. This results shows that dopant of tryptophan enhance the antimicrobial activity of oxalic acid. Finally, it is concluded that the dopant crystal may be used in the pharmaceutical field for medical application.
Aknowledgement
The authors sincerely acknowledge their thanks to the Management and Principal of Devanga Arts College, Aruppukottai for their permission and encouragement during their research work.
References
- Jung HW, Tschaplinski TJ, Wang L, Glazebrook J, Greenberg JT (2009) Priming in Systemic Plant Immunity. Science324: 89-91.
- Dembitsky VM,Goldshlag P, Srebnik M (2002) Occurrence of dicarboxylic (dioic) acids in some Mediterranean nuts. Food Chem76: 469-473.
- Pucher GW, Wakeman AJ, Vickery HB (1938) The organic acids of rhubarb (Rheum hybridium). III. The behavior of the organic acids during culture of excised leaves. J BiolChem126: 43.
- Bhagavannarayana G, Parthiban S, Meenakshisundarm SP (2006) Enhancement of crystalline perfection by organic dopants in ZTS, ADP and KHP crystals as investigated by high-resolution XRD and SEM. J ApplCryst39: 784-790.
- Natarajan V, Arivanandhan M, Sankaranarayanan K, Ramasamy P (2008) Growth aspects and characteristic properties of pure and Li-doped l-arginine acetate (LAA) single crystals: A promising nonlinear optical material. J Cryst Growth 311: 572-575.
- Meena M, Mahadevan CK (2010) Effect of Added Impurities on the Electrical Properties of L-Arginine Acetate Single Crystals. Arch ApplSci Res2: 185-199.
- Kanagathara N, Anbalagan G (2011) Growth, Optical and Dielectric Studies on Pure and L-Lysine Doped KDP Crystals. Int J Chem Res1: 115.
- Gnanasekaran P, Madahvan J (2008) L–Arginine Acetate Single Crystals for NLO Applications.Indian J SciTechnol 1: 1-2.
- Abbas JJ, Pandey JR (2015) Growth and structural analysis of doped KDP Crystals: Gel Technique. RASAYAN J Chem8: 67-171.
- Colthup NB, Daly LH, Wiberly SE (1985) Introduction to Infrared and Raman Spectroscopy, 2nd ed., Academic Press, New York.
- Roeges NPG (1994) A Guide to the Complete Interpretation of Infrared Spectra of Organic Structures, Wiley, New York.
- Silverstein RM, Webster FX (2003) Spectrometric Identification of Organic Compounds. 6thEdn., John Wiley, Singapore.
- Bellamy LJ (1975) The Infrared Spectra of Complex Molecules. 3rd Ed.,Chapman and Hall, London.
- Fischmeister I (1964) Relation between the frequency of the hydroxyl out-of-plane deformation vibration and the hydrogen bond length in carboxylic acids. SpectrochimActa20: 1071.
- Sumayya A, Yohanna PC, Varghese HT, Harikumar B (2008) Vibrational spectroscopic studies and AB initio Calculations of L-Glutamic Acid 5-Amide. Rasayan JChem1: 548-555.
- Radhika PV, Jayakumari K, Mahadevan CK (2013) Growth and Characterization of Pure and Oxalic Acid Doped L Arginine Acetate Single Crystals. Int J Eng Res Appl3: 1841-1849.

Open Access Journals
- Aquaculture & Veterinary Science
- Chemistry & Chemical Sciences
- Clinical Sciences
- Engineering
- General Science
- Genetics & Molecular Biology
- Health Care & Nursing
- Immunology & Microbiology
- Materials Science
- Mathematics & Physics
- Medical Sciences
- Neurology & Psychiatry
- Oncology & Cancer Science
- Pharmaceutical Sciences
