ISSN : 2249 - 7412
Asian Journal of Plant Science & Research
Genetic Variability Analysis of Elite Sorghum (Sorghum Bicolor (L.) Moench) Genotypes under Dry Lowland Areas of Ethiopia
Temesgen Begna*
Department of Agricultural Research, Ethiopian Institute of Agricultural Research, Chiro National Sorghum Research and Training Center, P. O. Box 190, Chiro, Ethiopia
- *Corresponding Author:
- Temesgen Begna
Department of Agricultural Research,
Ethiopian Institute of Agricultural Research,
Chiro National Sorghum Research and Training Center,
P. O. Box 190,
Chiro,
Ethiopia,
Tel: 0921196966;
Email: tembegna@gmail.com
Received date: April 14, 2023, Manuscript No. AJPSKY-23-16385; Editor assigned date: April 17, 2023, PreQC No. AJPSKY-23-16385 (PQ); Reviewed date: May 01, 2023, QC No. AJPSKY-23-16385; Revised date: January 15, 2024, Manuscript No. AJPSKY-23-16385 (R); Published date: January 22, 2024, DOI: 10.36648/2249-7412.14.1.314
Citation: Begna T (2023) Genetic Variability Analysis of Elite Sorghum (Sorghum Bicolor (L.) Moench) Genotypes under Dry Lowland Areas of Ethiopia. Asian J Plant Sci Res Vol:14 No.1:314
Abstract
Narrow genetic base, early maturing and drought tolerant Sorghum genotypes are the most important limiting factors for Sorghum yield improvement under moisture stress areas. Therefore, the experiment was conducted to quantify the genetic variation available among Sorghum genotypes for drought tolerance related traits. A total of 42 Sorghum genotypes were evaluated using alpha lattice experimental design with two replications at Mieso and Kobo during the main cropping season of 2019. The combined analyses of variance revealed the presence of substantial genetic variation among Sorghum genotypes for all the studied traits over locations. Among the traits with high genotypic coefficient of variation and heritability estimate, plant height, panicle exersion and panicle yield were linked with higher values of genetic advance as percentage of mean, reflecting the variability of these traits is controlled by additive gene action. The high heritability and genetic advance as percent of mean were obtained for plant height (95.63% and 45.39%), 1000 seed weight (77.98% and 23.86%), panicle exertion (74.87% and 51.88%) and panicle yield (65.43% and 37.32%) in the same order. The maximum grain yield was obtained from a hybrid 4 × 14 (6.32 tha-1) followed by hybrid 8 × 15 (5.92 tha-1), 1 × 15 (5.88 tha-1), 13 × 14 (5.78 tha-1) and 6 × 15 (5.57 tha-1) with the average value of 5.00 tha-1 which had higher mean value than the mean of the parents and the check (ESH-4). Hence hybrids have been found to be better suited than their parents and open pollinated variety to drought stress environments as a result of earliness, better adaptation and yield performance. In general, this study showed the existence of genetic variability in Sorghum genotypes for different traits grown under moisture stress condition, providing opportunity to select several promising genotypes with key traits related to drought tolerance.
Keywords
Genotypic coefficient of variation; Phenotypic coefficient of variation; Drought; Broad sense heritability; Genetic gain as percent of mean
Introduction
Sorghum (Sorghum bicolor (L.) Moench; 2n=20) is the 5th most important cereal grain after maize, rice, wheat and barley in the world [1]. Sorghum is grouped under C4 tropical crop which belongs to the family poaceae [2]. Ethiopia is the country of origin for Sorghum and has domesticated with wide ranges of collections for various agro ecologies [3]. Ethiopia is the second largest Sorghum producing country in Eastern Africa next to Sudan. Sorghum stands third in terms of area coverage after teff and maize and second next to maize in terms of productivity (2.7 tha-1) in Ethiopia [4]. Sorghum is grown globally for food purposes in dry land agriculture and has wider adaptability to drought prone areas [5]. It has a short growth period and relatively drought tolerant, which makes Sorghum a preferred cereal in arid and semi-arid regions [6]. The wider range of environmental adaptation of grain Sorghum has led to the evolution and existence of extensive genetic variation for drought tolerance [7].
Nowadays, the world food demand is increasing with the increasing world population and climate change. Hence Sorghum is expected to play significant role in the area where other cereal crops are rarely produced due to water scarcity. As food grade, special attention is given to Sorghum because it is gluten free and contains high levels of health promoting phytochemicals [8]. Sorghum has been improved to a great extent for grain yield and is primarily used as a food crop in developing countries [9,10]. Sorghum is one of the most important cereal crops supporting the lives of millions of people across the globe and particularly in the developing world [11]. Sorghum is used for biofuel production, beer production and silage [12-14].
The presence of large amount of cultivated and wild relatives of Sorghum in Ethiopia is the indicator of the existence of substantial genetic variability [15]. Sorghum has a wide range genetic diversity being it is an indigenous crop [16]. Sufficient genetic diversity is required for plant breeding programs to assist production of new improved cultivars against various stresses and increase of yield [17]. Studying the variation of heritable characteristics and biochemical composition of Sorghum germ plasm is very important for several reasons [18]. Knowledge of genetic diversity of the genetic material is very critical in crop improvement [19].
Phenotypic and genotypic coefficients of variation are two critical variability terms which used to measure the extent of genetic variability and measures the magnitude of variation in different characters. Genotypic component of variation is very relevant in crop improvement since it is the only component to be transmitted to the subsequent generation. Effective selection is highly important in any crop improvement in addition to Sorghum where the sufficient genetic variation is available for different characters [20]. Heritability is the proportion of the phenotypic variance that is genetic in origin which is transferred from parents to their offspring. Success of breeders in changing the characteristics of a population depends on the degree of correspondence between phenotypic and genotypic values [21]. Identification of the heritable and non-heritable genetic component is vital for devising suitable breeding method for improvement. Heritability estimation implies the possibility and extent to which improvement is possible through selection [22].
The estimation of heritability and genotypic coefficient of variation would provide important information about the efficiency of selection [23]. Both high heritability and genetic advances manifest the existence of additive gene action and the possibility of crop improvement through selection [24]. The genotypic coefficient of variation is solely indicator of the presence of high degree of genetic variation, however the amount of heritable portion of variation can only be determined with the help of estimates of heritability and genetic advance. Heritability and genetic advance have great role to play in deciding the effectiveness of selection of characters for improvement. Phenotypic expression is the result of genotype, environment and genotype environmental interaction and yield is the result of several different factors [25]. Heritability and genotypic coefficient of variation necessarily indicate presence of genetic variability to what extent in each population for improvement. Heritability is a basic tool for the improvement of quantitative traits which determines the selection intensity and efficiency in plant breeding [26]. Broad sense heritability is ratio of the total genotypic variance to the total phenotypic variance whereas the narrow sense heritability is the ratio of additive variance to phenotypic variance. It reflects the extent to which phenotypes are determined by the genes transmitted by the parents [27].
The ratio expresses the magnitude of genotypic variance in the population is mainly due to the genetic composition of a population through selection. Heritability is used to separate genetic variation from environmental variation and is a measure of the relative influence of genetic versus non-genetic effects on the expression of a trait and explains the variation that is transferred from parents to off spring. There is a potential to increase so Sorghum rghum productivity from 3 tha-1 to 6 tha-1 using improved varieties and production technologies [28]. Despite its importance, Sorghum yield is low in Ethiopia as compared to its potential mainly because of the use of low yielding cultivars, biotic and abiotic stresses. Continued use of low yielding traditional cultivars was another issue reducing grain yield in Sorghum [29]. In Ethiopia, 99.6% of the total area under Sorghum is covered by local cultivars, which are less productive [30]. From abiotic stresses, drought is one of the major yields limiting factors in the dry lowland Sorghum growing areas of Ethiopia. It is characterized by either one or more of delay in onset, dry spell after sowing, drought during critical crop stage and too early stop.
Over 80% of Sorghum in Ethiopia is produced under severe to moderate drought stress conditions [31]. Overcoming these difficult challenges will be harder under drought condition due absence genetic variability and lower heritability of the character under selection [32]. The genetic variability analysis of Sorghum genotypes for different agronomical and morphological characters are very critical in providing opportunity to select a number of promising genotypes with key traits related to drought tolerance. Generally, Sorghum genotypes characterized by early flowering and early maturity, small number of leaves per plant, small leaf area, erect leaf type, larger stem diameter, small number of productive tillers, small leaf area, high grain yield per unit area and short plant height are most suitable for lowland areas with a limited rain fall and short growing season [33]. Hence, the development of locally adapted improved Sorghum varieties to a particular environment is one solution to overcome the challenges of both local adaptation and local farmers’ end use requirements. Therefore, the experiment was conducted to address the objectives to quantify the magnitude of genetic components of variation of Sorghum genotypes for yield and yield related characters.
Materials and Methods`
Location of the experiment
An experiment was conducted across two dry lowland Sorghum growing environments. These were Mieso and Kobo, where Sorghum is predominantly produced and drought is a major limiting factor for the productivity. These locations represent the Eastern and Northern Sorghum growing parts of the country. Mieso is located 302 kilometers away in the Eastern from Addis Ababa, the capital city of Ethiopia in Oromia regional state. Its elevation is 1470 metres above sea level and is located at 8°C 30΄N latitude and 39°C 21΄E longitudes and with having average maximum and minimum temperatures of 14.0°C and 30.01°C and with an average annual rainfall 763 mm. The dominant soil type is vertisols with pH 5 [34]. Kobo is located 437 kilometers away in the northern from Addis Ababa, the capital city of Ethiopia in Amara regional state. Its elevation is 1479 m.a.s.l. and situated at 12°C 09΄N latitude and 39°C 38΄E longitude. An average maximum and minimum temperature of the 15.32°C and 30.24°C with an average annual rainfall 650 mm. The dominant soil type is vertisols with pH 5.8.
Genetic materials
The experiment involved 2 male parents and 13 cytoplasmic male sterile lines as female parents along with their 26 hybrids and one check. These 15 parents (2 males and 13 females) were crossed at Werer Agricultural Research Center (WARC). A total of 42 genotypes, comprising of hybrids, their parents and check were used in this study. Parental inbred lines were developed by pedigree breeding method and back crossing method for the incorporation desirable genes that responsible for improving yield and other important traits. TX-623B, P-9501B, P-9505B, P-9534B, P-851015B, P-850341B, P-9511B, B5 and B6 were introduced from Perdue university as cytoplasmic male sterile lines and Sorghum improvement program is using for different breeding objectives including hybrid development whereas MARC1B, MARC2B, MARC3B, MARC6B were developed and released by national Sorghum coordinating center, Melkassa Agricultural Research Center (MARC) as cytoplasmic male sterile lines and ESH-4 hybrid was recently released and used as a standard check. Melkam and ICSR-14 were developed by Melkassa Agricultural Research Center (MARC) and ICRISAT (India) respectively as restorer lines for low moisture stress areas (Table 1).
| Entry | Genotypes | Pedigree | Source |
|---|---|---|---|
| 1 | TX-623B | TX-623B | 2018 MW CAS #8B |
| 2 | P-9501B | P-9501B | 2018 MW CAS #9B |
| 3 | P-9505B | P-9505B | 2018 MW CAS #10B |
| 4 | P-9534B | P-9534B | 2018 MW CAS #14B |
| 5 | P-851015B | P-851015B | 2018 MW CAS #15B |
| 6 | P-850341B | P-850341B | 2018 MW CAS #17B |
| 7 | B5 | B5 | 2018 MW CAS #21B |
| 8 | B6 | B6 | 2018 MW CAS #22B |
| 9 | MARC1B | MARC1B | 2018 MW CAS #23B |
| 10 | MARC2B | MARC2B | 2018 MW CAS #24B |
| 11 | MARC3B | MARC3B | 2018 MW CAS #25B |
| 12 | MARC6B | MARC6B | 2018 MW CAS #28B |
| 13 | P9511B | P9511B | 2018 MW CAS #32B |
| 14 | Melkam | Melkam | 2018 BS Inc. |
| 15 | ICSR-14 | ICSR-14 | 2018 BS Inc. |
| 16 | ESH-4 | ESH-4 | 2018 BS Inc. |
| 17 | TX-623A X ICSR-14 | TX-623A X ICSR-14 | 2018 MW CAS #8A X 34R |
| 18 | P-9501A X ICSR-14 | P-9501A X ICSR-14 | 2018 MW CAS #9A X 34R |
| 19 | P-9505A X ICSR-14 | P-9505A X ICSR-14 | 2018 MW CAS #10A X 34R |
| 20 | P-9534A X ICSR-14 | P-9534A X ICSR-14 | 2018 MW CAS #14A X 34R |
| 21 | P-851015A X ICSR -14 | P-851015A X ICSR -14 | 2018 MW CAS #15A X 34R |
| 22 | P-850341A X ICSR-14 | P-850341A X ICSR-14 | 2018 MW CAS #17A X 34R |
| 23 | A5 X ICSR-14 | A5 X ICSR-14 | 2018 MW CAS #21A X 34R |
| 24 | A6 X ICSR-14 | A6 X ICSR-14 | 2018 MW CAS #22A X 34R |
| 25 | MARC1A X ICSR-14 | MARC1A X ICSR-14 | 2018 MW CAS #23A X 34R |
| 26 | MARC2A X ICSR-14 | MARC2A X ICSR-14 | 2018 MW CAS #24A X 34R |
| 27 | MARC3A X ICSR-14 | MARC3A X ICSR-14 | 2018 MW CAS #25A X 34R |
| 28 | MARC6A X ICSR-14 | MARC6A X ICSR-14 | 2018 MW CAS #28A X 34R |
| 29 | P9511A X ICSR-14 | P9511A X ICSR-14 | 2018 MW CAS #32A X 34R |
| 30 | TX-623A X Melkam | TX-623A X Melkam | 2018 MW CAS #8A X 33R |
| 31 | P-9501A X Melkam | P-9501A X Melkam | 2018 MW CAS #9A X 33R |
| 32 | P-9505A X Melkam | P-9505A X Melkam | 2018 MW CAS #10A X 33R |
| 33 | P-9534A X Melkam | P-9534A X Melkam | 2018 MW CAS #14A X 33R |
| 34 | P-851015A X Melkam | P-851015A X Melkam | 2018 MW CAS #15A X 33R |
| 35 | P-850341A X Melkam | P-850341A X Melkam | 2018 MW CAS #17A X 33R |
| 36 | A5 X Melkam | A5 X Melkam | 2018 MW CAS #21A X 33R |
| 37 | A6 X Melkam | A6 X Melkam | 2018 MW CAS #22A X 33R |
| 38 | MARC1A X Melkam | MARC1A X Melkam | 2018 MW CAS #23A X 33R |
| 39 | MARC2A X Melkam | MARC2A X Melkam | 2018 MW CAS #24A X 33R |
| 40 | MARC3A X Melkam | MARC3A X Melkam | 2018 MW CAS #25A X 33R |
| 41 | MARC6A X Melkam | MARC6A X Melkam | 2018 MW CAS #28A X 33R |
| 42 | P9511A X Melkam | P9511A X Melkam | 2018 MW CAS 32A X 33R |
Table 1: Description of the genotypes included in the experiment.
Experimental design and trial management
The experiment was conducted using alpha lattice (0,1) design at 2 locations, with 2 replications per locations on the main cropping season of 2019. Each genotype was planted on a plot size of 2 rows of 5 m length and the row and plant spacing were 0.75 m and 0.20 m respectively with a plot area of 7.5 m². The experiment was accommodated 7 plots per block and 6 blocks per replication. After 3 weeks of sowing, the seedlings were thinned to 0.20 m distance between plants. All the recommended management practices with the recommended fertilizer rates of 100 kg ha-1 NPS was applied to the basal at the time of planting whereas 50 kg ha-1 urea was applied in the form of split application, half of which was applied together with NPS during planting and the remaining top dressed before heading at knee stage. Weeds were controlled manually and pests were controlled using recommended chemicals.
Data collection
Data were collected from both plot and plant based by random sampling technique with the use of descriptors for Sorghum [35]. The important yield and yield component characters along drought resistant associated characters were collected using standard procedures here under.
Days To Flowering (DTF): Number of days from emergence till 50% of the plants in a plot showed flowering halfway down the panicle.
Days To Maturity (DTM): The number of days from emergence to the date when 95% of the plants matured physiologically.
Plant Height (PH in cm): The length of the plant from the ground to the panicle tip at physiological maturity.
Number of leaves per plant: Total numbers of leaves were taken from 5 plants selected randomly on the main plant in each plot.
Panicle Exertion (PE in cm): The length between the final (the most top) nodes up to the base of the panicle.
Stay green score (1-5): Stay greenness score visually observed at physiological maturity 1=for highly green and 5=for low greenness.
Grain Yield (GY): Grain yield obtained from total harvest of the plot and then converted to ton/ha after adjusting to optimum seed moisture content.
Panicle Yield (PY in g): The weight of individual panicle as measured using one representative samples in a plot.
Panicle Length (PL in cm): The average length of five randomly selected plants from the base of the panicle to the tip.
Panicle Width (PW in cm): The average length of five randomly selected plants at the middle of the panicle.
Total leaf area (LA in cm2): Area of the flag leaf computed as (Leaf length × Leaf width × 0.69) suggested by Krishnamurthy et al.
Thousand Seed Weight (TSW in g): The weight of 1000 grains sampled from a plot at 12.5% moisture content recorded in gram from single plot.
Statistical analysis
Analysis of variances: Analysis Of Variance (ANOVA) for alpha lattice design was performed using statistical software version 9.4 (SAS, 2018 version 9.4 T1M3) for both the specific and combined analysis over location [36]. Prior to combining the data from the different environments, Bartlett’s test for homogeneity of variance was done and checked by using F-test (ratio of the largest mean square error to the smallest mean square error is less than 3 or 4) according to Gomez and Gomez, et al., and the test indicated that the error means were homogeneous for all traits and the data were combined for further analyses [37]. Mean comparisons among genotypes were done by the Least Significant Difference (LSD) test at 1% and 5% levels of significance. The model for alpha lattice design for combined:
yijk=μ+lij+rlj+brlj+gj+gElj+εijk
Where,
Yijk=Denotes the value of the observed trait for ith treatment received in the kth block within jth replicate.
μ=Over all mean.
gi=Effect of the ith genotype (i=1, 2,…,t).
rj=Effect of the jth replicate (j=1,2,…,r).
bjk=Effect of the kth incomplete block within the jth replicate (k=1,2,…s).
εijk=An experimental error associated with the observation of the ith treatment in the kth incomplete block within the jth complete replicate.
Computation of genetic parameters: The phenotypic and genotypic variation was computed using the following formula as suggested by Singh and Choudhary [38].
Genotypic variance (δ²g)
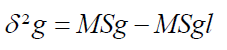
For over two locations
Where;
MSg=Mean Square of genotype
MSgl=Mean Square due to genotype by environment interaction
l=Number of locations
r=Number of replications.
Genotype by environment interaction variance (δ²gl)
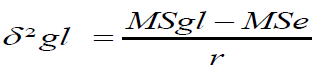
Where,
MSgl=Mean Square due to genotype x environment Interaction
MSe=Combined error Mean Square =(δ²e).
Phenotypic variance (δ²p)
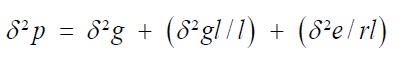
Where,
δ²g=Genotypic variance.
δ²gl=Genotypic by environmental variance.
δ²e=Environmental variance.
l=number of locations.
r=number of replications.
The Genotypic and Phenotypic Coefficients of Variation (GCV and PCV) were computed according to the method advocated by Burton and Devane. If it is ≤ 10%=low, 10%-20%=moderate, ≥ 20%=high.
Genotypic Coefficient of Variability (GCV)
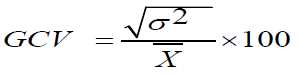
GCV=Genotypic Coefficient of Variation.
δ²g=Genotypic variance.
X͞ =Population mean for the trait.
Phenotypic Coefficient of Variability (PCV)
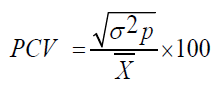
Where,
PCV=Phenotypic Coefficient of Variation
σ²p =Phenotypic variation
X͞ = Population mean for the trait.
Environmental Coefficients of Variations (ECV)
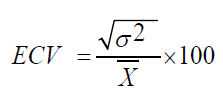
Where,
δ2e=Environmental variance.
Genotype by Environment interaction Coefficients of Variation (GECV)
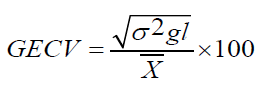
Where,
δ2gl=Genotypic x environment variance.
X͞ =population mean for the trait considered
Broad sense heritability (H²)
Broad sense heritability was computed for each characters based on the formula developed by Allard.
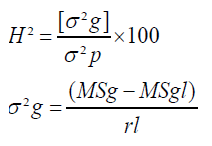
Where,
H²=broad-sense heritability,
σ²g=Genotypic variance,
σ²p=Phenotypic
MSg=Mean Squares due to genotypes,
MSgl=Mean Squares due to genotypes x locations Interaction variance,
σ²e=environmental variance,
l=Number of Locations
r=Number of Replications.
Heritability percentage was categorized as low, medium and high as suggested by Robinson (1956) as follows:< 50%=low heritability, 50%-70%=moderate heritability, >70%=high.
Estimation of genetic advance
Genetic advance for each trait was calculated by using the formula Allard (1960).
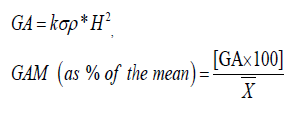
Where,
k=Selection differential (k=2.06 at 5% selection intensity).
σρ=Phenotypic standard deviation.
H2=Heritability (broad sense).
X͞ =Grand mean.
Genetic advance as percent of mean was classified as low, moderate and high as follows: 0%-10%=low 10%-20%=moderate 20% and above=high.
Results and Discussion
Analysis of variance for yield and yield related traits
Analyses of variance due to different source of variations were computed as per standard the procedure of alphalattice design for combined over the two locations. The analyses of variances revealed significantly high differences (P<0.01) among the genotypes for all of quantitative characters (Table 2). The presence of significant difference among Sorghum genotypes for the studied traits ensured the presence of large genetic variation to be improved through simple selection. This indicated the presence of considerable variation in the genetic materials for these traits and improvement of the genotypes with these traits is possible with simple selection. Plant breeding is primarily depending on presence of substantial genetic variation to address the maximum genetic yield potential of the crops and exploitation of this variation through effective selection for further improvement. Hence, the obtained results encourage the availabilities of substantial genetic variation among Sorghum genotypes for the studied traits.
Mean performance of Sorghum genotypes for yield and yield related traits
| Traits | MSL (DF=1) | MSG (DF=41) | MSGL (=41) | MSE (DF=72) | CV | R2 |
|---|---|---|---|---|---|---|
| Days to flowering | 1080.21** | 13.23** | 5.51** | 2.62 | 2.29 | 0.91 |
| Days to maturity | 1494.05** | 15.10** | 13.74** | 4.67 | 1.95 | 0.89 |
| Plant height | 14359.70** | 7615.51** | 332.80** | 70.47 | 4.43 | 0.98 |
| Stay green | 63.14** | 0.78** | 0.51ns | 0.35 | 22.15 | 0.83 |
| Panicle length | 117.66** | 27.08** | 3.80ns | 2.99 | 6.13 | 0.87 |
| Panicle width | 308.34** | 3.86** | 1.10* | 0.65 | 9.85 | 0.92 |
| Leaf area | 439598.44** | 5662.39** | 3919.83 | 2812.38 | 16.84 | 0.81 |
| Panicle exersion | 388.87** | 31.36** | 7.47ns | 5.31 | 28.33 | 0.85 |
| Panicle yield | 183467.16** | 2206.42** | 762.70** | 352.03 | 22.12 | 0.92 |
| Grain yield | 858491.96** | 5106.56** | 1708.55** | 869.54 | 21.75 | 0.94 |
| Hundred seed weight | 7100.60** | 60.41** | 13.25** | 6.02 | 9.37 | 0.96 |
NOTE: **, * and ns indicate highly significance (P<0.01), significant (P<0.05) and not significance, respectively; MSl=Mean Square of Location, MSG=Mean Square of Genotype, MSgl=Mean Square of Genotype by location, MSe=Mean Square of Error, DF=Degree Freedom, CV=Coefficient of Variation and R2=R square
Table 2: Combined analysis of variance of Sorghum genotypes for yield and yield related traits over locations at Mieso and Kobo in 2018/2019.
Based on the mean performance, the superior Sorghum genotypes were identified for different traits as indicated in Table 3. Interestingly, genotypes listed as number 17 (6.32 tha-1), 8 (5.92 tha-1), 1 (5.88 tha-1), 26 (5.78 tha-1) and 6 (5.57 tha-1) were high yielder whereas genotypes listed as number 34 (2.05 tha-1), 31 (2.13 tha-1), 32 (2.25 tha-1), 28 (2.34 tha-1), 33 (2.36 tha-1) were low yielder as compared to the other genotypes. Generally, among the tested genotypes, twenty four genotypes gave higher than the average yield of the genotypes (4.29 tha-1). The values of average yield performance of the genotypes ranged from 2.05 tha-1 to 6.32 tha-1. In addition to yield performance, considering growth and morphological parameters contributing for the yield performance as a selection criterion in the development of drought tolerance genotypes were suggested [39,40]. Days to flowering and maturity are among the most important attributes that need to be considered in selecting genotypes for drought affected areas.
| Range | |||||||
|---|---|---|---|---|---|---|---|
| Traits | Mean | Minimum | Maximum | σ2g | σ2p | σ2e | σ2gl |
| Days to flowering | 70.69 | 67.75 | 77 | 1.93 | 3.31 | 2.62 | 1.45 |
| Days to maturity | 110.58 | 107.75 | 114.5 | 0.34 | 3.78 | 4.67 | 4.54 |
| Plant height | 189.38 | 107.5 | 271 | 1820.67 | 1903.88 | 70.47 | 131.17 |
| Stay green | 2.68 | 1.25 | 3.5 | 0.07 | 0.2 | 0.35 | 0.08 |
| Panicle length | 28.2 | 22.5 | 33.45 | 5.82 | 6.77 | 2.99 | 0.41 |
| Panicle width | 8.23 | 6.05 | 10.1 | 0.69 | 0.96 | 0.65 | 0.23 |
| Leaf area | 314.92 | 220.36 | 405.68 | 435.64 | 1415.6 | 2812.38 | 553.73 |
| Panicle exersion | 8.13 | 0.5 | 14.4 | 5.6 | 7.48 | 5.31 | 1.08 |
| Panicle yield | 84.81 | 39.45 | 126.3 | 360.93 | 551.61 | 352.03 | 205.34 |
| Grain yield | 4.29 | 2.05 | 6.32 | 849.5 | 1276.64 | 869.54 | 419.51 |
| Hundred seed weight | 26.18 | 17.53 | 34.33 | 11.79 | 15.12 | 6.02 | 3.62 |
Note: (δ2p)=Phenotypic variance, (δ2g)=Genotypic variance, (δ2e)=Environmental variance, (δ2gl)=Genotype by environmental variance
Table 3: Combined analysis of variance of Sorghum genotypes for yield and yield related traits over locations at Mieso and Kobo in 2018/2019.
In this study, the mean number of days to flowering ranged from 68 days in the early flowered genotype 35 to 77 days in the late flowered genotypes (31). Similarly, mean number for days to maturity ranged from 108 to 114 for the same group of genotypes. Both early and late maturing genotypes had the same grain fill duration. However, variation was detected for grain yield and related yield components among these genotypes, indicating that, the variation in the other attributes might be associated with factors other than duration of grain fill. The top yielder genotypes (17) required 69 days to flower and 108 days to mature which was close to the average for genotypes, 70 days for flowering and 111 days for maturity [41]. This indicates that, the yielding potential is not necessarily associated with crop phenology provided that genes for high yield potential are incorporated in the genotypes. The global successes in improving Sorghum yield by deploying high yielding early maturing hybrids also supports this idea.
Similarly, the actual mean values showed variation among genotypes for plant height and leaf area. Mean plant height ranged from 107.50 cm to 271 cm, and leaf area ranged from (220.36 cm² to 405.63 cm2). Breeding for shorter plant height was one of the major goals of the Sorghum breeding program for dry lowland areas where drought adversely affects the plants which had prolonged vegetative growth and to make commercial genotypes fit to mechanical harvesting. Among the various drought resistance related traits, leaf area is very relevant by narrowing the leaf length and leaf width when the drought becomes severe to limit water loss. Generally, Sorghum genotypes characterized by early flowering and early maturity, small number of leaves per plant, small leaf area, erect leaf type (small leaf angle), larger stem diameter, small number of productive tiller, small leaf area, high grain yield per unit area and short plant height are most suitable for lowland areas with a limited rain fall and short growing season [42].
Estimation of coefficients of variation
The estimated magnitudes of genotypic and phenotypic coefficient of variation for measured characters were presented in Table 4. The amounts of genotypic variations that available in a crop species are essential in initiating a breeding program. The estimated phenotypic coefficient of variation for all studied traits ranged from 1.76 for days to maturity to 33.64 for panicle exertion whereas the genotypic coefficient of variation values ranged from 0.52 for days to maturity to 29.11 for panicle exertion. The high values obtained for both PCV and GCV for plant height, panicle e exertion and panicle yield and the medium values obtained for panicle width and thousand seed weight whereas the low values recorded in days to flowering, days to maturity, panicle length and grain yield. Lower PCV and GCV suggested that the traits are rendering to high environmental influences and hence lower opportunity exists for improvement of these traits through simple selection in the tested genotypes. For those traits like plant height, panicle length, panicle width, panicle exertion, panicle yield and 1000 seed weight in which genotypic variance were higher than error variance, which indicated genetic variance is more important and its possible to improve these traits through selection.
| Traits | GCV | PCV | ECV | GECV | H2 | GA | GAM (%) |
|---|---|---|---|---|---|---|---|
| Days to flowering | 1.97 | 2.57 | 2.29 | 1.71 | 58.31 | 218.54 | 3.09 |
| Days to maturity | 0.52 | 1.76 | 1.95 | 1.93 | 8.99 | 36 | 0.33 |
| Plant height | 22.53 | 23.04 | 4.43 | 6.05 | 95.63 | 8595.7 | 45.39 |
| Stay green | 9.87 | 16.69 | 22.07 | 10.55 | 35 | 32.24 | 12.03 |
| Panicle length | 8.55 | 9.2 | 6.13 | 2.27 | 85.97 | 460.8 | 16.34 |
| Panicle width | 10.1 | 11.9 | 9.8 | 5.83 | 71.88 | 145.08 | 17.63 |
| Leaf area | 6.63 | 11.95 | 16.84 | 7.47 | 30.77 | 2384.87 | 7.57 |
| Panicle exersion | 29.11 | 33.64 | 28.34 | 12.78 | 74.87 | 421.82 | 51.88 |
| Panicle yield | 22.4 | 27.69 | 22.12 | 16.9 | 65.43 | 3165.63 | 37.32 |
| Grain yield | 6.79 | 8.33 | 6.87 | 4.77 | 66.54 | 4897.61 | 11.42 |
| Hundred seed weight | 13.12 | 14.85 | 9.37 | 7.27 | 77.98 | 624.64 | 23.86 |
Note: GCV=Genotypic Coefficients of variation, PCV=Phenotypic Coefficients of Variation, ECV=Environmental Coefficients of Variation, GECV=Genotypic by Environmental Coefficients of Variation, H2=Heritability, GA=Genetic Advance and GAM (%)=Genetic Advance as percent of Mean
Table 4: Estimation of genetic parameters for major morphological traits over location at Mieso and Kobo in 2018/2019.
The medium to high PCV and GCV value indicated that the variation observed among genotypes for these traits were more of due to their genetic difference rather than environmental influences. It directs that simple selection may be effective and their phenotypic expression would be a good indication of genetic potential as different genotypes can provide materials for a sound improvement program. The highest estimate of PCV than the corresponding GCV indicated the relative effects of environment (to some degree) on the expression of the traits. Genotype by Environmental Coefficients of Variation (GECV) ranged from 1.71 for days to 50% flowering to 16.90 of panicle yield. Relatively the highest GECV was recorded for panicle yield per plant (16.90), panicle exertion (12.78) and stay green (10.55). Environmental Coefficients of Variation (ECV) and Genotype by Environmental Coefficients of Variation (GECV) were higher than Genotypic Coefficients of Variation (GCV) for days to maturity, stay green and leaf area. This indicated that the phenotypic expression of these traits to be highly influenced by environmental condition rather than their genetic makeup [43]. Hence, improving these traits of interest would be effective based on stability test that selection for such trait should be environmental specific. However, days to flowering, plant height (cm), panicle length (cm), panicle width (cm), panicle exertion (cm), grain yield per hectare and 1000 seed weight (g) revealed that higher Genotypic Coefficients of Variation (GCV) than Genotypic by Environment Coefficients of Variation (GECV) and Environmental Coefficient of Variation (ECV). However, the high GCV recorded alone is not sufficient for the determination of the extent of genetic advance to be expected by selection.
Estimation of broad sense heritability and genetic advan
The broad sense heritability (H2) values ranged from 8.99% for days to maturity to 95.63% for plant height whereas Genetic Advance as percent of Mean (GAM) values ranged from 0.33% for days to maturity to 51.88% for panicle exersion respectively (Table 5) [44]. The estimation of heritability values were high for plant height (95.63%), panicle length (85.97%), 1000 seed weight (77.98%), panicle exertion (74.87%), panicle width (71.88%), grain yield per hectare (66.54%) and panicle yield per plant (65.43%) whereas days to 50% flowering (58.31%), stay green (35.00%) and leaf area (30.77%) revealed moderate heritability. Such result indicated that the genetic makeup played a major role in the expression of these traits and close correspondence between the genotypic and phenotypic ultimately due to less environmental influence on phenotypic expression of these traits which is good for crop improvement through simple selection [45].
| Lines (code) | Name of parents and hybrids | Lines (code) | Name of parents and hybrids |
|---|---|---|---|
| 1 | TX-623 | 3 x 15 | P-9505XICRA-14 |
| 2 | P-9501 | 4 x 14 | P-9534XMelkam |
| 3 | P-9505 | 4 x 15 | P-9534XICRS-14 |
| 4 | P-9534 | 5 x 14 | P-851015XMelkam |
| 5 | P-851015 | 5 x 15 | P-85101XICRS-14 |
| 6 | P-850341 | 6 x 14 | P-850341XMelkam |
| 7 | B5 | 6 x 15 | P-850341XICRS-14 |
| 8 | B6 | 7 x 14 | B5XMelkam |
| 9 | Mar-01 | 7 x 15 | B5XICRS-14 |
| 10 | Mar-02 | 8 x 14 | B6XMelkam |
| 11 | Mar-03 | 8 x 15 | B6XICRS-14 |
| 12 | Mar-06 | 9 x 14 | MARC1XMelkam |
| 13 | P9511 | 9 x 15 | MARC1XICRS-14 |
| 14 | Melkam | 10 x 14 | MARC2XMelkam |
| 15 | ICRS-14 | 10 x 15 | MARC2XICRS-14 |
| 16 | ESH-4 | 11 x 14 | MARC3XMelkam |
| 1 x 14 | TX-623XMelkam | 11 x 15 | MARC3XICRS-14 |
| 1 x 15 | TX-623XICRS-14 | 12 x 14 | MARC6XMelkam |
| 2 x 14 | P-9501XMelkam | 12 x 15 | MARC6XICRS-14 |
| 2 x 15 | P-9501XICRS-14 | 13 x 14 | P9511XMelkam |
| 3 x 14 | P-9505XMelkam | 13 x 15 | P9511XICRS-14 |
Table 5: List of parents and hybrids with their symbolical representation.
Therefore, the breeders could get chance to select promising genotypes based on the phenotypic expression of these traits. Similar finding was reported by Abraha, et al., on the high heritability recorded for yield and yield related characters [46]. The lowest heritability was observed in days to maturity (8.99%) indicating that this trait would not respond to phenotypic selection. Thus, in the present finding, high value of GA% mean was recorded in panicle exertion (51.88%), plant height (45.39%), panicle yield per plant (37.32%) and 1000 seed weight (23.86%) and moderate amount of GA% mean was recorded in panicle width (17.63%), panicle length (16.34%), stay green (12.03%) and grain yield per hectare (11.42%),whereas the low values of GA% mean was recorded in days to maturity (0.33%), days to flowering (3.09%) and leaf area (7.57%) respectively.
High magnitude of heritability coupled with high genetic advance as percent of mean were obtained for plant height (95.63% and 45.39%), 1000 seed weight (77.98% and 23.86%), panicle exertion (74.87% and 51.88%), panicle yield (65.43% and 37.32%), whereas high heritability coupled with moderate genetic advance as percent of mean for panicle length (85.97% and 16.34%) and grain yield (66.54% and 11.42%) in the same order. Moderate heritability also along moderate genetic advance as percent of mean was observed for stay green trait. These indicated that plant height, 1000 seed weight, panicle exertion and panicle yield are controlled by additive gene action. Similar findings were reported by Sharma, et al. and Ranjith, et al., on high heritability coupled with high to moderate genetic advance as percent of mean for 1000 seed weight and plant height respectively [47]. The moderate magnitude of heritability along with low genetic advance as percent of mean was obtained for days to 50% flowering and leaf area. This manifested the studied traits were controlled by non-additive gene effects and heterosis breeding can be successfully exploited in improving these characters.
Conclusion
Drought is the primary cause of crop yield loss among abiotic factors and it is a major problem in Ethiopia, leading to food shortages. However, Sorghum is relatively a drought tolerant crop but drought is still the major constraint for its production. Therefore, knowledge of genetic variability for drought related traits is the key component in selecting genotype that withstand drought for the future breeding program. The study identified the presence of variation among genotypes with respect to drought related traits. The presence of considerable variation in the genetic materials implied that the possibility to improve the genotypes with simple selection for the studied traits. The highest mean grain yield was obtained from a hybrid 4 × 14 (6.32 tha-1) followed by hybrid 8 × 15 (5.92 tha-1), 1 × 15 (5.88 tha-1), 13 × 14 (5.78 tha-1) and 6 × 15 (5.57 tha-1) respectively.
The estimated phenotypic coefficient of variation for all studied traits ranged from 1.76 for days to maturity to 33.64 for panicle exertion whereas the genotypic coefficient of variation values ranged from 0.52 for days to maturity to 29.11 for panicle exertion whereas the high heritability with high genetic advance as percent of mean obtained for plant height (95.63% and 45.39%), 1000 seed weight (77.98% and 23.86%), panicle exertion (74.87% and 51.88%), panicle yield (65.43% and 37.32%) respectively. This indicated different genetic variability parameters, namely, genotypic coefficient of variability, phenotypic coefficient of variability, heritability and genetic advance for yield attributing traits are a major concern for crop improvement programs. High heritability and high genetic advance for plant height, 1000 seed weight, panicle exertion and panicle yield traits indicate that as they governed by additive gene action and, therefore, provide the most effective condition for selection.
Generally, the present investigation showed the existence of genetic variation among genotypes with respect to the traits considered indicating an opportunity to bring about yield improvements in Sorghum through simple selection. The high magnitude of genotypic coefficient of variation and genetic advance indicated the existence of broad genetic base which facilitate improvement through selection. The magnitude of heritability was high for most of quantitative traits, which implied the high contribution of genotype to the phenotype and then substantial improvement can be made using standard selection procedures. Therefore, there was the possibility of improving Sorghum genotypes through simple selection and heterosis breeding that involves crossing of different genotypes. The most promising and potential genetic materials were identified based on mean yield performance, genotypic coefficient of variation, heritability and genetic advance. Hence traits which had high heritability coupled with high genotypic coefficients of variation in present study can be improved by conventional breeding through selection breeding. In conclusion, the genotypic coefficients of variation along with heritability estimate provide a reliable estimate of the amount of genetic advance to be expected through phenotypic selection. The hybrid crosses 4 × 14, 4 × 15, 8 × 14, 8 × 15, 11 × 14 and 11 × 15 were found to be the most promising and potential genetic materials which could be exploited after critical evaluation for their superiority and yield stability across the locations over years.
References
- FAO (2017) Database of agricultural production. FAO Statistical Databases (FAOSTAT).
- Clayton WD, Renvoize SA (1986) Genera Graminum grasses of the world. Kew Bulletin Additional Series XIII, Kew Publishing, U.S.A. 13:338–345.
- Doggett H (1988) Sorghum. 2nd Edition, Essex, Longman Scientific and Technical, England.
- Central Statistical Agency of Ethiopia (CSA) (2018) Agricultural sample survey 2016/2017. Statistical Bulletin 584, Central Statistical Agency (CSA), Addis Ababa.
- Reddy BVS, Ramesh S, Reddy PS (2004) Sorghum breeding research at ICRISAT goals, strategies, methods and accomplishments. International Sorghum and Millets Newsletter 1:5-12
- Funnell-Harris DL, Sattler SE, Pedersen JF (2013) Characterization of fluorescent Pseudomonas spp. associated with roots and soil of two Sorghum genotypes. Eur J Plant Pathol 136:469-481
- Meehl GA, Hibbard KA, Cox PM, Friedlingstein P (2007) A strategy for climate change stabilization experiments. Eos, Transactions American Geophysical Union, 88:217-221
[Crossref] [Google Scholar] [PubMed]
- Asif M, Ayub M, Tanveer A, Akhtar J (2017) Estimating yield losses and economic threshold level of Parthenium Hysterophorus In Forage Sorghum. Planta daninha 35:e017164158
- Adebo OA, Njobeh PB, Kayitesi E (2018) Fermentation by Lactobacillus fermentum strains (singly and in combination) enhances the properties of ting from two whole grain Sorghum types. J Cereal Sci 82:49-56
- Bawazir AA (2009) Genetic analysis for yield and yield components in grain Sorghum (Sorghum bicolor (L.) Moench). J Agric Sci 5:52-56
- Zhanguo X, Huang J, Smith AR, Chen J, Burke J, (2017) Morphological characterization of a new and easily recognizable nuclear male sterile mutant of Sorghum (Sorghum bicolor). PLoS One 12:165-195
- Dutra ED, Neto AG, de Souza RB, de Morais Junior MA, Tabosa JN, et al. (2013) Ethanol production from the stem juice of different sweet Sorghum cultivars in the state of Pernambuco, Northeast of Brazil. Sugar Tech 15:316-321
- Smith CW and Frederiksen RA (2000) Sorghum: Origin, history, technology, and production. John Wiley and Sons
- Pinho RMA, Santos EM, Oliveira JSD, Bezerra HFC, Freitas PMDD, et al. (2015) Sorghum cultivars of different purposes silage. Cienc Rural 45:298-303
- Ayana A, Bekele E, Bryngelsson T (2000) Genetic variation in wild Sorghum (Sorghum bicolor ssp. verticilliflorum (L.) Moench) germplasm from Ethiopia assessed by random amplified polymorphic DNA. Hereditas 132:249-254
[Crossref] [Google Scholar] [PubMed]
- Sharma JR (2006) Statistical and biometrical techniques in plant breeding. New Age International Publisher, New Delhi.
[Crossref]
- Abrams PA, Fussmann GF, Loreau M (2007) Eco‐evolutionary dynamics of communities and ecosystems. Funct Ecol 21:465-477
[Crossref] [Google Scholar] [PubMed]
- Ayana A (2001) Genetic diversity in Sorghum (Sorghum bicolor (L.) Moench) germplasm from Ethiopia and Eritrea. Addis Ababa University, PhD, Addis Ababa, Ethiopia.
- Warburton ML, Reif JC, Frisch M, Bohn M, Bedoya C, et al. (2008) Genetic diversity in CIMMYT nontemperate maize germplasm: Landraces, open pollinated varieties, and inbred lines. Crop sci 48:617-624
- Allard RW (1960) Principles of plant breeding. John Willey and Sons, New York. 485
- Singh M, Ceccarelli S (1995) Estimation of heritability using variety trials data from incomplete blocks. Theor Appl Genet 90:142-145
[Crossref] [Google Scholar] [PubMed]
- Robinson HF, Hanson CH, Comstock RE (1956) Biometrical studies of yield in segregating populations of Korean lespedeza. J Agron 48:268-272
- Burton GW, Devane DE (1953) Estimating heritability in tall fescue (Festuca arundinacea) from replicated clonal material. J Agron 45:478-548
- Kashif MU, Khaliq IH (2004) Heritability, correlation and path coefficient analysis for some metric traits in wheat. Int J Agric Biol 6:138-142
- Biradar BD, Arunkumar B, Salimath PM (2010) Genetic variability and character association studies in rabi Sorghum. Karnataka J Agri Sci 17:471-475
- Holland JB, Nyquist WE, Cervantes-Martinez CT, Janick J (2003) Estimating and interpreting heritability for plant breeding: An update. Plant Breed Rev 2003;22.
- Bernardo R (2014) What if we knew all the genes for a quantitative trait in hybrid crops. Crop Sci 41:1-4
- Adugna A (2007) Assessment of yield stability In Sorghum. Afr Crop Sci J 15:83-92
- Wortmann CS, Mamo M, Abebe G, Mburu C, Kayuki KC, et al. (2006) The Atlas of Sorghum production in five countries of Eastern Africa. International Annual Meetings, Lousainia, USA. 15
- Central Statistics Agency (CSA) (2012) Report on area and crop production forecast for major crops. Statistical Bulletin. Addis Ababa, Ethiopia, 505:12-17
- Ethiopian Institute of Agricultural Research (EIAR) (2014). Ethiopian strategy for Sorghum. Country strategy document.
- Trethowan R, Pena RJ, Pfeiffer WH, Ginkel MV (2002) Quality (end use) improvement in wheat: Compositional, genetic and environmental factors. J Crop Prod 5:1-37
- Farshadfar E, Elyasi P, Hasheminasab H (2013) Incorporation of agronomic and physiological indicators of drought tolerance in a single integrated selection index for screening drought tolerant landraces of bread wheat genotypes. Int J Agron Plant Prod. 4:3314-3325
- Lemma W (2008) Physicochemical studies of soils of Miesso areas, Eastern Hararghe, Oromia region. School of Graduate Studies of Haramaya University, MSc, Haramaya.
- IBPGR and ICRISAT (1993). Descriptors for Sorghum (Sorghum bicolor (L.) Moench). International board for plant genetic resources, Rome, Italy; International Crops Research Institute for the Semi-Arid Tropics, Patancheru, India.
- SAS Institute Inc (2018) SAS/STAT users guide. 4th Edition, Cat, NC.
- Gomez KA, Gomez AA (1984) Statistical procedures for agricultural research. 2nd Edition, John Wiley and Sons, New York, 680.
- Singh RK, Chaudary BD (1979) Hometrical methods in quantitative genetic analysis. Kalyani Publ., Iudhiana, India.
- Rosenow DT, Quisenberry JE, Wendt CW, Wendt CW, Clark LE (1983) Drought tolerant Sorghum and cotton germplasm. Agric Water Manage 7:207-222
- Henzell RG, BengmanRL, Hetcher DS, Cosker MC (1992) Relationship between yield and non-senescence (stay-green) in some grain Sorghum hybrids grown under terminal drought stress. Australian Inst Agri Sci 355-358
- Abraha T, Githiri SM, Kasili R, Araia W, Nyende AB (2015) Genetic variation among Sorghum (Sorghum bicolor L. Moench) landraces from Eritrea under post-flowering drought stress conditions. Am J Plant Sci 6:1410-1424
- Allard RW (1999) Principles of plant breeding. John Wiley and Sons, New York.
- Gw B (1952) Quantitative inheritance in grasses. Pro VI Int Grassl Cong 1952:277-283
- Johnson HW, Robinson HF, Comstock RE (1955) Estimates of genetic and environmental variability in soybean. J Agron 47:314-318
- Krishnamurthy GT, Tubis M, Endow JS, Singhi V, Walsh CF, et al. (1974) Clinical comparison of the kinetics of 99 mTc-labeled polyphosphate and diphosphonate. J Nucl Med 15:848-855
[Google Scholar] [PubMed]
- Robinson HF, Comstock RE, Harvey PH (1949) Estimates of heritability and the degree of dominance in corn. J Agron 41:353-359
- Ranjith P, Ghorade RB, Kalpande VV, Dange AM (2017) Genetic variability, heritability and genetic advance for grain yield and yield components In Sorghum. Int J Farm Sci 7:90-93

Open Access Journals
- Aquaculture & Veterinary Science
- Chemistry & Chemical Sciences
- Clinical Sciences
- Engineering
- General Science
- Genetics & Molecular Biology
- Health Care & Nursing
- Immunology & Microbiology
- Materials Science
- Mathematics & Physics
- Medical Sciences
- Neurology & Psychiatry
- Oncology & Cancer Science
- Pharmaceutical Sciences