ISSN : 2249 - 7412
Asian Journal of Plant Science & Research
Factors Influencing Canopy Rainfall Interception in Trees Grown on a Landfill
Kartik Venkatraman*
Acacia Waste Management Solutions Pty Ltd, Bairnsdale, Australia
Abstract
Canopy rainfall interception plays an important role in determining the amount of rainfall reaching the ground surface. This characteristic feature in plants significantly contributes to the hydrological balance of a site, especially in a phytocapped landfill site, where the primary aim is to restrict the percolation of rain water into the refuse. Results from canopy interception studies on 19 tree species grown on a phytocap suggest the ability of these trees to intercept up to 50 % of the total rainfall received with an average interception of 30% as compared to 18% to 30% for a forest. Stemflow contributed up to 4.5 % of the total rain received as compared to 2% to 5% for a forest. There are several environmental, climatic and tree morphological parameters that have high influence on rainfall interception. This difference in tree morphology among tree species brings in the variation in the interception potential between tree species and also between trees of the same species.
Keywords
Bark texture; Branch angle; Canopy rainfall interception; Crown spread; DBH; Height; Landfill; Phytocap stemflow; Throughfall
Introduction
Canopy rainfall interception has been widely studied in Australia and overseas. A number of stand-scale interception studies have been completed on tropical forests, temperate broadleaf forests and temperate conifer forests [1-3]. This is the first Australian study to quantify canopy rainfall interception in trees grown on a landfill. However, this study was primarily focused on individual tree scale with a slight extension to the stand level.
Canopy rainfall interception varies between species and geographical location. For example, Crockford and Richardson, reported canopy rainfall interception of 18.3% in Pinus radiata in south east Australia [4]. Valente et al. found 17.1% and 10.8% in Pinus sp. and E. globulus plantations in Portugal (annual rainfall 800 mm) [2]. Singh, studied rainfall interception in a Pinus wallichiana plantation in India and found that 21% of the rain evaporated from the canopy, with stemflow contributing up to 2.7% at a site having an average rainfall of 859 mm [5]. Opakunle, found interception to be 24% and stemflow to be 1.8% in a cacao plantation in Nigeria that received an annual rainfall of 1169 mm [6]. Manokaran, studied the lowland tropical forest in Malaysia in a rainfall zone of 1757 mm and found interception ranging from 0.15% to 100% on a per storm basis [7]. Giacomin and Trucchi, measured an interception of 17% in a study of interception in a beech forest in Italy (annual rainfall 2027 mm) [8]. The Forest Science Department in British Columbia also conducted a study of rainfall interception on yellow cedar, red cedar, shore pine and Sitka spruce plantations in Smith Island (1862 mm) and Diana Lake (1943 mm), and found the interception to be 25% and 21%, respectively. A similar study by Spittlehouse, reported an interception of 30% by a mature coastal hemlock forest on Vancouver Island [9]. Another study by Llorens et al. on Pinus sylvestris showed an interception loss of 24%. On an annual basis, the interception loss from pine plantations can be 20% to 30% of the annual rainfall, while for eucalypts the loss is evaluated at 10% to 20% [10,11]. Crockford and Richardson, suggested that stemflow and throughfall are directly affected by tree morphology, branch angle, bark texture, and rain angle and rain intensity [12]. Tree morphology and its distribution in the field can control the fate of rain water. Canopy spread is a significant factor in determining variability in canopy rainfall interception [13]. Essentially, trees with large canopy spread have the ability to capture maximum rainfall.
Materials and Methods
Site Establishment
An experimental site of 5000 m2 area at the Lakes Creek Road Landfill, Rockhampton, Australia was selected for this study. The experimental site had two soil depths treatments (Thick soil cover, 1400 mm and thin soil cover, 700 mm) (Figures 1 and 2). These treatments were replicated twice (total four plots). In the Thin soil cover, only 300 mm of sandy loam soil and 100 mm of green waste mulch was placed over the pre-existing 400 mm un-compacted clay soil (total soil cover of 700 mm). In the Thick soil cover, four layers of soil were placed over the pre-existing 400 mm clay soil. This consisted of 200 mm of sandy loam, 300 mm of Yaamba clay and 300 mm of Andersite clay, 200 mm of sandy loam soil and 100 mm of green waste mulch (soil cover of 1400 mm). Both Thick and Thin soil cover treatments were mulched with a layer of shredded green waste (100 mm). Eighteen seedlings of 21 species were planted at 2 m x 1 m spacing in each plot. Two tree species out of the 21 grown did not survive.

Figure 1: Thick and Thin soil covers.

Figure 2: Tree species planted at 2 m x 1 m spacing.
Throughfall
Throughfall was determined using a standard rain gauge (4 cm wide and 51 cm high) (Figure 3) [14].

Figure 3: Standard rain gauge used in measuring throughfall.
Four randomly selected plants of a species in Thick and Thin phytocaps were monitored by placing the rain gauges under the canopy of each tree at 30 cm, 40 cm and 50 cm from the main stem. Careful consideration was taken to avoid any canopy overlaps. Trees from one replication of each Thick and Thin soil cover were monitored and a total of 456 rain gauges were used within an area of 2500 m2. An additional 20 rain gauges were placed around the experimental plot in an open area to record total rainfall received at the site. The rain gauge readings were recorded for almost all rainfall events during a 24 month period (50 rainfall events). The canopy rainfall interception was calculated as follows Eq (1)
 (1)
(1)
Stemflow Measurement
To measure stemflow, a split plastic hose was stapled around the tree using galvanised staple pins with one of its ends tapering downwards to discharge water into a graduated jar (Figure 4) [14]. The gaps between the hose and the bark were sealed with neutral silicon sealant and the sealant was left to dry for 24 h before measurement. Once dried completely, the tapering end was inserted into the jar through the lid. The measuring jar was closed and anchored to the stem to restrict movement and to prevent evaporation. During rain events, the water flowing through the stem entered the cup shaped split hose and ran through the tapering end into the jar. Three such stemflow gauges were installed per species in each of the Thick and Thin capping systems, and measurements were taken over several rainfall events that spanned over a year. Stemflow was calculated as follows Eq (2) (Table 1).

Figure 4: Stem flow collar.
| Species | Leaf type/size | Canopy rainfall interception (%) |
|---|---|---|
| Acacia harpophylla | Medium | 20.10 |
| Acacia mangium | Broad | 52.50 |
| Callistemon viminalis | Narrow | 27.82 |
| Casuarina cunninghamiana | Needle | 37.68 |
| Casuarina glauca | Needle | 24.22 |
| Cupaniopsis anacardioides | Medium | 24.87 |
| Dendrocalamus latiflorus | Broad | 30.60 |
| Eucalyptus grandis | Medium | 260 |
| Eucalyptus raveretiana | Medium | 24.62 |
| Eucalyptus tereticornis | Medium | 20.78 |
| Ficus microcarpa var. hillii | Medium | 32.14 |
| Ficus racemosa | Medium | 24.56 |
| Glochidion lobocarpum | Medium | 33.68 |
| Hibiscus tiliaceus | Broad | 36.54 |
| Lophostemon confertus | Narrow | 23.78 |
| Melaleuca leucadendra | Medium | 21.74 |
| Melaleuca linariifolia | Narrow | 29.36 |
| Pongamia pinnata | Medium | 21.82 |
| Syzigium australis | Narrow | 31.24 |
Table 1: Rainfall intercepted by 19 tree species with different leaf size and shape.
 (2)
(2)
In most species that were studied for canopy interception, the canopy was not fully closed at one year or at one and half years after establishment. Canopy area was recorded each year for each species and the stemflow was calculated based on canopy area. Stemflow collars were installed 9 months after the beginning of the collection of rainfall interception data. Thus the stem flow values for the early part were estimated based on the values obtained from the later measurements (based on the rainfall received per event and its intensity) so that both stem flow and interception data were derived for the entire measurement period. Stemflow values for the period January 2005 to September 2005 therefore include extrapolated values according to rainfall intensity and duration.
Leaf area and specific leaf area: Five leaves were collected from each species (from top, middle and bottom part of the canopy) in both Thick and Thin phytocaps and from both replications soon after sunrise or just before the sunset. The leaves were then gently wiped with a paper towel and scanned using a scanner and the scanned image was analysed using Delta-T leaf area meter. The same leaves were dried at 70ºC for 3 days and the dry weight was determined. Specific leaf area was calculated as follows Eq (3)
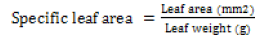 (3)
(3)
Leaf adsorption: Ten leaves were sampled from each species from Thick and Thin phytocaps and from both replications (40 leaves/species). Their fresh weights were determined and then the leaves were dipped in rainwater for about 10 sec. The leaves were removed and the droplet collected at the tip of the leaves was removed using a filter paper prior to determining the wet weight of the sample [15]. The difference in weight of the leaf before and after dipping in water provided the adsorption capacity of the leaf.
Leaf thickness: Leaf thickness was measured using a micrometer. A minimum of five readings were taken for each species in each of Thick and Thin phytocaps and from both replications. The measurements were taken from the centre of the leaves. Major veins and midribs were avoided on all the leaves.
Leaf number: Leaf number was determined using the formula Eq (4)
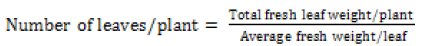 (4)
(4)
The average fresh weight was determined from five randomly selected leaves/species in each of thick and thin phytocaps from both replications. At harvest total fresh weight was determined for 3 plants per species from thick and thin phytocaps and then the average fresh weight of each leaf was calculated.
Leaf toughness: Leaf toughness was measured using a leaf fracture toughness tester, built to the same specifications as the machine (Figure 5). In short, this machine measured the force required to push a razor blade (held at a constant angle) through the leaf lamina, at the widest point of the leaf. It measured the force required to cut a leaf at constant cutting angle and speed. A penetrometer was used to estimate leaf toughness. In this study three leaves per species from each of Thick and Thin phytocaps and from both replications were used to determine leaf toughness.

Figure 5: Leaf toughness tester.
Leaf hairiness: The procedure followed was similar to that adopted. Three leaves of each species from both Thick and Thin phytocaps and from both replications were collected, rinsed with distilled water to remove organic debris and dust, and blotted dried with a paper towel. Once dried, the samples were treated with liquid nitrogen and observed under a scanning electron microscope (JSM 6360LA) for hair density (Figure 6). Leaf hair density from an average of three leaf samples was recorded for each species. Images of the samples were scanned and the total number of hairs counted. Hair density was calculated based on the scale given for each image.

Figure 6: Scanning electron microscope.
Canopy storage capacity: A total of 12 randomly selected leaves per species from Thick and Thin phytocaps and from both replications were used to determine canopy storage capacity. The leaf samples were brought to the laboratory in an insulated storage container. The leaves were gently wiped with a paper towel to remove dust and the initial weight of the leaves was recorded. The leaves were then sprayed and saturated with distilled water until water started dripping from leaves. Once saturated, leaves were weighed (Final weight). The difference in the weight between the initial and the final weight gave the adsorption capacity of leaves. Canopy storage capacity was calculated by extrapolating leaf adsorption potential (artificial wetting) of each species by Canopy area Eq (5) [15].
 (5)
(5)
Statistical Analysis
Data was analysed (ANOVA) using Genstat ver. 8.0. Least significance differences (l.s.d.) are presented in figures where the F values of the treatment, capping, species or their interactions were significant (P<0.05). Regression analysis was carried out to determine interrelationships between tree traits and interception data using Graph Pad Prism v 4.03. A polynomial equation was chosen for all graphs as this produced the highest r2.
Results and Discussion
Effect of Species on Canopy Rainfall Interception
The species used in this study showed a significant (P<0.001) difference in rainfall interception between species which can be attributed to the differences in leaf characteristics. Few species had needle shaped leaves (e.g. Casuarina spp.), a few had broad leaves (e.g. Hibiscus tiliaceus) and most species had medium sized leaves.
The list of species examined and their leaf type and their rainfall intercepting capabilities are given in Table 1.
Trees grown on the phytocaps were of varied nature, shape and size. A few were fast growing such as A. mangium, Eucalyptus sp., H. tiliaceus and Casuarina spp., while some were moderately fast-growing such as F. racemosa and P. pinnata and the others were slow growing, such as A. harpophylla and C. viminalis. Yet, a few slow and moderately growing species such as A. harpophylla and S. australis intercepted rain better than some fast growing species like eucalypts, C. glauca and D. latiflorus.
Factors Influencing Canopy Rainfall Interception
Apart from size, tree species also differed in leaf morphology, leaf texture, leaf shape, leaf angle, canopy spread, branch orientation and branch angle. Crockford and Richardson, also noted similar variations between plant species in their study [14]. Canopy spread, leaf morphology, leaf area and other tree traits influenced rainfall interception at various levels (Table 2). The polynomial equation was used to test the relationship (P<0.05) between canopy rainfall interception and various tree characteristics as it gave the highest r2 values. Statistical analysis of various tree parameters revealed that canopy rainfall interception was primarily influenced by LAI and the number of leaves in both Thick and Thin phytocaps (Table 2). Similarly, higher interrelationship was noticed between canopy rainfall interception and leaf thickness.
| Parameter | Thick phytocap | Thin phytocap | Combined |
|---|---|---|---|
| LAI | 0.16*** | 0.19*** | 0.16*** |
| Canopy area | 0.13** | 0.03** | 0.06** |
| Leaf number | 0.17** | 0.15*** | 0.15*** |
| Leaf thickness | 0.42*** | 0.23** | 0.26** |
| Leaf adsorption | 0.04** | 0.04** | 0.14*** |
| Leaf toughness | 0.17** | 0.13** | 0.14** |
| Leaf area | 0.23*** | 0.23** | 0.1** |
| Canopy storage | 0.12** | 0.05** | 0.12** |
| Means of all parameters | 0.75* | 0.7* | 0.65* |
Note: **denotes significance at 0.01 probability and ***= 0.001 probability
Table 2: Relationship between canopy rainfall interception and various tree components (r2 values).
Overall, from Table 2, factors such as LAI, canopy spread, leaf number, leaf thickness, leaf adsorption, leaf toughness, leaf area and canopy storage had an influence on canopy rainfall interception. Leaf adsorption, leaf toughness and leaf thickness showed a significant correlation (Table 2). LAI has shown a positive correlation with canopy rainfall interception. However, during heavy winds and high storm events rainfall interception was reduced, which may be associated with canopy saturation. Canopy spread, leaf adsorption and leaf number increase the surface area to allow more water to be held during rainfall events thereby increasing the water holding capacity of the canopy. Leaf toughness plays a vital role in increasing interception during heavy rainfall events. This characteristic in leaves allows the leaf to hold more moisture in heavy rainfall events without leaning. There is a positive correlation between canopy rainfall interception and leaf traits.
Specific leaf area also varied significantly (P<0.001) between species (Figure 7). This was due to genetic differences between species in leaf morphology, size and shape. Leaf toughness (force of fracture) showed a marked variation (P<0.001) between species and between phytocaps (P=0.002) (Figure 8). This was due to higher leaf thickness, dry matter content and specific leaf area of the trees grown in the Thick phytocap than in those grown in the Thin phytocap. Leaf thickness totally depends on nutrients and moisture content and the availability of photosynthetically active radiation. Leaves of species grown on the thick phytocap were thicker than those grown in the thin phytocap and this is likely to be associated with availability of more water and nutrients as the trees in Thick cap had deeper roots and had access to black clay which would have had better nutrients than the sandy loam soil (Figure 9). Physically stronger leaves can survive better in hail and wind, and they intercept better during high intensity rainfall events. They also have greater lifespan. Stronger leaves give a lower splash effect, and subsequently intercept more rainfall.

Figure 7: Specific leaf area of 19 species grown on Thick and Thin phytocaps.

Figure 8: Leaf toughness measured in 18 species grown on Thick and Thin phytocaps.
*Leaves too small to determine leaf toughness.

Figure 9: Leaf thickness in 19 species grown on Thick and Thin phytocaps.
Canopy rainfall interception is also influenced by canopy storage which in turn is governed by leaf adsorption capacity [14]. However in this study, canopy storage did not include the branches. Besides the wetting time allowed during this experiment is much smaller than the mean rainfall duration at the study site. Leaf adsorption capacity varied between species and phytocaps (P<0.001) (Figure 10). Leaf adsorption capacity is the water retaining strength of individual leaves, which depends on various leaf morphological parameters like leaf hairiness, cuticle thickness, wax deposition, leaf angle and leaf area, and other environmental factors such as temperature, leaf contact angle and drop size distribution [16].

Figure 10: Leaf adsorption capacity of 19 species grown on Thick and Thin phytocaps.
Leaf hair density differs between species and within species due to their genetic makeup [17]. It is interesting to note that smaller leaves in M. linariifolia, G. lobocarpum, F. microcarpa and S. australis had higher water retention capacities than the broad-leaved species such as H. tiliaceus, D. latiflorus, A. mangium and the Eucalyptus species (Figure 10). Overall, trees grown on the Thick phytocap had better adsorption capacity than the ones grown on Thin phytocap and were primarily due to differences in leaf size and abundance of leaf trichomes on the upper leaf surface. This indicates that leaf area, although significant, may not contribute towards water retention. Variations in water retention capacities of different trees could also be due to leaf surface, droplet size distribution and leaf contact angle.
Interestingly, species with higher leaf hair density (e.g. H. tiliaceus and D. latiflorus) retained low water levels compared to species with lower leaf hair density (Figures 11 and 12). C. cunninghamiana (needle shaped leaf) with low hair density had higher water retention capacity than high leaf hair density H. tiliaceus and D. latiflorus and this could be due to lower leaf contact angles (less than 90ºC) that covered a larger area of the leaf surface (Figures 13 and 14). However, water retention capacity was improved by number of leaves and the canopy spread. Dendrocalamus latiflorus and H. tiliaceus had better canopy storage capacity because of the presence of larger number of leaves than in other trees grown on the phytocap (Figure 15). Results showed that the leaf size had influence on canopy interception, as the cladodes (modified branches that look like leaves) of C. cunninghamiana intercepted large proportion of the rain. In comparison, E. tereticornis, which has broader leaves, had low canopy interception (Figure 15). There are two primary reasons for this to happen, one being the canopy storage capacity and the second being stem drip that was not taken into account during this study. In this instance, C. cunninghamiana (0.45 mm per tree)had greater storage capacity than E. tereticornis (0.28 mm per tree) and many other species (Figure 15). These values refer to the static storage capacity that is retained in the canopy and this does not drain to the ground. A study conducted in the US on canopy interception reported a canopy storage capacity that ranged from 0.25 to 9.4 mm per canopy [18].

Figure 11: Leaf trichomes in H. tiliaceus and D. latiflorus.
A) Abaxial surface of H. tiliaceus, B) Adaxial surface of H. tiliaceus, C) Abaxial surface of D. latiflorus, D) Adaxial surface of D. latiflorus (scale 1mm).

Figure 12: Leaf trichomes in M. linariifolia and F. microcarpa.
A) Adaxial surface of Melaleuca linariifolia, B) Abaxial surface of Melaleuca linariifolia, C) Adaxial surface of Ficus microcarpa, D) Abaxial
surface of Ficus microcarpa (scale 1mm).

Figure 13: Hair density in C. cunninghamiana (scale 1 mm).

Figure 14: Side views of 10 μl droplets of water on the adaxial leaf surface (Contact angle increasing from A-D).

Figure 15: Canopy storage capacity and canopy area of 19 species grown on Thick and Thin phytocaps.
Variation in canopy interception amongst tested species could also be associated with the variation in rain angle and intensity which are likely to result in significant amount of water reaching the ground via throughfall and stemflow. The overflow patterns from leaves depend on rain events that exceed storage capacity of the species. On an average, 15 mm to 25 mm rainfall was received in Rockhampton per rainfall event, but the intensity varied from 2 mm h-1 to 490 mm h-1. Another reason for the presence of large variations between species in canopy interception is wind speed, which shakes leaves and lowers the effective storage capacity in the canopy. Canopy interception is also affected by tree spacing. Closely planted trees intercept less water than those spaced widely. As per previous studies it was proved that a Sitka spruce tree with 2 m spacing intercepted less water than those planted at 8 m, due to variations in the branch angle, canopy morphology, tree size, rainfall intensity and rainfall duration. However, spacing was kept constant in the current study, so this would have not influenced the results, although the size of the tree would have.
Rainfall interception was strongly influenced by the amount of rain received, rainfall intensity and rainfall duration (Table 3). Most trees intercepted higher amounts during moderate rainfall periods than during light intensity rainfall events (Figure 16). Most rainfall events in Rockhampton ranged between 15 mm to 25 mm during the study period (2005 to 2006) with many events having less than 10 mm and very few exceeding 30 mm. Rainfall intensity also had some influence on canopy rainfall interception (Figure 17). In Figure 17, a few values of zero explain the relevance of the graph suggesting that interception occurred even for very low rainfall and that the interception increased during low rainfall events. Rainfall duration also had some effect on canopy rainfall interception (Figure 18). Rainfall and duration had a combined effect on canopy rainfall interception. Low intensity rainfall events of longer duration increased canopy interception, but low intensity rainfall events of shorter duration had lower rainfall interception. This interception is governed by the canopy storage capacity and evaporation.
| Interception | |
|---|---|
| Rainfall | 0.54*** |
| Rain duration | 0.38*** |
| Rain Intensity | 0.55*** |
Note: *** denotes significance at 0.001 probability
Table 3: Interrelationships between rainfall, rain duration and rainfall intensity on canopy rainfall interception (r2 values).

Figure 16: Rainfall intercepted by 19 species during high rainfall (>20 mm), moderate rainfall (11-20 mm) and low rainfall (0.6-10 mm) (2005- 2007) events.

Figure 17: Rainfall intercepted by 19 species during low, medium and high intensity rainfall events in 2006.

Figure 18: Rainfall intercepted by 19 species during rainfall events with varied durations (2006).
Effect of Capping Thickness on Canopy Rainfall Interception
Canopy rainfall interception also showed significant (P<0.001) variation between thick and thin phytocaps (Figure 19). Species in the Thick phytocap generally intercepted more rain than the same species that were in Thin phytocap and this may be due to better growth in the thick phytocap than in the Thin phytocap (Figure 20). Better growth in Thick phytocap was possibly due to greater availability of resources such as nutrients, better root development. Root development was more extensive in the Thick phytocap than in the Thin phytocap. A few species such as E. grandis, E. raveretiana, E. tereticornis, A. mangium and C. cunninghamiana grew more rapidly in the Thick phytocap than in the Thin, as they had better root growth in Thick cap. Deeper rooting systems meant better access to larger quantity of nutrients and water.

Figure 19: Rainfall interception in Thick and Thin phytocaps (n=50 rainfall events) (Bars represent l.s.d 1.164).

Figure 20: Rainfall interception by 19 species grown on Thick and Thin phytocaps (n=50 rainfall events).
Conclusions
The 3 year-old trees that were established on Thick and Thin phytocaps were able to intercept up to 50% of the rainfall on a per storm basis, with an overall average of 30%. This is a significant contribution towards hydrological balance of the phytocapping system. The present study also demonstrated that canopy rainfall interception, including stem flow, varied significantly between species due to various factors such as their growth habit, leaf characteristics, canopy characteristics, bark texture, tree position and rainfall patterns. Canopy rainfall interception also varied between Thick and Thin phytocaps. The species that were established in the Thick phytocap intercepted more rain than the same species grown in Thin phytocap. This was due to better growth of trees in the thick phytocap with respect to height, stem diameter, larger canopy area and biomass. This is most likely as a result of deeper soil and better quality of soil in the thick phytocap compared to the thin phytocap. Canopy rainfall interception is also influenced by various leaf traits, contact angle of the droplets, drop size, bark texture and rainfall intensity.
References
- Asdak C, Jarvis PG, Gardingen PV. Evaporation of intercepted precipitation based on an energy balance in logged and unlogged forest areas of Central Kalimantan, Indonesia. Agric For Meteorol. 1998, 92:173-180.
- Hormann G, Branding A, Clemen T, Herbst M, Hinirchs A, et al. Calculation and simulation of wind controlled canopy interception of a beech forest in Northern Germany. Agric For Meteorol. 1996, 79:131-148.
- Valente F, David JS, Gash JHC. Modelling interception loss for two sparse eucalypt and pine forests in central Portugal using reformulated Rutter and Gash analytical methods. J Hydrol. 1997, 190:389-395.
- Crockford H, Richardson DP. Partitioning of rainfall in a eucalypt forest and pine plantation in south eastern Australia: II stemflow and factors affecting stemflow in a dry sclerophyll eucalypt forest and Pinus radiata plantation. Hydrol Process. 1990, 4: 145-155.
- Singh RP. Rainfall interception by Pinus Wallichiana plantation in temperate region of Himachal Pradesh, India. Indian For. 1987, 559-566.
- Opakunle JS. Throughfall, stemflow and rainfall interception in a Cacao plantation in south western Nigeria. Trop Ecol. 1989, 30:244-252.
- Manokaran N. Stemflow, throughfall and rainfall interception in a lowland tropical rain forest in peninsular Malaysia. Malaysian For. 1979, 42:174-201.
- Giacomin A, Trucchi P. Rainfall interception in a beech coppice (Acquerino, Italy). J Hydrol. 1992, 137:141-147.
- Spittlehouse D. Rainfall interception in young and mature conifer forest in British Columbia. In: 23rd Conference on Agricultural and Forest Meteorology: Weather data requirements for integrated pest management. 1998.
- Llorens P, Poch R, Latron J, Gallart F. Rainfall interception by a Pinus sylvestris forest patch overgrown in a Mediterranean mountainous abandoned area I. Monitoring design and results down to be even scale. J Hydrol. 1997, 199:331-345.
- Nambiar EKS, O' Loughlin E. Plantations, farm forestry and water, water and salinity issues in agro forestry. Rural Industries Research and Development Corporation. Barton. 2001.
- Crockford H, Richardson DP. Some errors in the measurement of precipitation, throughfall and stemflow and the implications for estimation of interception. In: Hydrology and water resources Hobart. Institution of Engineers, Australia. 1983, 1-7.
- Aboal JR, Jimenez MS, Morales D, Hernandez M. Rainfall interception in the Canary Islands, Agric For Meteorol. 1999, 97:73-86.
- Crockford H, Richardson DP. Partitioning of rainfall into throughfall, stemflow and interception: Effect of forest type, ground cover and climate. Hydrol Process. 2000, 14:2903-2920.
- Liu S. A new model for the prediction of rainfall interception in the forest canopies, Ecol Modell. 1997, 99:151-159.
- Juniper BE, Jeffree CE. Plant surfaces. Edward Arnold, London. 1983.
- Paliniswamy P, Bodnaryk RP. A wild Brassica from Sicily provides trichome based resistance against flea beetles, Phyllitreta cruciferae. Canadian J Entomol. 1994, 126:1119-1130.
- Zinke PJ. Forest interception studies in the United States, In: Sopper WE, Lull HW (eds), Forest Hydrology, Oxford. 1966, 137-161.


Open Access Journals
- Aquaculture & Veterinary Science
- Chemistry & Chemical Sciences
- Clinical Sciences
- Engineering
- General Science
- Genetics & Molecular Biology
- Health Care & Nursing
- Immunology & Microbiology
- Materials Science
- Mathematics & Physics
- Medical Sciences
- Neurology & Psychiatry
- Oncology & Cancer Science
- Pharmaceutical Sciences