ISSN : 2348-9502
American Journal of Ethnomedicine
Estimating the Fluoride Concentration in Soil and Crops Grown over it in and around Mathura, Uttar Pradesh, India
1Public Health Dentistry, Vyas Dental College and Hospital, Jodhpur, Rajasthan, India
2Oral Medicine and Radiology, Vyas Dental College and Hospital, Jodhpur, Rajasthan, India
Abstract
Objectives: A study was conducted with an objective to estimate the fluoride concentration in soil and crops grown over it which was not done before in Mathura city, Uttar Pradesh, India. Methodology and Analysis: From in and around Mathura city, 12 different samples of soil from 12 different fields of 4 different villages were collected along with 12 samples of crops namely rice, wheat and potato grown over it for fluoride estimation. The fluoride concentration in ppm was estimated by using Ion selective electrode method. The data thus collected was put for statistical analysis using Paired t-test and ANOVA-test to find the correlation between fluoride concentration in soil and crops grown over it.
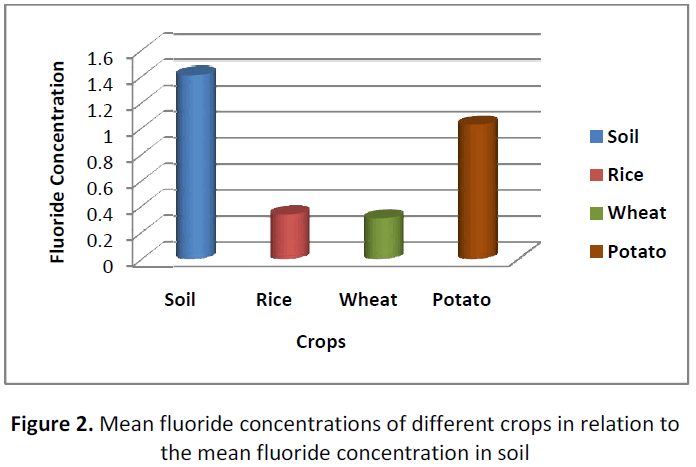
Results: It was found that the mean fluoride concentration of soil was 1.41ppm and in rice, wheat and potato were 0.342ppm, 0.305ppm and 1.025ppm respectively. It was also found that irrespective of fluoride concentration in soil, the fluoride concentration in potato was found to be more as compared to rice and wheat which was statistically significant.
Conclusion: The concentration of fluoride in crops consumed in the locality as seen in this study should be considered as an important source of fluoride in addition to other sources such as water, milk, tea etc.
Keywords
Fluoride, Soil, Rice, Wheat, Potato, Fluorosis.
INTRODUCTION
The main sources of fluoride are water, air, soil and rocks and atmosphere [1]. Fluoride is estimated to be thirteenth in abundance among the elements of the earth [1]. According to WHO, it is well documented that the optimum level of fluoride uptake is 1 ppm in drinking water and at this optimal level fluoride plays an important role in caries prevention due to its cariostatic potential [2]. The excessive uninterrupted intake of fluoride for longer duration can have deleterious effect on teeth and bone leading to dental fluorosis and skeletal fluorosis [3]. The principal sources of fluoride available to human being are drinking water and foods such as fish, milk, tea and crops [4]. Among crops, vegetables and fruits normally contain fluoride though at low concentration (0.1 mg/kg-0.4 mg/kg). Higher levels (up to 2 mg/Kg of fluoride) have been found in cereals [5]. Fluorosis is commonly seen in areas of Mathura which ranges from very mild to mild. This range of fluorosis might be due to additional exposure to other sources of fluoride which adds to the total fluoride intake such as crops (wheat, rice, potato) which are consumed frequently in Mathura. The sample was collected in the month of September when it was monsoon climate, from 4 different geographical regions of Mathura city, Uttar Pradesh, India namely Ajehi village, Maghera village, Raal village and Chauma village. The concentration of fluoride from various sources such as water [6], milk, tea has been estimated in previous studies conducted in Mathura city.
Objectives
To estimate the concentration of fluoride in soil of different villages of Mathura.
1. To estimate the fluoride concentration in the crops grown over those soils (wheat, rice and potato).
2. To correlate the level of concentration of fluoride in soil to level of concentration of fluoride in crops namely wheat, rice, potato grown over the soil.
METHODOLOGY
The present study was carried out to estimate the fluoride concentration in soil and crops grown over it, collected from 4 different geographical regions of Mathura city namely Ajehi village, Maghera village, Raal village and Chauma village.
Collection of Samples
Collection of soil
Samples of 12 different soils were collected from 4 different villages of Mathura district. Three samples of soil of respective crops rice, wheat and potato from each village were collected. The soil was collected from all the four corners and from the centre of the field in plastic packets and stored in cool place to maintain moisture in the soils. Soils were stored for three days and transported from Mathura to Lucknow laboratory for fluoride content estimation on the fourth day.
Collection of crops
In Mathura district, the most commonly grown and consumed crops are: I-Wheat, II-Rice, III-Potato.
Three crops were collected from each village and were ripened properly. The crops were collected in plastic packets and carried to the laboratory within three days in dried form.
Laboratory Analysis
The fluoride estimation was carried out at Quality Control Laboratory, Lucknow with the help of Mr. Surinder Singh, Laboratory technician and Mrs. Rekha Rani, Incharge of Central laboratory. The fluoride estimation was carried out in following steps:
Sample digestion
Fluoride estimation method
Fluoride estimation in soil
Fluoride estimation in crops.
Armamentarium Required
Digital electronic balance, Silicon crucibles, Muffle furnance, Plastic flasks, Measuring cylinder, Funnel and filter paper, Deionized water, Ion- selective electrode (Orion 9609BNWP) coupled to an ion analyzer (Orion-4 star), TISAB III solution, Fluoride Standard solution.
Sample Digestion
There are two methods of sample digestion for mineral analysis: Dry ashing, Wet digestion.
For soil, rice, wheat and potato digestion dry ashing is an appropriate method. In dry ashing method, 15 gm of each of 12 samples of soil were weighed on a Digital Electronic Balance and 5 gm of 4 samples of rice, 4 samples of wheat and 4 samples of potato were also measured in silicon crucibles. Then the samples were ashed at 550 degree Celsius in muffle furnance for 4-6 hours. Then the samples were cooled in desiccator and the residues were mixed with 20 ml of deionized water and filter the extract through deionized water washed filter paper in a volumetric flask.
Method of Fluoride Estimation
Fluoride was determined in the 24 samples extracts by electrochemical means by using ion- selective electrode (Orion 9609BNWP) coupled to an ion analyzer (Orion-4 star). Before estimating fluoride content in the samples extract the instrument was standardized by using fluoride standards containing TISAB III. The electrode reading was standardized by using pre prepared 1ppm and 10ppm solutions.
Fluoride Estimation in Soil
For the fluoride estimation in soil 10 ml of each extract is measured in a plastic container and 1ml of TISAB buffer solution was added to it and then potentiometric measurement of fluorine content in the sample was carried out by ion- selective electrode (Orion 9609BNWP) coupled to an ion analyzer (Orion- 4 star)7 . After each sample fluoride estimation the electrode is to be washed with deionized water and dried properly.
Fluoride Estimation in Food Samples
For the determination of fluoride concentration food samples (rice, wheat and potato) were dried and digested by dry ashing method and fluoride ion content was determined by Ion selective electrode method in the similar way as that of soil was done.
Statistical Analysis
Data collected was amenable to statistical analysis and Paired-t test, one way ANOVA and Pearson’s correlation were used. p value ≤ 0.05 was fixed to be statistically significant.
RESULTS
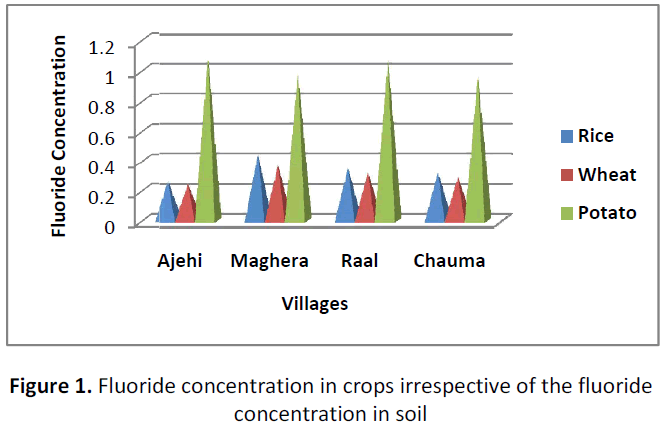
The Fluoride concentration in crops in relation to mean fluoride concentration of soil in different villages was found to be 0.47 ppm in wheat, 0.49 ppm in rice and 1.09 ppm in potato in Ajehi, 0.34 ppm in wheat, 0.38 ppm in rice and 0.98 ppm in potato in Maghera, 0.32 ppm in wheat, 0.35 ppm in rice and 0.96ppm in potato in Raal and 0.45 ppm in wheat, 0.49 ppm in wheat and 1.03ppm in potato in Chauma village. (Figure 1).
Figure 2 shows mean fluoride concentration in soil and crops grown over it in and around Mathura city. The mean fluoride concentration in soil was 1.41ppm, in wheat was 0.39ppm, in rice was 0.42ppm and in potato was 1.01ppm.
Table 1 shows relation between fluoride content in soil of different crops (One way ANOVA). It was found that there was no significant relationship between the fluoride concentrations of different soils over which crops were grown (F= 1.413, p=0.293).
Table 1: Relation between Fluoride content in soils of different crops (One-Way ANOVA test)
| Soil | N | Mean ± S.D. | F-value | p-Value | Significance | |
|---|---|---|---|---|---|---|
| Mean | Wheat | 4 | 1.282 ± 0.191 | |||
| Fluoride content in | Rice | 4 | 1.227 ± 0.195 | 1.431 | 0.293 | Not Significant |
| Potato | 4 | 1.662 ± 0.582 | ||||
| soil (ppm) |
(p ≤ 0.05-Significant, CI = 95 %)
When paired t-test was applied to see the comparison between the fluoride concentration in soil and crops grown over it in different villages, found that there was significant relation between the mean fluoride concentration of soil and mean fluoride concentration of rice and wheat (p= 0.002, 0.002 respectively, Table 2).
Table 2: Comparison of Fluoride concentration in soil and crops grown over it in different villages (Paired t-test)
| Soil-crop | Mean ± S.D. | T-value | p-Value | Significance |
|---|---|---|---|---|
| Soil-wheat | 0.88 ± 0.17 | 10.40 | 0.002 | Significant |
| Soil-rice | 0.85 ± 0.16 | 10.27 | 0.002 | Significant |
| Soil-potato | 0.64 ± 0.52 | 2.465 | 0.090 | Not Significant |
(p ≤ 0.05-Significant, CI = 95 %)
Table 3 shows the correlation between Fluoride concentration in crops irrespective of fluoride concentration in different soils (Pearson’s Correlation test) and was found that there was a significant correlation between soil and potato mean fluoride concentration but there was no correlation between mean fluoride concentration of soil and rice and wheat.
Table 3: Correlation between mean Fluoride concentration of crops and mean fluoride concentration of soil (Pearson’s Correlation test)
| F-concentration | Correlation | p-value |
|---|---|---|
| Rice | 0.562 | 0.438 |
| Wheat | 0.461 | 0.539 |
| Potato | 0.985** | 0.015 |
(p ≤ 0.05-Significant, CI = 95 %)
DISCUSSION
The total ingestion of fluoride by a person should be estimated taking into consideration the fluoride consumed from all the sources, to get either the beneficial effect or to prevent the deleterious effect [8]. This is important to note that the availability of fluoride for consumption is not only from drinking water but also from other sources such as diet (dairy products like milk, fruits and vegetables, beverages like tea and coffee and soil and crops like wheat, rice, and potato). It was observed from the study that the mean fluoride concentration in soil in different villages was found to be 1.58ppm, 1.18ppm, 1.19ppm and 1.68ppm in Ajehi, Maghera, Raal, Chauma respectively. The mean fluoride concentration in different crops was found to be more in rice and potato (0.34ppm and 1.03ppm) as compared to wheat (0.31 ppm). It was observed that there was no significant relationship between the fluoride concentrations of different soils over which crops were grown but there was significant relationship between the fluoride concentrations of different crops grown over different soils irrespective of soil mean fluoride concentration. The reason for such finding might be due to that the part of the plant grown below the soil absorbs more of fluoride as we found more of fluoride concentration in potato as compared to rice and wheat which are the grown above the soil [1]. Similar to present study earlier studies by Bhargava et al confirmed that fluoride has the tendency to be accumulated in the crops [9]. Fluoride is entering human food and beverage chain in increasing amount through the consumption of tea, wheat, rice, potato and other Indian foods by Gautam R et al. The fluoride in these items presumably results from the use of soil [10].
CONCLUSION
It was concluded that fluoride in soil and crops namely wheat, rice and potato can be an additional dietary source of fluoride which can be beneficial in preventing dental caries or deleterious for occurrence of fluorosis. Thus the role of diet has a double sword action, so fluoride content in food should not be disregarded in assessing the total fluoride uptake.
REFERENCES
- Radha G, Nagendra B, Yashoda S. Fluoride Accumulation By Vegetables And Crops Grown In Nawa Tehsil Of Nagaur District (Rajasthan, India). Journal of Phytology 2010; 2(2): 80–85.
- World Health Organization. Oral Health Surveys. Basic methods. (WHO), Geneva 4thEd 1997.
- S Saravanan, C Kalyani, MP Vijayarani, P Jayakodi, AJW Felix, S Naqarajan, P Arunrnozhi, V Krishnan. Prevalence of Dental Fluorosis among primary school children in rural areas of Chidambaram Taluk, Cuddalore District, Tamil Nadu, India. Indian Journal of Community Medicine. 2008; 33 (3): 16-18.
- JJ Murray, AJ Rugg-Gunn, GN Jenkins. Fluorides in Caries Prevention – Physiology of fluoride. John Wright & Sons Ltd., 3rdEdition, 1991: p- 262-4.
- Jolly S, Oberoi D, R Sharma, S Ralhan. 1974. Fluoride Balance Studies in Cases of Endemic Fluorosis. Proceeding of the Symposium on Fluorosis, Hyderabad, India.
- Ashok Kumar Mohapatra, Jitender Solanki. Prevalence of dental caries and dental fluorosis in 5-6 and 12-13 year school children residing in various levels of fluoride concentration in drinking water in Mathura city [Dissertation]. Agra: Dr. B. R. Ambedkar University; 2009.
- Internet access:www.userwebs.pomona.edu/ cjt04747/Chem161/.../Fluoride.pdf assessed on: 11-9-2013.
- Ole Fejerskov, Jan Eksrand and Brain A. Burt. Fluorides in Dentistry. 2nd Edition. Munksgaard publishers-1996. Pages: 40 -49.
- Bhargava D and Bhardwaj N. Study of Fluoride Contribution through Water and Food to Human Population in Fluorosis Endemic Villages of North-Eastern Rajasthan. African Journal of Basic & Applied Sciences. 2009; 1 (3-4): 55-58.
- Gautam R, Bhardwaj N and Saini Y. Fluoride accumulation by vegetables and crops grown in nawa tehsil of nagaur district (Rajasthan, India). Journal of Phytology 2010; 2(2): 80-85.
- Lakdawala DR, BD Punekar. Fluoride Content of Water and Commonly Consumed Foods in Bombay and a Study of the Dietary Fluoride Intake. Indian J. Med. Res. 2010; 61:1679-1687.
- RS Dave, DG Acharya, SD Vediya, MT Machhar. Status of fluoride in ground water of several villages of Modasa Taluka, North Gujarat for drinking purpose. Der Pharma Chemica, 2010; 2(2): 237-240.
Open Access Journals
- Aquaculture & Veterinary Science
- Chemistry & Chemical Sciences
- Clinical Sciences
- Engineering
- General Science
- Genetics & Molecular Biology
- Health Care & Nursing
- Immunology & Microbiology
- Materials Science
- Mathematics & Physics
- Medical Sciences
- Neurology & Psychiatry
- Oncology & Cancer Science
- Pharmaceutical Sciences


