ISSN : 2348-1927
Annals of Biological Sciences
Epidemiology and Molecular Characterization of Trypanosome Species in Livestock Ruminants in the Gambia
Alpha Kargbo1*, YKE Ibrahim2, Gloria Dada Chechet3 and Emmanuel Oluwadare Balogun3
1Department of Physical and Natural Sciences, University of the Gambia, Sere Kunda, Gambia
2Department of Pharmaceutical Microbiology, Ahmadu Bello University, Zaria, Nigeria
3Department of Biochemistry, Ahmadu Bello University Zaria, Nigeria
- *Corresponding Author:
- Alpha Kargbo
Department of Physical and Natural Sciences,
University of the Gambia,
Sere Kunda,
Gambia;
Email: akargbo@utg.edu.gm
Received: October 03, 2020, Manuscript No. abs-23-3361; Editor assigned: October 08, 2020, PreQC No. abs-23-3361 (PQ); Reviewed: October 22, 2020, QC No. abs-23-3361; Revised: October 18, 2023, Manuscript No. abs-23-3361(R); Published: November 15, 2023, DOI: 10.36648/2348-1927.11.5.102
Citation: Kargbo A, Ibrahim YKE, Chechet GD, Balogun EO (2023) Epidemiology and Molecular Characterization of Trypanosome Species in Livestock Ruminants in the Gambia. Ann Bio Sci Vol.11 No.5:102.
Abstract
African Trypanosomes cause sleeping sickness in humans or Nagana in animals. Records of the incidence of trypanosomes in cattle for the period of 2010-2016 at International Trypanotolerant Centre (ITC) in the Gambia was computed. Blood samples of 384 cattle, 42 Goat and 59 Sheep from two regions in the Gambia, Central River Region (CRR) and Lower River Region (LRR) were analyzed microscopically in the Gambia before transferring them on FTA whatman filter paper and then they were transported to Nigeria for further analysis. Using specific primers, the blood samples were also molecularly analyzed for trypanosome ribosomal DNA and selected amplicons were sequenced. Results show that T. vivax was the predominant trypanosome species from 2010-2016, closely followed by T. congolense and T. brucei brucei in only few cases. The trypanosomes were more frequently isolated in the last three months of the calendar year (October-December). Microscopy result in cattle showed a prevalence of 1.56% while molecular analysis on the other hand showed a higher prevalence of 12.5%. This is predominantly was made up of T. congolense kilifi (2.6%), others being T. brucei brucei (1.3%), T. congolense savannah/forest (0.52%) and T. vivax (3.65%). There were also cases of mixed infection (4.43%). In both sheep and goats, microscopy and Polymerase Chain Reaction (PCR) results gave a prevalence of 1.7% and 0% respectively. There is seasonal and district variation in cases of trypanosome infection of animals in the Gambia, with higher cases in the late rainy and early dry season. The predominant species causing trypanosome infection in cattle in the Gambia are T. congolense and T. vivax and to a lesser extent T. brucei brucei. Mixed Trypanosoma infection in some cattle was detected using molecular method including T. godfreyi and T. simiae or T. grayi which could not have been detected by buffy coat currently use in the Gambia.
Keywords
Epidemiology; Molecular characterization; Prevalence of trypanosomiasis; Microscopy; Gambia
Introduction
Trypanosomiasis is known to be chronic, devastating and often deadly disease of people and livestock in sub-Saharan Africa. The Trypanosoma species of economic significant in animals are: Trypanosoma congolense, T. vivax, T. brucei brucei, T. evansi, T. equidae and T. simiae. T. brucei gambiense and T. brucei rhodensiense have been associated to cause sleeping sickness in humans called Human African Trypanosomiasis (HAT). T. congolense is the chief causative agent of nagana in cattle and T. evansi causes surra in camels. African Animal Trypanosomiasis (AAT) has significantly affected settlements and economic growth in most of the African countries, especially south of the Sahara desert where it is transmitted mainly by tsetse flies [1]. The occurrence of trypanosomiasis in Africa, is mainly dependent on the presence of tsetse flies, which infest 36 countries with a joint total area of between 9 and 10 million km2, where close to 50 million cattle and tens of millions of small ruminants are at risk of being infected with these parasites.
Tsetse flies (Glossina spp) are large biting and blood feeding insects, which are of great economic, veterinary and medical importance, owing to their ability to transmit AAT and HAT. The Gambia is undoubtedly not an exception in the infestation and economic loses posed by trypanosomiasis as it is the same circumstance in other countries within the sub-Sahara region [2]. AAT hinders agricultural production in Africa particularly in areas that hold the continent’s greatest potential for improved agricultural production. Animals kept in trypanosomiasis endemic areas when compared to animals kept in trypanosomiasis free areas have; lower calving, rates, shorter lives, unhealthy oxen for cultivation, lower milk yields, high calf mortality and more recurrent usage of trypanocidal drugs which are now failing in eradicating the parasites. AAT is one of the most important parasitic diseases disturbing livestock productivity in the Gambia and equines are often very vulnerable. Central river region and lower river region of the Gambia are infested with the tsetse fly Glossina morsitans submorsitans, this is the major vector of trypanosomiasis in the country and is mainly found in dry, canopied, savannah woodland areas. Glossina palpalis are also present, but they are more abundant in riverine vegetation along the river Gambia as compared to the other vegetation [3]. Tsetse fly infestation in Kiang west and Niamina east district has been reported to be high and medium respectively over the last twenty years, even though the present tsetse fly challenges and cattle trypanosomiasis risk in these sites needs to be updated to get a better understanding of the current situation. Despite the fact that, ITC in the Gambia has over the decades endeavored to select and genetically improve indigenous trypanotolerant N’dama cattle, with other breeds and as well monitor the Pack Cell Volume (PCV) and parasitamia level of cattle every month within CRR and LRR in an effort to curb the incidence of trypanosomiasis in the country, Trypanosomiasis still remains a live threatening infection for many cattles in the Gambia [4].
Materials and Methods
Study area
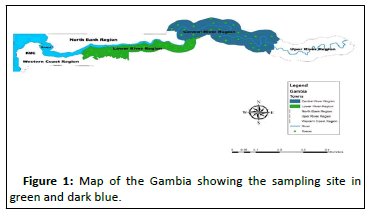
This study was conducted in six villages each in Central River region-South (CRR-S) and Lower River Region (LRR) of the Gambia. Figure 1 shows the two colored regions were this study was done. Table 1 shows the coordinates of the villages were various samples were collected using the Google earth app [5].
Study design
The communities that were sampled in this study were visited prior to the commencement of the study in order to obtain consent from the heads of the communities, individual cattle owners and their herdsmen. Random and convenient sampling methods was adopted based on the response from the various heads and cattle owners. The districts and villages in the study area were first randomly selected by balloting all the districts in each region. However convenient sampling was later adopted due to non-availability of district livestock assistants and nonwillingness of the herdsmen. 384 N’dama cattle, 59 Djaloke sheep and 42 west African dwarf goats were sampled from semi intensive herd and ITC herds [6].
| Region | Districts | Village | Satellite coordinates |
|---|---|---|---|
| LRR | Kiang West | Kulli Kunda | 13°2’20.67”N |
| 15°54’59.70”W | |||
| Karantaba | 13°26’26.93”N | ||
| 15°30’57.44”W | |||
| Keneba | 13°19’54.37”N | ||
| 16°00’34.90”W | |||
| Tankular | 13°25’03.30”N | ||
| 16°02’02.02”W | |||
| Kiang Central | Kwinella | 13°24’53.53”N | |
| 15°47’59.00”W | |||
| Bamako | 13°22’22.67”N | ||
| 15°43’21.96”W | |||
| CRR | Niamina West | Sambel Kunda | 13°39’54.69”N |
| 14°58’32.87”W | |||
| Misera | 13°37’28.92”N | ||
| 15°04’05.46”W | |||
| Touba | 13°35’08.85”N | ||
| 15°19’13.65”W | |||
| Lower Fulladu | Kerewan Samba Sira | 13°31’00.78”N | |
| 14°53’50.27”W | |||
| Upper Fulladu | Yorro Berre Kunda | 13°30’56.77”N | |
| 14°47’02.08”W | |||
| Janjanbureh | Janjabureh | 13°32’03.95”N | |
| 14°46’11.49”W |
Table 1: Villages sampled in each of the region and their satellite coordinates.
Retrospective studies
Records of incidence of trypanosomiasis was collected at the ITC substations at Kudang CRR. Records from 2010 to 2016 was obtained [7].
Blood sampling of cattle
Two milliliters of blood was drawn from the jugular vein of the cattle using vacutainer tube (containing Ethylene Diamine Tetra Acetic (EDTA) as anticoagulant). About 100 μl of blood was dispensed on the FTA card. Another venous blood was transferred into 2 ml microhaematocrit capillary tube one end was sealed with sealant (Critoseal® Illinois, USA) and centrifuged at 10,000 rpm for 5 min. The percentage of the Pack Cell Volume (PCV) was recorded using the microhaematocrit reader (Hawksley microhaematocrit reader, 1869, sussex, UK). Diamond pencil was used to cut the buffy coat just above the red blood cell and placed on a slide for microscopy [8].
Microscopy
Parasitaemia was determined using dark ground buffy coat microscopy at a magnification of × 400. All the samples were stored on the FTA Whatman card and they were allowed to dry at room temperature before placing them in sealed envelope with desiccate. The samples were then transported to Ahmadu Bello university, Zaria, Nigeria. The samples were kept at -20°C until when needed for DNA extraction [9].
Genomic DNA extraction
From the FTA cards containing the blood samples, 3 mm of the filter paper was punched into a 1.5 ml eppendorf tube containing 1 ml of phosphate buffer saline and it was incubated at room temperature overnight. The puncher was clean in 70% ethanol and then counter punched on black a filter paper to avoid contamination. Five hundred microliter of phosphate buffer saline was added the eppendorf tube with punched blood spotted paper and it was left over night. The DNA was extracted using quick-DNA mini prep plus kit (Zymo research) using the manufacturer’s protocol which was as follows; 200 μl of the sample was added to a micro centrifuge tube and another 200 μl bio-fluid and cell buffer plus 20 μl proteinase K was were added to the samples. The content was mixed thoroughly and then incubate at 55°C for 10 min. 420 μl genomic binding buffer was added to the samples. The entire content was then transferred to a zymo-spin column in a collection tube and then it was centrifuged at 12000 × g for 1 min [10]. The collection tube with the flow through were discarded. 400 μl DNA pre wash buffer was added to the column in a new collection tube and it was centrifuged for 1 min and after which, the collection tube was emptied. 700 μl g-DNA wash buffer was then added and it was centrifuged for 1 min and the collection tube was emptied again. After that, 200 μl g-DNA wash buffer was added again and it was centrifuged for 1 min. the collection tube with the flow through were discarded. The micro centrifuge tube was transferred to a clean 1.5 ml eppendorf tube, where 50 μl DNA elution buffer was added to the micro centrifuge tube and then it was allowed to Incubate for 5 min and then it was centrifuged for 1 min. The eluted DNA was then stored at -20°C at the center for biotechnology research and training.
PCR
Nested PCR was conducted using the ITS-1 primers to detect the presence of trypanosome specie on the extracted DNA. Nested PCR was performed using a 25 μL reaction volume containing 4 μL (1 ng/μL) template DNA for the first reaction and 2 μL (1 ng/μL) template DNA for the second reaction, 25 μM of each primer, 10 mM dNTPs, 25 mM 10 x taq polymerase buffer and 5 U/μL taq polymerase. The products from the nested PCR were subjected to gel electrophoresis (35 minutes at 100 V) in 1% agarose gel stained with ethidium bromide and visualized using chem-doc imaging system (BIO-RAD).
Sequencing analysis
The ITS-1 PCR product were randomly selected in order to be have a representation of each of the bands on the PCR products. This products were first purified using MagExtractor-PCR and gel cleanup (0810 NPK-601 F0986K TOYOBO) and it was sequenced using the bigdye™ terminator v3.1 cycle sequencing kit (applied biosystems) and an ABI PRISM 310 genetic analyzer (applied biosystems) according to the manufacturer’s guide [11].
Results
Retrospective analysis of records of Trypanosoma infection in the Gambia
There were no records available on the prevalence of trypanosomiasis in the two regional livestock centers and ITC center at Keneba. However, were able to analyze records from ITC Kudang substation which included; Touba, Misera and Sambel Kunda villages respectively from 2010-2016 as shown in Tables 1-5.
We observed that, the occurrence of the incidence of trypanosome infection is more prevalent in the Gambia in October which is known to be the late rainy season and November-January, early dry season [12].
| Frequency (n) | |||
|---|---|---|---|
| Month | T. brucei brucei | T. congolense | T. vivax |
| January | 0 | 0 | 7 |
| February | 0 | 0 | 2 |
| March | 0 | 1 | 3 |
| April | 0 | 0 | 1 |
| May | 0 | 0 | 0 |
| June | 0 | 7 | 1 |
| July | 0 | 4 | 2 |
| August | 0 | 7 | 3 |
| September | 0 | 8 | 4 |
| October | 0 | 36 | 58 |
| November | 0 | 17 | 88 |
| December | 0 | 40 | 17 |
| Total | 0 | 120 | 186 |
Note: n=Number of cases
Table 2: Retrospective analysis of Trypanosoma infection for the year 2010.
| Frequency (n) | |||
|---|---|---|---|
| Month | T. brucei | T. congolense | T. vivax |
| January | 0 | 0 | 5 |
| February | 0 | 0 | 0 |
| March | 0 | 0 | 2 |
| April | 0 | 0 | 2 |
| May | 0 | 0 | 2 |
| June | 0 | 0 | 1 |
| July | 0 | 0 | 1 |
| August | 0 | 0 | 0 |
| September | 0 | 0 | 3 |
| October | 0 | 1 | 8 |
| November | 0 | 0 | 2 |
| December | 0 | 3 | 2 |
| Total | 0 | 4 | 28 |
Note: n=Number of cases
Table 3: Retrospective analysis of Trypanosoma infection for the year 2016.
Tables 2-4 clearly shows that, there were only few cases of T. brucei brucei and this was recorded only in three years whiles the occurrence T. vivax doubled that of T. congolense. Touba had the highest prevalent village.
| Frequncy (n) | ||||
|---|---|---|---|---|
| Year | T. brucei brucei | T. congolense | T. vivax | Total |
| 2010 | 0 | 120 | 186 | 306 |
| 2011 | 0 | 17 | 18 | 35 |
| 2012 | 4 | 34 | 108 | 146 |
| 2013 | 1 | 52 | 121 | 174 |
| 2014 | 1 | 23 | 51 | 75 |
| 2015 | 0 | 12 | 78 | 90 |
| 2016 | 0 | 4 | 28 | 32 |
| Total | 6 (0.7%) | 262 (30.5%) | 590 (68.8%) | 858 |
Table 4: Incidence of Trypanosoma species in the Gambia (2010-2016).
| Frequency (n) | |||
|---|---|---|---|
| Year | Touba | Misera | Sambel Kunda |
| 2010 | 154 | 99 | 53 |
| 2011 | 23 | 11 | 1 |
| 2012 | 58 | 50 | 38 |
| 2013 | 75 | 50 | 49 |
| 2014 | 33 | 18 | 24 |
| 2015 | 53 | 13 | 24 |
| 2016 | 15 | 5 | 12 |
| Total | 411 (48%) | 246 (29%) | 201 (23%) |
Table 5: Distribution of trypanosomiasis in different villages in the Gambia from 2010-2016.
Microscopy
The result of microscopic examination of cattle as presented in Table 6 clearly revealed that only six out of the 384 (1.56%) blood samples collected from cattles in this study were positive for trypanosome. T. congolense was seen as the dominant trypanosomial infective specie. Only one sheep was seen positive with T. congolense but no goat was positive at all.
| Region | Sampling area | No examined (n) | Positive (%) | Isolate |
|---|---|---|---|---|
| CRR | Sambel kunda | 19 | 1 (5.26) | T. congolense |
| Others | 176 | 0 (0) | - | |
| LRR | Kolly kunda | 40 | 2 (5.0) | T. congolense and T. vivax |
| Karantaba | 37 | 1 (2.7) | T. congolense and T. vivax | |
| Tankular | 40 | 2 (5.0) | T. congolense and T. vivax | |
| Others | 72 | 0 (0) | - | |
| Total | 384 | 6 (1.56) | - |
Table 6: Microscopical analysis of cattle blood specimen for trypanosomiasis in the sampling areas.
Pack Cell Volume (PCV) of the cattle
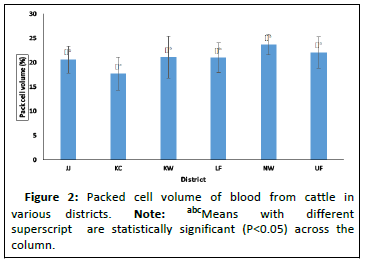
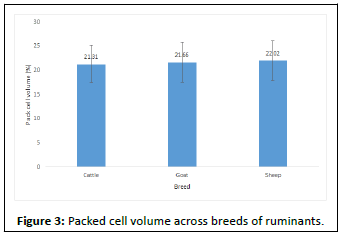
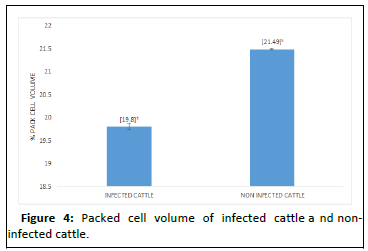
The PCV result presented in Figure 2 shows that animals in Kiang central were the most anemic as compared to the other districts in this study. This differences in PCV across these districts are shows to be statistically significant. On the other hand, PCV across the breeds and for the infected cattle and noninfected cattle as shown in Figures 3 and 4 were not statistically significant, though some cattle had PCV as low as 11%.
The average Pack Cell Volume (PCV) obtained from infected and non-infected cattle is presented in Figure 4. Animals in Niamina west had the highest PCV as compared to the rest of the other districts. This was followed by animals in upper Fulladu, Kiang west, lower Fulladu, Janjangbureh and finally Kiang central animals had the least [13].
Nested PCR result
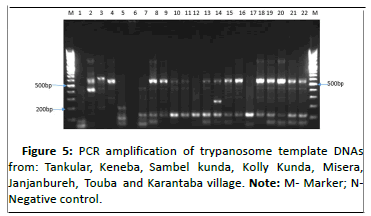
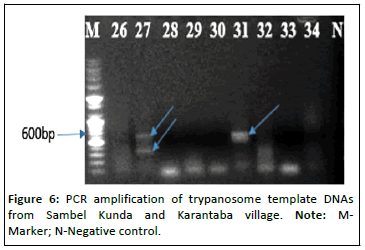
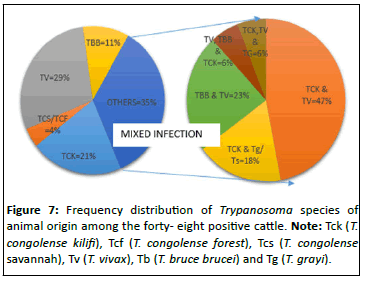
A total of 485 animals including 384 cattle, 59 sheep and 42 goat blood samples were screened for the presence of trypanosome using the ITS-1 primers. Only one sheep was seen with T. congolense kilifi 1.7% (1/59) and all the goats were negative (0/42). In Table 7, the molecular result shows a total of 48 cattle were positive for Trypanosoma species yielding an overall trypanosome infection rate of 12.5% (48/384) of which 2.6% (10/384), 0.52% (2/384), 3.6% (14/384) and 1.3% (5/384) were T. congolense kilifi, T. congolense savannah/forest, T. vivax and T. brucei brucei respectively.
However, we also saw 4.43%(17/384) mixed infections of which 2.08% (8/384), 0.78%(3/384), 1.04% (4/384), 0.26% (1/384) and 0.26% (1/384) were T. congolense kili i and T. vivax, T. congolense kili i, T. vivax and T. grayi/T. simiae, T. vivax, T. brucei brucei and T. congolense kili i, T. congolense kili i, T. vivax and T. brucei brucei, T. congolense kili i, T. vivax and T. godfreyi respectively as shown in Figures 5-7.
| Regions | Sampling site | No of animals examined | Trypanosoma species | ||||||||
|---|---|---|---|---|---|---|---|---|---|---|---|
| Single infection | Mixed infection | ||||||||||
| TCK | TCS/TCF | TV | TCK and TV | TCK and TV | TCK and TG/TS | TBB and TV | TV, TBB and TCK | TCK, TV and TG | |||
| CRR | Touba | 36 | 3 | - | 3 | - | 3 | - | - | - | - |
| Misera | 20 | 3 | 1 | 3 | 1 | - | 1 | - | - | 1 | |
| Sambal kunda | 19 | - | 1 | - | 1 | 4 | 1 | 1 | - | - | |
| Yorro berre Kunda | 45 | - | - | 2 | 1 | - | - | - | - | - | |
| Janjanbureh | 40 | - | - | 2 | - | - | - | - | - | - | |
| Kerewan samba sira | 35 | - | - | 1 | - | - | 1 | - | - | - | |
| LRR | Karantaba | 37 | 2 | - | - | - | 1 | - | 1 | - | - |
| Keneba | 50 | - | - | - | 2 | - | - | - | - | - | |
| Kolly kunda | 40 | 1 | - | 1 | - | - | - | 2 | - | - | |
| Tanukular | 40 | 1 | - | 2 | - | - | - | - | - | - | |
| Others | 22 | - | - | - | - | - | - | - | 1 | - | |
| Total | 384 | 10 (2.6%) | 2 (0.52%) | 14 (3.6%) | 5 (1.3%) | 8 (2.08%) | 3 (0.78%) | 4 (1.04%) | 1 (0.26%) | 1 (0.26%) | |
Note: Tck (T. congolense kilifi), Tfs (T. congolense forest), Tcs (T. congolense savannah), Tbb (T. brucei brucei), Tv (T. vivax), Tg (T. grayi) and Tg (T. godfreyi)
Table 7: Incidence of Trypanosome infection in cattle in the Gambia.
Sequence analysis of nested PCR amplicons
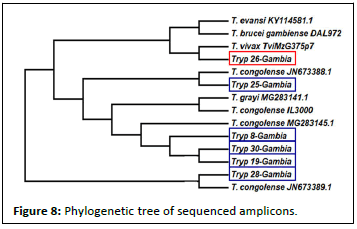
A total of eight sequences were sent to Japan for sequencing to further authenticate the PCR results. The sequences obtained were blast on the TriTryps data base. The sequence of 430 bp product was 100% identical to Tb4742762v4 (T. brucei), Tb927_07v5.1 (T. brucei brucei), DAL Tbg972_03 (T. brucei gambiense) and STIBB05 (T. evansi). 160bp was also 100%identical to Tvy486 (T. vivax) 380 bp was also 100% identical with JMRU01000589 (T. grayi). Upon drawing of the phylogenetic tree, the amplicon that had 100% similarity showed to be closely related to T. vivax than that of T. brucei gambiense. As shown in Figure 8 below.
Discussion
ITC is the only institution established in the Gambia with the sole responsibility of monitoring AAT, however, Medical Research Council (MRC) do monitors HAT but only when there are grants available for such. There are veterinary outpost in all the administrative regions in the Gambia and are man by field workers such as veterinary livestock assistants etc. During the course of this study, only ITC actually kept proper records of the incidence of trypanosomiasis, the veterinary outpost only monitors the outbreak of the disease with little or no documentation was seen during the course of this work. Analysis of records of trypanosome infection at ITC, clearly showed that Touba had the highest cases, constituting 48% of all the cases. Misera and Sambel Kunda had much lower number of cases. Records of trypanosome infection from ITC, clearly indicated that most infections occurred in the late rainy October and early dry season (November-January) within the recorded years (2010-2016).
The above pattern clearly shows that, trypanosome infection in the Gambia is based on seasonal variations. This study confirms the findings of that, the occurrence of trypanosome infection in the Gambia varies according to seasons. It is also in agreement with the findings that, the occurrence of Glossina submorsitan in the Gambia fluctuates based on seasons. Similar trend has also been reported by who showed that, the incidence of trypanosome in Jos Plateau state Nigeria is seasonal, occurring between the dry season in March and late wet season in October. Records also should that, 2010 has the highest incidence of the parasite, with T. vivax having a higher incidence than T. congolense and T. brucei brucei. We saw drastic reduction of trypanosome incidence in 2011 and 2016. This might be due to several factors such as climate change, increasing deforestation and expansion of agricultural activities, which have led to a reduction in the vegetation in CRR, these naturally leads to reduced habitat for tsetse flies and the natural host of trypanosome warthog (Phacochoerus africanus). Increased breeding and release of trypanotolerant cattle into the communities may also have been a factor.
Furthermore, there is usually transhumant activities during the (January to May) in the Gambia. During this period, there are usually influx of cattle from other districts and Senegal (Casamance region) into CRR and LRR for green pastures and this could have also been a reason why the incidence of trypanosome cases was higher in the late rainy to early dry season since there were few animals in CRR that were exposed to the tsetse flies. Dark ground buffy coat microscopy remains very instrumental particularly at the field level, since it can be carried out directly at the field level and give immediate results. However, limitation of this method is that it can only identify parasites base on their motility and sometimes it can be subjective. T. vivax is said to have a more rapid or shooting movement as compared with the sluggish nature of T. congolense. Another limitation of this method is also the fact that, parasites may only be seen if the parasitamia level in the host animal is high. Therefore, this method is limited in sensitivity. The method is also limited in its inability to identify mix infection.
Furthermore, we were able to confirm the presence of only six trypanosome cases out of the 384 samples, an incidence of 1.56% in cattle, 1.7% in sheep and 0% in goats using the above mentioned method. The lower incidence at microscopy could have been as a result of lower parasitamia levels in the animals because, where the study was conducted, there were influx of animals in the study area. This is the only method used in ITC for monitoring the incidence of this parasite in the country. Also used this method to identify trypanosome incidence in cattles in Sambel Kunda as indicated by microscopy, the predominant Trypanosoma specie was T. congolense, this trend is similar to that of who also reported that T. congolense was more prevalent in horses and donkeys in the Gambia. It is however in contrast with the ITC record of trypanosome infection for the period 2010-2016, which had T. vivax as the predominant specie. Anaemia is one of the cardinal signs of trypanosomiasis, this could be as a result of the effect of the parasite on the blood of their mammalian host and this parameter would obviously have an obnoxious effect on the productivity of the animals. Anaemia is commonly and easily measured using PCV index. Lower values of PCV (<20%) is generally taken as a sign of anaemia, nevertheless, the average PCV of animals in the Kiang central shows that, they were slightly anaemic.
This could have been as a result of the nutritional status of the animals or other haemoparasites present in these animals. The relatively higher PCV of animals in Niamina west may be as a result of the special care and attention given to these animal in this district, despite the fact that all the animals sampled in this area were the ITC herds. This care includes regular deworming, monitoring and timely treatment of animals infected with trypanosomiasis.
Furthermore, the study shows that there was no significant difference in the PCV of infected cattle as compared to the noninfected cattle. This result is not in agreement with the findings of. Who reported that, the difference between the PCV values of infected cattle was significant compared with PCV of noninfected cattle. The lower PCV values in the infected animals, may also be due to the time of the study. This study was undertaken between April to June and these months are known to be the pick of the dry season in the Gambia with little vegetation in the study area. Animals had to roam for kilometers for greener pasture and this may have had a serious impact on their health status. The presence of other haemoparasites in the cattle could have also been a reason for the lower PCV values in among the cattle in this study.
To the best of our knowledge, this is the first time in the Gambia that molecular identification and characterization of trypanosomes was carried out in cattle. This was done using the internal transcribed spacer one (ITS-1) generic primers of the ribosomal 18s DNA. These primers have the ability to identify all the eleven pathogenic strains of trypanosomes. Generally it was observed that, the incidence of the infection was highest in Misera (50%) while Janjanbureh (3%) had the least incidence rate. This result could be as result of the vegetation at Misera village which favors the breeding of the vector and the host as compared to the other sampled village.
Furthermore, we identified T. vivax as the specie with highest incidence, this is in agreement with the retrospective analysis result. The sequenced amplicons were first blast in the TriTryp data base and this gave one hundred percent similarity with T. brucei gambiense, T. vivax, T. congolense and T. grayi, but upon construction of the phylogenetic tree as shown in Figure 8 it was seen that amplicon tryp 26 Gambia which showed one hundred percent similarity in the blast search was not closely related to T. brucei gambiense but instead was closely related to T. vivax. The observation that T. vivax as the specie with highest incidence, is in agreement with the retrospective analysis result.
About half of the positives were shown to be mixed infection. This could have been as a result of the high probability of trypanosome infection or a possibility of chronic infection in susceptible hosts. The higher incidence of trypanosome in CRR confirms the findings of and who reported that Niamina east in the CRR has a high tsetse fly challenge when compared to LRR. The implication of T. brucei gambiense seen in cattle in the Gambia, should be of great concern. This clearly shows that, cattle are also involve in the transmission of HAT. The higher incidence rate with the molecular technique (12.5%) compared with microscopy (1.56%) is not unexpected.
This also affirms the reports made by and that, molecular techniques of detecting trypanosome species is more superior to other methods. PCR usually have the ability to identify and characterize the genetic variability among parasites. It usually works by amplifying and detecting the gene of a parasite even if it is a single gene. It provides a much improved level of sensitivity by detecting as low as a single parasite in the host blood [14].
Conclusion
This study showed that, the prevalence of trypanosome infection is based on seasonal variation in the Gambia, with higher cases in the late rainy and early dry season. Trypanotolerant breeds in used in controlling trypanosomiasis in the Gambia showed no significant differences in the pulled PCV values of infected animals and those of non- infection cattle. Molecular analytical method furthermore confirmed its sensitivity over microscopy in detecting the incidence of trypanosome infection. The predominant specie causing trypanosome infection in study area are T. congolense and T. vivax. Mixed trypanosomial infection in some cattle was detected by the molecular method which could not have been detected by the buffy coat microscopy method presently in use in the Gambia. Our result clearly shows the epidemiology of trypanosomiasis in the Gambia by using molecular tool which is more accurate than the microscopic technique. Intervention to eradicate tsetse flies and to equip and trained livestock assistant and ITC staff on the use of molecular facilities for more reliable diagnosis of the disease by all stakeholders is highly recommend.
Competing Interest
The authors declare that they have no competing interest.
Authors’ Contribution
AK collected the samples, conducted the PCR and draft the manuscript. YKE and CDC guided and directed the study. EOB performed the sequencing and as well guided and directed the study. All authors read and approved the final manuscript.
Acknowledgement
This work was supported by the program Africa center of excellence for neglected tropical disease and forensic biotechnology, Ahmadu Bello university, Nigeria and the Africa center of excellence, the Gambia.
References
- Black SJ, Mansfield JM (2016) Prospects for vaccination against pathogenic African trypanosomes. Parasite Immunol 38: 735-743.
[Crossref] [Google Scholar] [PubMed]
- Ng'ayo MO, Njiru ZK, Kenya EU, Muluvi GM, Osir EO, et al. (2005) Detection of trypanosomes in small ruminants and pigs in western Kenya: Important reservoirs in the epidemiology of sleeping sickness? Kinetoplastid Biol Dis 4: 1-7.
[Crossref] [Google Scholar] [PubMed]
- Solomon Ngutor K, Idris LA, Oluseyi Oluyinka O (2016) Silent human Trypanosoma brucei gambiense infections around the old Gboko sleeping sickness focus in Nigeria. J Parasitol Res 2016.
[Crossref] [Google Scholar] [PubMed]
- Snow WF, Wacher TJ, Rawlings P (1996) Observations on the prevalence of trypanosomosis in small ruminants, equines and cattle, in relation to tsetse challenge, in The Gambia. Vet Parasitol 66: 1-11.
[Crossref] [Google Scholar] [PubMed]
- Rawlings P, Ceesay ML, Wacher TJ, Snow WF (1993) The distribution of the tsetse flies Glossina morsitans submorsitans and G. palpalis gambiensis (Diptera: Glossinidae) in The Gambia and the application of survey results to tsetse and trypanosomiasis control. Bull Entomol Res 83: 625-632.
- Dhollander S, Jallow A, Mbodge K, Kora S, Sanneh M, et al. (2006) Equine trypanosomosis in the central river division of the Gambia: A study of veterinary gate-clinic consultation records. Prev Vet Med 75: 152-162.
[Crossref] [Google Scholar] [PubMed]
- Adams ER, Malele II, Msangi AR, Gibson WC (2006) Trypanosome identification in wild tsetse populations in Tanzania using generic primers to amplify the ribosomal RNA ITS-1 region. Acta Trop 100: 103-109.
[Crossref] [Google Scholar] [PubMed]
- Majekodunmi AO, Fajinmi A, Dongkum C, Picozzi K, Thrusfield MV, et al. (2013) A longitudinal survey of African animal trypanosomiasis in domestic cattle on the Jos Plateau, Nigeria: Prevalence, distribution and risk factors. Parasit Vectors 6: 1-10.
[Crossref] [Google Scholar] [PubMed]
- Picozzi K, Tilley A, Fevre EM, Coleman PG, Magona JW, et al. (2002) The diagnosis of trypanosome infections: Applications of novel technology for reducing disease risk. Afr J Biotechnol 1: 39-45.
- Enwezor FN, Samdi SM, Ijabor O, Abenga JN (2012) The prevalence of bovine trypanosomes in parts of Benue state, north-central Nigeria. J Vector Borne Dis 49: 188-190.
[PubMed]
- Claxton JR, Leperre P, Rawlings P, Snow WF, Dwinger RH (1992) Trypanosomiasis in cattle in Gambia: Incidence, prevalence and tsetse challenge. Acta Trop 50: 219-225.
[Crossref] [Google Scholar] [PubMed]
- Pinchbeck GL, Morrison LJ, Tait A, Langford J, Meehan L, et al. (2008) Trypanosomosis in the Gambia: Prevalence in working horses and donkeys detected by whole genome amplification and PCR, and evidence for interactions between trypanosome species. BMC Vet Res 4: 1-7.
[Crossref] [Google Scholar] [PubMed]
- Nakayima J, Nakao R, Alhassan A, Mahama C, Afakye K, et al. (2012) Molecular epidemiological studies on animal trypanosomiases in Ghana. Parasit Vectors 5: 1-7.
[Crossref] [Google Scholar] [PubMed]
- Takeet MI, Fagbemi BO, de Donato M, Yakubu A, Rodulfo HE, et al. (2013) Molecular survey of pathogenic trypanosomes in naturally infected Nigerian cattle. Res Vet Sci 94: 555-561.
Open Access Journals
- Aquaculture & Veterinary Science
- Chemistry & Chemical Sciences
- Clinical Sciences
- Engineering
- General Science
- Genetics & Molecular Biology
- Health Care & Nursing
- Immunology & Microbiology
- Materials Science
- Mathematics & Physics
- Medical Sciences
- Neurology & Psychiatry
- Oncology & Cancer Science
- Pharmaceutical Sciences
