ISSN : 2349-3917
American Journal of Computer Science and Information Technology
Development of Pattern Recognition and Representation Algorithm for Time Series Datasets
Emma N Nwajiobi1*, Sylvanus O Anigbogu2 and Kenechukwu Anigb2
1Department of Computer Science, Nwafor Orizu College of Education, Nsugbe, Anambra State, Nigeria
2Department of Computer Science, Nnamdi Azikiwe University Awka, Anambra State, Nigeria
- *Corresponding Author:
- Emma N Nwajiobi Dept of Computer Science, Nwafor Orizu College of Education, Nsugbe, Anambra State, Nigeria E-mail: nwajiobi.nnamdi@nocen.edu. ng
Received Date: August 06, 2021; Accepted Date: August 20, 2021; Published Date: August 27, 2021
Citation: Nwajiobi EN, Anigbogu SO, Anigb K (2021) Development of Pattern Recognition and Representation Algorithm for Time Series Datasets. Am J Compt Sci Inform Technol Vol.9 No.8: 105.
Abstract
In diverse areas of human endeavor such as business, industry, sciences and so on, massive amount of time series data are generated daily and due to the fact that time series data are typically very large, discovering information from such massive datasets therefore becomes a major challenge. A number of algorithms have been introduced to represent, classify, cluster, segment, index, detect motifs and anomalies in a time series data. In view of the above, this paper proposes a robust algorithm for pattern recognition and representation of a time series. The algorithm first normalises a time series dataset into the range [0,1]. The normalized version is now used for pattern identification and representation. In the proposed algorithm, we pre-defined patterns as up, down and flat patterns, and having equal length (three, five or ten data points). Each pattern represents a segment (subsequence) of the time series. The algorithm was tested with historical time series datasets obtained online from (a) Dow Jones Industrial Average (b) Nasdaq, and (c) S&P 500 via yahoo finance. Each dataset consisted of 5158 data points, covering the period 2000-2020. The algorithm captured all the pre-defined patterns in the datasets and was able to represent the patterns in the entire historical datasets with symbols. The algorithm is a veritable tool for time series data mining operations. Object-Oriented Analysis and Design Methodology (OOADM) and prototyping methodology were used to design the system; while PHP, MYSQL, HTML and CSS were used to develop the system. The system was well tested and the outputs were excellent.
Keywords
Pattern recognition; Time series; Representation; Algorithm; Data mining
Introduction
At present, majority of activities in companies and organizations generate large amounts of data which are typically saved in databases. However, the question of what to do with such huge amounts of data is not always easily obvious or answered in most situations by owners of such large databases. Though large computer storage disks make the storage of huge data possible, computational algorithms are also needed to analyze the data. Massive data sets are rarely profitable; their real worth lies in the possibility to extract useful information for making decisions or for understanding the phenomena that generated such data.
To this extent, information retrieval is no longer enough anymore for decision-making. Thus, the availability of these huge collections of data now created new needs that will help us make better and informed decisions, including making predictions about the future. These new needs include automatic summarization of data, extraction of information buried in stored data, and the discovery of patterns in raw data. With the availability of these enormous amounts of data stored in files, databases, and other repositories, it is therefore very important and necessary to develop improved means of analyzing and interpreting the data, as well as extracting interesting knowledge and patterns that could help in decision-making and prediction.
To make these large data sets more useful, we need techniques to analyze them with a view to finding out something surprising and interesting from the gathered data. In this regard, we are faced with the problem of how to find patterns from the datasets and show that the patterns are useful, informative and important. Data mining techniques can be used to discover patterns from large datasets, including time series datasets.
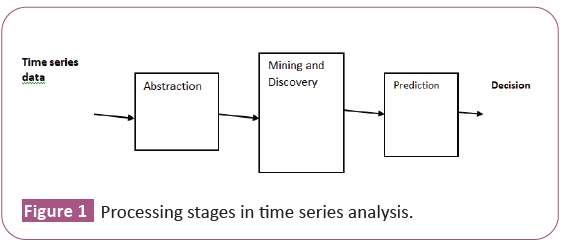
Time series is a collection of observations made sequentially in time [1]. It is an ordered sequence of values (real numbers) of a variable or variables measured, observed or calculated at regular time intervals over a period of time. According to Pohl and Bouchachia, the following activities can be performed on a time series data: detecting motifs, recognizing and extracting patterns, finding correlation between time series or finding similar time series. Similarly, analysis of a time series can be said to comprise three processing steps, namely: (a) Abstraction (or representation), (b) Mining and Discovery of trends and patterns, and (c) Prediction (Figure 1) [2].
Any information of the sequential nature can be processed by pattern recognition algorithms to make the sequences comprehensible for its practical use. The term pattern recognition connotes automatic discovery of regularities in data through the use of computer algorithms and with the use of these regularities to take such actions as classifying the data into different categories [3]. These regularities in data can be referred to as patterns.
According to Raj et al. pattern recognition is a multi-disciplinary subject covering the following fields: statistics, engineering, artificial intelligence, computer science, psychology and physiology, etc. [4]. They posited that computer-based automated pattern recognition systems are required when: (a) the human senses fail to recognize patterns, (b) there is need to automate and speed up the recognition process. And considering the volume of data generated by businesses and companies these days, it is obvious that pattern recognition is inevitable in exploring the data for information buried in the data. For instance, people measure things like blood pressure, annual rainfall, value of stock, etc., and as such time series occur in virtually every medical, scientific and business domain. Time series reveals the temporal behaviour of the underlying mechanism that produced the data.
However, as the amount of data generated by business houses increases, there is therefore the need to explore new ideas and algorithms to analyse it to gather information necessary for decision making and predictions. The type of time series data considered in this paper are mostly those that can generate forecasts, such as stock closing price. Based on the foregoing, this research paper, propose a new and novel pattern recognition algorithm/model to (a) efficiently represent time series dataset, and (b) detect and extract patterns of interest buried in time series datasets. Time series datasets collected via yahoo finance website from different sources were used to test and validate the model.
Literature Review
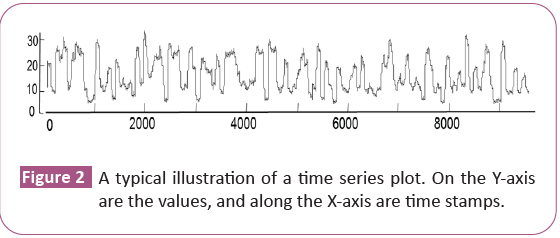
Time series according to Nguyen and Duong is a sequence of real numbers, each number representing a value at a time point. It is a collection of observations made sequentially in time. A time series is an ordered sequence of values of a variable (univariate) or many variables (multivariate) measured, observed or calculated at equally spaced time intervals over a period of time. It consists of a sequence of values and their corresponding timestamps (i.e. the time at which the values were observed or measured). Illustrates a typical plot of a time series dataset (Figure 2).
Time series abstraction is concerned with finding a suitable way to represent time series for further computational analysis. The process creates a more compact representation of the time series, while at the same time preserving the information content of the original time series. Thus, one of the cardinal objectives of time series representation is to find a lower dimensionality that preserves the fundamental characteristics of the original data. Again, good representation will foster further time series analysis towards discovering patterns and making informed decisions.
A good number of representation and dimension reduction techniques have been proposed in the literature for representing and summarizing time series data. Among them is the symbolic representation approach, which constitutes a simple way of reducing the dimensionality of the time series data by turning it into sequences of symbols. Once a time series is available in a string symbolic form, string analysis techniques can be used to analyses the data faster and efficiently. Time series representation techniques already developed include, but not limited to the work [5,6]. These are discrete Fourier Transformation (DFT), Piecewise Aggregate Approximation (PAA), and Adaptive Piecewise Constant Approximation (APCA), Symbolic Aggregate approximation (SAX), Index able Piecewise Linear Approximation, Independent Component Analysis (ICA), Principal Component Analysis (PCA), Piecewise Linear Approximation (PLA), Discrete Wavelet Transformation (DWT), Single Value Decomposition (SVD), and Discrete Cosine Transformation.
Singh addressed the problem of time series representation by creating an algorithm called binary representation, in which “1” was used to represent increase and “0” was used to represent decrease. It partially solved the problem of time series representation by transforming it into strings of ones and zeros for further processing. It did not however address the issue of patterns in time series. What about a situation where there exists consecutive increases or decreases? The model was silent on that.
Álvaro proposed a clustering approach to find patterns in electricity time series. He applied K-means, Expectation Maximization (EM) and Fuzzy C-Means (FCM) clustering techniques to find patterns in stock market data and electricity pricing data [7]. The model proposed can be used to forecast a stock market and electricity pricing time series as recorded in the study. The approach did not delve into the use of large historical data to find patterns necessary for pattern extraction and prediction. No definite means of extracting patterns from a historical database.
Jangling developed a novel time series segmentation method that was based on turning points to extract trends from the maximum or minimum points of the time series [8]. It was a very solid and useful idea for detecting patterns in a time series. It segmented time series into up and down structure that minimized destruction of the original underlying trends in the dataset. It did not address the issue of how to symbolically (or otherwise) represent the time series or the discovered trends.
Prasanna and Ezhilmaran performed analysis of past and present financial data to generate patterns and decision making algorithms using artificial intelligence and data mining techniques. The study was able to establish that data mining can be applied in evaluating past stock prices and acquire valuable information. The weakness of the study was inability to define the type of patterns that can be generated and how to represent them [9].
Badhiye addressed time series representation to facilitate data mining of large time series databases. The method used symbolic piecewise trend approximation to represent the original dataset. It achieved dimensional reduction, and was able to symbolically represent time series dataset. The shortcoming of the approach was classification of trend into two: up and down only. It ignored the existence of flat trend, and lacked the ability to predict future trend [10].
Nguyen and Duong proposed the use of Piecewise Linear Approximation (PLA) to segment time series, as a preprocessing approach necessary for further analysis [11]. The approach represents a time series with straight lines. PLA refers to the approximation of a time series T, of length n with k straight lines (where k<n) The PLA is composed of a series of segments representing the trend (up and down) of the raw data. Thus, PLA approximates a time series into a representation of linear segments that is efficient to manipulate and faster to process than the raw data. The linear segments can be visualized in an identical way to the original data in a time series plot, while the number of data points is significantly reduced without losing the intrinsic nature of the underlying activity.
The algorithms for implementing piecewise linear approximation are sliding window, bottom-up and top-down. Applications of PLA include pattern matching and prediction of trading points in the stock market [12,13]. One of the problems of the three basic PLA approaches (sliding window, bottom up and top down) is the design of a stopping condition (usually denoted as a user-defined threshold value) as each of them heavily depend on the threshold to stop.
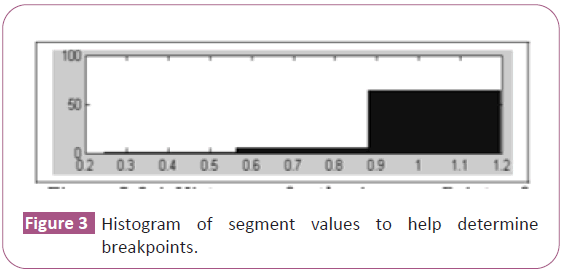
Keogh Eamonn and Jessica Lin invented SAX. SAX stands for Symbolic Aggregate Approximation. It was the first, and a novel symbolic representation for a time series [14]. SAX is a symbolization method that involves placing a symbol for each segment obtained by using PAA, since it is based on the Piecewise Aggregate Approximation (PAA) representation. The PAA representation is merely an intermediate step required to obtain SAX. SAX is a process that maps the PAA representation of a time series into a sequence of discrete symbols. In other words, SAX uses alphabet symbols (a-z) to represent segments obtained through PAA. In order to place the symbols, it is essential to specify the number of symbols to be used and the intervals (or breakpoints) of the values for each symbol. To this end, Burcu, stated that the number of symbols to be used is generally determined by an expert having knowledge about the application domain under study. However, to help solve the problem of specifying the intervals (breakpoints) for each symbol, Burcu suggested the use of histograms of the data values as shown in Figure 3 [15].
Another way to surmount the problem of determining breakpoints is to make use of the predefined statistical table. Table 1 shows a typical predefined lookup statistical table for 3 to 10 alphabets. Table 1: Lookup table from a pre-defined statistical table that contains the breakpoints (β1-β9) for alphabet size a=3 to 10 that divides a Gaussian distribution into an arbitrary number.
| βi/a | 3 | 4 | 5 | 6 | 7 | 8 | 9 | 10 |
|---|---|---|---|---|---|---|---|---|
| β1 | -0.43 | 0.67 | -0.84 | 0.97 | -1.07 | -1.15 | -1.22 | -1.28 |
| β2 | 0.43 | 0 | -0.25 | -0.43 | -0.57 | -0.67 | -0.76 | -0.84 |
| β3 | 0.67 | 0.25 | 0 | -0.18 | -0.32 | -0.43 | -0.52 | |
| β4 | 0.84 | 0.43 | 0.18 | 0 | -0.14 | -0.25 | ||
| β5 | 0.97 | 0.57 | 0.32 | 0.14 | 0 | |||
| β6 | 1.07 | 0.67 | 0.43 | 0.25 | ||||
| β7 | 1.15 | 0.76 | 0.52 | |||||
| β8 | 1.22 | 0.84 | ||||||
| β9 | 1.28 |
Table 1: Lookup table from a pre-defined statistical table that contains the breakpoints (β1-β9) for alphabet size a=3 to 10 that divides a Gaussian distribution into an arbitrary number.
Another attribute of SAX, in addition to the use of PAA technique, is normalization in order to transform the series to a Gaussian distribution so that the breakpoints can be determined from the curve in accordance with the required alphabet size. SAX has also the potential for dimensionality reduction. Thus, it can reduce a time series of arbitrary length n to a symbolic string of arbitrary length w (w<n), with the string composed of z different symbols z>2 [16,17].
System methodology
This work approached the issue of pattern recognition and representation of time series from the data mining perspective, rather than from the statistical point of view. This is because; statistical tools will not suffice for large time series datasets analysis as it concerns pattern identification. As a result, the pattern recognition approach applied was an unsupervised learning since there was no prior labeling or classes of patterns unto which new patterns can be mapped to. However, to facilitate the task of pattern recognition, patterns were defined as either Up, Down or Flat, with fixed lengths of either 3, 5 or 10 data points (days with their respective timestamps) [18].
The algorithm begins with a historical time series dataset which it receives as input. Prior to that, the dataset should have been preprocessed by removing blank cells of data and transforming (normalization process) the dataset into the range [0,1], such that the highest value is 1 and the least value in the series is 0. After this normalization process, the pattern recognition algorithm can be applied to the resulting dataset to fish out patterns of interest and thus represent them with symbols. All patterns identified were symbolized and stored in a database for future uses and manipulation. Object-Oriented Analysis and Design Methodology (OOADM) and prototyping methodology were used to design the system; while PHP, MYSQL, HTML and CSS were used to develop the system. The system was well tested and the outputs were excellent [19,20].
System design and implementation
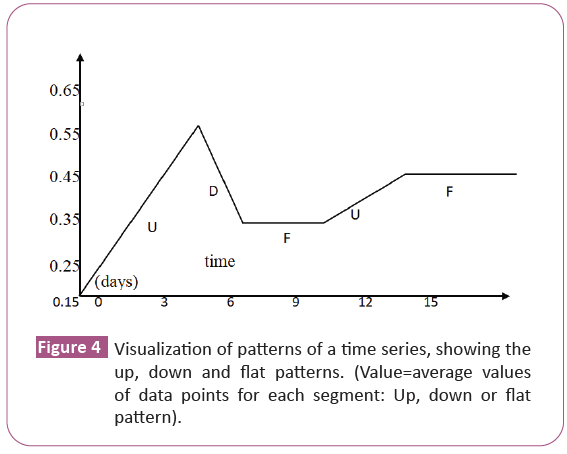
The proposed pattern recognition and representation algorithm: In this work, we propose an algorithm for pattern detection, extraction and representation (using symbols). For ease of identification of patterns, extraction and representation, we pre- defined patterns as either Up (U),
Down (D) or Flat (F). Each pattern represents a segment, and can be drawn as shown (Figure 4).
The symbolic representation of the time series as shown. Therefore, a time series of length 25 (data points) has been reduced to a string of UDFUF (which is five characters).
The algorithm for pattern identification, extraction and symbolic representation is hereby presented [21].
Input: S, Segment size
Output: Pattern string symbols (for Up, Down and Flat patterns)
Repeat
Initialize tup=tdn=0;
For (i=0; i ≤ Segment_size-1, i ++) {
df=(i+1)-i;
if df is positive, tup++ //augment increasing pattern variable
if df is negative, tdn++ //augment decreasing pattern variable
If tup=Segment_size-1 or tdn=Segment_size-1 then, pattern is Up or Down respectively
otherwise pattern is Flat.
Calculate segment average; //Call SegmentAvg () function
Store segment MinDate, MinValue MaxDate, MaxValue, Segment_Symbol (U,D,F), SegmentAvg
Until end of S is reached.
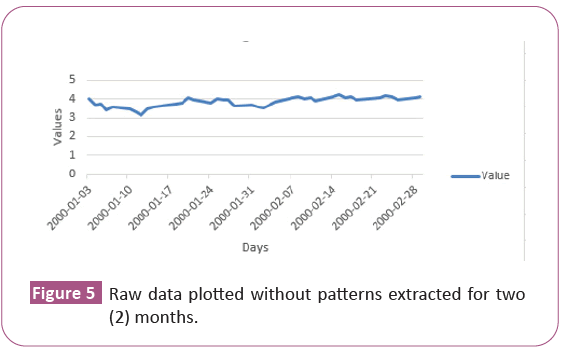
System implementation: The model cum algorithm was tested with real-valued discrete univariate time series data, mostly stock market data, obtained online from Yahoo website. The algorithm achieved 100% success in detecting and symbolizing the three types of pre-defined patterns and equally symbolized them. Table 2 presents some of the outputs from the system (Figure 5a).
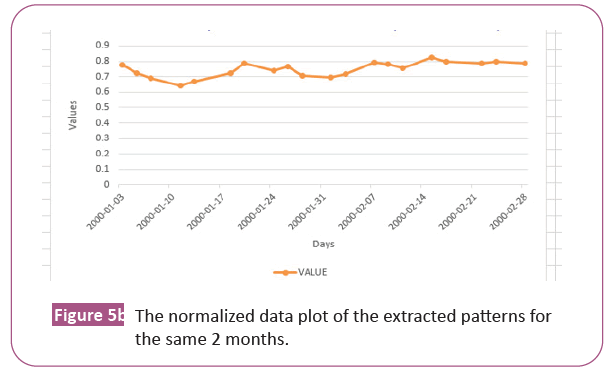
Again, It shows the normalized plot of the extracted patterns for the same two (2) months Figure 5b [22].
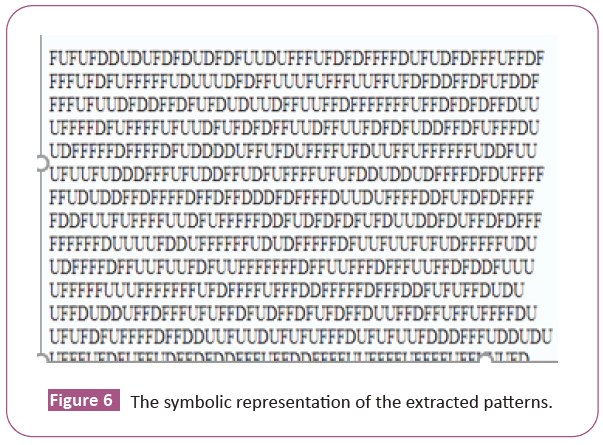
Figure 6 shows then symbolic representation of the extracted patterns.
DD means consecutive down patterns, likewise FFF or UU. With the patterns symbolically represented, further programming work can be done to compare time series of similar months of several years to find out areas of similarity.
Results and Discussion
Table 2 presented a portion of the historical dataset, which has 5158 records (data points). The table showed both the raw and normalized values and their timestamps (date and year).
| Record no | Date | value | Normalised value | year |
|---|---|---|---|---|
| 1 | 03-01-2000 | 11357.5097656250 | 0.8104355931 | 2000 |
| 2 | 04-01-2000 | 10997.9296975000 | 0.6239265800 | 2000 |
| 3 | 05-01-2000 | 11122.6503906250 | 0.6886174083 | 2000 |
| 4 | 06-01-2000 | 11253.2597656250 | 0.7563626170 | 2000 |
| 5 | 07-01-2000 | 11522.5595703125 | 0.8960445523 | 2000 |
| 6 | 10-01-2000 | 11572.2001953125 | 0.9217924486 | 2000 |
| 7 | 11-01-2000 | 11511.0800781870 | 0.8900903463 | 2000 |
| 8 | 12-01-2000 | 11511.09960.93750 | 0.9108479023 | 2000 |
| 9 | 13-01-2000 | 11582.4296875000 | 0.9270983348 | 2000 |
| 10 | 14-01-2000 | 11722.9804687500 | 1.0000000000 | 2000 |
| 11 | 18-01-2000 | 11560.7197265625 | 0.9158377051 | 2000 |
| 12 | 19-01-2000 | 11489.3603515625 | 0.8788245926 | 2000 |
| 13 | 20-01-2000 | 11351.3008016975 | 0.8072146187 | 2000 |
Table 2: Sample raw and normalized time series data.
As already noted, that presented the raw data plotted without pattern extracted for the two (2) months; while that presented the normalized data of the extracted patterns for the same two months. In comparing both, the patterns in Figure 5b looked straight lines in Up, Down and Flat positions. Furthermore, that conspicuously showed patterns in the series, unlike in Figure 5a which showed everything as a curve with no indication of where there is an occurrence of patterns.
Again in Figure 6, DD means consecutive down patterns, likewise FFF or UU. And with the patterns symbolically represented, further programming work can be done to compare time series of similar months of several years to find out areas of similarity.
Conclusion
Time series analysis cuts across the following activities: time series representation, pattern recognition, similarity search and prediction. This work explored development of time series representation and pattern recognition algorithms from the data mining perspective, and successfully developed an algorithm to mine time series datasets for patterns and also represented the patterns using symbols (U, D, F) for Up, Down and Flat respectively. Our algorithm is very efficient, easy to understand and implement towards finding patterns in a time series. Researchers in time series analysis from different perspectives like statistics, economics and data mining will benefit immensely from the contributions of this work. Further research can be carried out to incorporate prediction ability into the algorithm.
References
- Abdullah M, Suman N and Jie L (2016) Similarity search on TS data: Past, present and future. CIKM2016 Tutorial.
- Pohl D, Bouchachia A (2013) Financial time series processing: A roadmap of online and offline methods. In Business Intelligence and Performance Management 5: 145-162
- Bishop CM (2006) Pattern recognition machine learning. 128.
- Ding H, Raj MP, Swaminarayan PR, Saini JR, Parmar DK (2015) Applications of pattern recognition algorithms in agriculture: A review. Int J Adv Net Appl 6: 2490-2495.
- Ding H, Trajcevski G, Scheuermann P, Wang X, Keogh E (2008) Querying and mining of time series data: Experimental comparison of representations and distance measures. Proceedings of the VLDB Endowment 1: 1542-1552.
- Dan J, Shi W, Dong F, Hirota K (2013) Piecewise trend approximation: A ratio-based time series representation. In Abstract and Applied Analysis Hindawi
- Martínez-Álvarez F (2010) Pattern Sequence Analysis to Forecast Time Series (doctoral dissertation, universidad pablo de olavide).
- Yin J, Si YW, Gong Z (2011) Financial Time Series Segmentation based on Turning Points. In proceedings- International Conference on System Science and Engineering 394-399.
- Prasanna S, Ezhilmaran D (2013) An analysis on stock market prediction using data mining techniques. Int J Comput Sci Eng Tech 4: 49-51.
- Badhiye SS, Hatwar KS, Chatur PN (2015) Trend based approach for time series representation. Intern J of Comp Appl 113: 10-30..
- Hung NQ, Anh DT (2007) Combining Sax and Piecewise Linear Approximation to Improve Similarity Search on Financial Time Series. International Symposium on Information Technology Convergence 58-62.
- Zhang Z, Jiang J, Liu X, Lau WC, Wang H et al. (2010) Pattern Recognition in Stock Data Based on A New Segmentation Algorithm. In International Conference on Knowledge Science, Engineering and Management 4: 520-525.
- Wu H, Salzberg B, Zhang D (2004) Online Event-Driven Subsequence Matching Over Financial Data Streams. In proceedings ACM SIGMOD International Conference on Management of Data 9: 23-34
- Keogh E, Chu S, Hart Lonardi JL, Patel P (2002) Finding Motifs in Time Series. In Proc. of the 2nd Workshop on Temporal Data Mining 53-68.
- Kulahcioglu B, Ozdemir S, Kumova B (2008) Application of Symbolic Piecewise Aggregate Approximation (PAA) Analysis to ECG signals. In 17th IASTED International Conference on Applied Simulation and Modelling.
- Ding H, Trajcevski G, Scheuermann SS (2000) Pattern Modelling in Time-Series Forecasting. Cybernetics and Systems. An International Journal 31: 224-234
- Lonardi JL, Patel P (2002) Finding Motifs in Time Series. In Proc. of the 2nd Workshop on Temporal Data Mining 53-68.
- Han J, Kamber M (2001) Data Mining Concepts and Techniques. San Francisco: Morgan Kaufman
- Keogh E (2010) Data Mining Time Series Data, in Lovrić (Ed.), International Encyclopaedia of Statistical Science. New York, USA: Springer
- Keogh E (2007) Mining shape and time series databases with symbolic representations. In Proceedings of the 13th ACM SIGKDD International Conference on Knowledge Discovery and Data Mining 1-1.
- Keogh E, Chakrabarti K, Pazzani M, Mehrotra S (2001) Locally Adaptive Dimensionality Reduction for Indexing Large Time Series Databases. In Proceedings of the 2001 ACM SIGMOD International Conference on Management of Data 151-162.
- Keogh E, Chu S, Hart D, Pazzani M (2001) An Online Algorithm for Segmenting Time Series. In Proceedings 2001 IEEE International Conference on Data Mining. 289-296

Open Access Journals
- Aquaculture & Veterinary Science
- Chemistry & Chemical Sciences
- Clinical Sciences
- Engineering
- General Science
- Genetics & Molecular Biology
- Health Care & Nursing
- Immunology & Microbiology
- Materials Science
- Mathematics & Physics
- Medical Sciences
- Neurology & Psychiatry
- Oncology & Cancer Science
- Pharmaceutical Sciences
