Development and Validation of a Residue Analysis Method for Pymetrozine Analysis in Different Rice Matrices
Devaki Kayam1*, Kiran Kumar K1, Paramasiva I1, Sreelakshmi CH1, Harathi PN1, Venkateswarlu U1 and Vandana Tripathy2
1Department of Entomology, Acharya NG Ranga Agricultural University, Guntur, India
2Department of Agricultural, IARI-Indian Agricultural Research Institute, New Delhi, India
- *Corresponding Author:
- Devaki Kayam
Department of Entomology, Acharya NG Ranga Agricultural University, Guntur, India
Tel: 8985700447
E-mail: k.devaki@angrau.ac.in
Received date: April 26, 2023, Manuscript No. IPFST-23-16512; Editor assigned date: May 01, 2023, PreQC No. IPFST-23-16512 (PQ); Reviewed date: May 16, 2023, QC No. IPFST-23-16512; Revised date: June 27, 2023, Manuscript No. IPFST-23-16512 (R); Published date: July 05, 2023, DOI: 10.36648/IPFST.7.01.001
Citation: Kayam D, KiranKumar K, Paramasiva I, Sreelakshmi CH, Harathi PN, et al. (2023) Development and Validation of a Residue Analysis Method for Pymetrozine Analysis in Different Rice Matrices. J Food Sci Toxicol Vol:7 No:1
Abstract
Ultra HPLC based analytical method was developed for the analysis of pymetrozine residues in different rice matrices. The samples were extracted using QuEChERS method with slight modifications. The retention time for pymetrozine was arrived at 4.00 min ± 0.5 min. Calibration for pymetrozine pure standard was y=2E+07x+191888 with R^2=0.99. Matrix match calibrations were made with a series of concentrations. The harvest time residue for the different rice matrices was below tolerance limit of pymetrozine. The at 7, 15 and 30 days after rice harvest in paddy seed, single polished, double polished rice, bran, dehulled rice were not detected. From the developed analytical method, the residue analysis of pymetrozine can be detected in different rice matrices.
Keywords
Ultra HPLC method; Rice; Pymetrozine residues; Method development and validation
Introduction
Pymetrozine, 4,5-dihydro-6-methyl-4-[(3-pyridylmethylene)-amino]-1,2,4-triazin-3 (2H)-one (Figure 1), is a novel insecticide with effects on neuroregulation or nerve muscle interaction against sucking insects by preventing these ones from inserting their stylus into the plant tissue. Pymetrozine has been widely used in rice against plant hoppers as a substitution of highly toxic organophosphate pesticides [1]. Though pymetrozine is registered for use in various crops and vegetables because of the broad spectrum activity, the EPA has considered that pymetrozine is a “likely” human carcinogen and is slightly to moderately toxic to aquatic invertebrates. Therefore, pymetrozine residues may lead to potential health injury. Several analysis methods have been developed for qualitative and quantitative analysis of pymetrozine residues in different matrices, such as Differential Pulse Polarographic method (DPP), Liquid Chromatography (LC) with UV/Visible, Diode Array Detection (DAD) and Mass Spectrometry (MS); however, the fast and efficient method is LC with Mass Spectrometry (MS) [2].
The studies pertaining to harvest time residues of pymetrozine in different rice matrices are limited. A simple, sensitive and selective method with Ultra High Performance Liquid Chromatography (UHPLC) for quantification of pymetrozine in different rice matrices viz., rice grain, single and double polished rice, rice bran was developed to study the dissipation behavior and final residue of pymetrozine in rice [3]. The present investigations were carried out at pesticide residue testing laboratory, RARS, Tirupati during 2022-2023.

Figure 1: Chemical structures of pymetrozine and its inactive phenyl analogue.
Materials and Methods
Sample collection and processing
Rice crop was grown in a bulk plot of 50 m² as per the standard agronomic practices of ANGRAU during post rainy season during 2022-2023 and kept unsprayed. One week before harvest pymetrozine 50 WP was sprayed. Approximately 2 kg samples were collected at the time of harvest, 7, 15, 30 days after harvest. Samples were processed at ARS, Nellore for dehull rice, single polished rice, double polished rice, bran from single and double polished rice and brought to pesticide residue laboratory, IFT, RARS, Tirupati.
Chemicals and reagents
Technical grade standard of pymetrozine (purity: 99.8%, make: Sigma-Aldrich), HPLC grade methanol, n-Hexane and water Merck make, quenchers extraction salts like sodium sulphate anhydrous, sodium acetate, magnesium sulfate anhydrous were purchased from local vendors. Primary secondary amine also obtained Sigma Aldrich make [4]. Formulation of pymetrozine (50 WG) for field experiment was purchased from a local agricultural pesticides market.
Instrument
Ultra High Performance Liquid Chromatography (UHPLC) Shimadzu make, with SPD-M20A, PDA detector. Deuterium (D2) and tungsten (W) lamp, can read a wavelength of 190 to 800 nm was used for analysis.
Instrumentation
Chromatography was performed in a Shimadzu make ultra HPLC system equipped with photo diode array detector. Chromatographic separation was achieved in column (XR-ODS II: 150 mm × 2.0 mm), the column oven temperature was set at 32.2°C [5]. The injection volume was 10 μl, the pump was LC-30AD which was set at low pressure gradient equipped with a flow rate of 0.8 μl/min. The mobile phase set with pump A: Water (60%), pump B: Methanol (40%) at a pump flow of 0.8 ml/min. The detector was Photo Diode Array (PDA) was in SP-DM20A mode consists of D2 (Deuterium) lamp. The conditions pertaining to LC conditions were presented in the Table 1.
| S. no. | Parameter | Conditions |
|---|---|---|
| 1 | Liquid chromatograph | Shimadzu |
| 2 | Pump | LC-30AD quaternary pump system |
| 3 | Pump mode | Low pressure gradient |
| 4 | Column | XR-ODS II: 150 mm × 2.0 mm, 5 µm |
| 5 | Pressure | 136 kgfm |
| 6 | Oven temperature | 32.2°C |
| 7 | Injection volume and interval | 10 µl in in 10 min |
| 8 | Total flow | 0.8 ml/min |
| 9 | Mobile phase | Pump A-water (60%) |
| Pump B-methanol (40%) | ||
| 10 | Wave length | 272 nm |
| 11 | Detector | Photo Diode Array (PDA) |
| 12 | Detector mode | SPD-M30A |
| 13 | Lamp | D2 (Deuterium) |
| 14 | Total run time | 10.0 min |
| 15 | Retention time | 3.80 min |
Table 1: Details of the UHPLC-PDA operational parameters.
Preparation of solvents for HPLC
HPLC grade methanol and water were filtered and sonicated to avoid air bubbles, set to mobile phase in the ratio of 60 and 40 for analyzing the pymetrozine pure standards, pymetrozine fortified rice samples and field collected samples [6].
Preparation of standard solution
Approximately 10 ± 0.01 mg of pymetrozine standard was weighed into a 10 ml standard flask and diluted with methanol for preparing stock solution of 1000 μg/ml. The standard solution was further diluted to 100 μg/ml, 10 μg/ml.
The standard solution was diluted into different concentration gradients. Linear concentrations of 0.01, 0.05, 0.10, 0.25, 0.50, 0.75 and 1.00 μg/ml were prepared for drawing the standard curve, the quality concentration was horizontal coordinates and the peak area was vertical coordinates, so as to obtain a series of linear regression equations in different rice matrices were determined, the correlation coefficient was calculated for goodness of the methodology [7,8].
Method development and validation
The suitability of the instrument for analyzing the pymetrozine was tested by injecting the pure standard at various concentrations and methanol as blank in the methanol water solvent system. The following parameters were validated in method development (based on the external standard method).
• Retention time.
• Linearity and range.
• Limit of Detection (LOD) and Limit of Quantification (LOQ).
• Accuracy and precision.
• Recovery.
Retention time
Retention time is the primary means for chromatographic peak identification. Predicting chromatographic retention times of pesticides has become more and more important for suspect and non-target screening. Pymetrozine was analyzed in reverse phase XR-ODS II column measured about 150 mm × 2.0 mm, 5 μm for separation [9]. Retention time for pymetrozine was analyzed in different combinations of methanol and HPLC water. Pymetrozine standard was run in the solvent system of 40:60 methanol and water in comparison with methanol blanks. Retention time for other concentrations of pymetrozine (0.01, 0.05, 0.1, 0.25, 0.50, 0.75 and 1.00 μg/ml also studied in replicates).
Selectivity of the method
The selectivity of the method was evaluated by injecting extracts of the blank rice matrices and methanol followed by comparison of the chromatograms obtained with extracts of the rice matrices fortified with the analytes [10]. The signal absence in the chromatograms for the blank samples in the retention times of all the concentration of analytes studied, confirmed the selectivity of the method.
Linearity, range and calibration
It is very essential to calibrate instrument for obtaining accurate results. Linearity of an analytical procedure is its ability to obtain test results within a given range that are directly proportional to the concentration of an analyte in the sample. It is evaluated by linear regression analysis of the plot of signals as a function of analyte concentration with a minimum of five linear concentrations. The correlation coefficient and slope of regression line should be satisfactory.
Stock solution of pymetrozine (1000 μg/ml) pipetted out, linear concentrations of 0.01, 0.05, 0.1, 0.25, 0.50, 0.75 and 1.00 ppm were prepared and injected to the ultra HPLC instrument in three replications. The peak areas were measured and tabulated. The detector response in terms of peak areas by standard solutions of pymetrozine (0.1 to 1 μg /ml in mobile phase) were measured.
Matrix-match calibration
Rice matrices a sample without pymetrozine was extracted in the same procedure adopted for other samples. After extraction the pymetrozine was added at different concentrations i.e., 0.01, 0.05, 0.10, 0.25, 0.50, 0.75 and 1.00 ppm for constructing calibration and goodness of fit. Linear calibration graphs were prepared and goodness of fit was studied.
Limit of Detection (LOD) and Limit of Quantification (LOQ)
Limit of detection for pymetrozine was considered to be the concentration that produced an S/N ratio of 3:1 and the LOQ was defined on an S/N ratio of 10:1. These values were estimated from the chromatogram corresponding to the lowest concentration that could produce a response of 3:1 from different concentrations injected. Precision was arrived by injecting the pymetrozine 0.50 ppm concentration in six replicates.
Trueness and precision
The trueness was determined from the recovery assay results of samples spiked with the analytes at 0.05 and 0.10 mgkg-1 (n=3 replicates per level) along with blank samples. Repeatability, expressed as Relative Standard Deviation (RSD), which was evaluated through the data from replicated samples analyzed at same day for each level [11]. The intermediate precision, expressed as Relative Standard Deviation (RSD), was evaluated through the replicated data in the three different days for each level.
Recovery study: The reliability of the analytical method chosen and the efficiency of extraction and clean up procedures were verified by carrying out recovery experiments in the laboratory. To 10 g rice samples like paddy seed, dehulled rice, single polished, double polished rice, single polished bran, double polished bran 0.05, 0.10 and 0.50 mg kg-1 of analytical pymetrozine solutions were added, mixed thoroughly, and kept for 30 minutes. The pymetrozine residues in the fortified samples were then extracted, cleaned up and estimated by the same method as per samples. A sample without insecticide fortification and a blank sample (methanol) was maintained as untreated control for comparison.
Extraction of pymetrozine from rice matrices
Extraction: The samples were extracted for pymetrozine as per Quick, Easy, Cheap, Effective, Rugged and Safe (QuEChERS) method with slight modifications. The samples were course grinded and weighed approximately 10 ± 0.1 g of rice sample (dehulled rice, single polished, double polished rice and bran, paddy seed) into a 50 ml centrifuge tubes and added 10 ml of ice cold distilled water and vortexed. The known concentration of pymetrozine at 0.05, 0.10 and 0.50 mg/kg was added to each sample on weight/volume basis. The samples were vortexed for mixing of the pymetrozine in the matrix and added 20 ml methanol, capped well and shaken for thorough mixing.
The samples were homogenized using silent crusher at 14000 to 15000 rpm for 2-3 min, added 3 ± 0.1 g sodium chloride and vortexed for a minute and centrifuged the contents at 2500-3000 rpm for min to separate the organic layer and approximately 12 ml of supernatant was transferred to a test tube and added 5.0 ± 0.1 g anhydrous sodium sulfate to remove the moisture content.
Dispersive solid phase clean-up
Weighed 0.20 ± 0.01 g PSA sorbent and 0.60 ± 0.01 g anhydrous magnesium sulfate in 15 ml centrifuge tube and 9 ml of upper organic layer from anhydrous sodium sulfate treated test tube was transferred. The contents were vortexed, centrifuged at 2500-3000 rpm for 5 min and upper 1 ml layer was filter through PTFE (0.22 μm) syringe filter to HPLC vial for analysis.
Recovery studies
The rice matrices viz., rice grain with husk, dehulled rice, single polished rice, double polished rice, rice bran from single and double polished rice were spiked with pymetrozine at various concentrations 0.01, 0.05 and 0.10 ppm. The extraction and clean-up was done in the same manner the sample extraction was done.
Sample analysis and calculation of residues from rice matrices
Residue was calculated by the following formula:
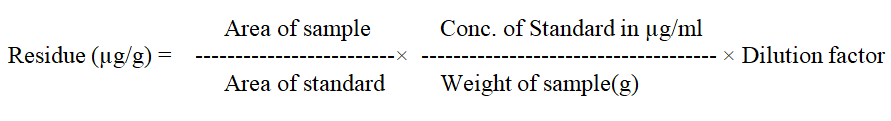
After analysis, pymetrozine residues have been calculated and expressed in mg kg-1. The results were presented in Table 4.
Results
Retention time
Retention time for pymetrozine was analyzed in different combinations of methanol and HPLC water. The retention time of 3.80 min for 1.0 ppm pymetrozine was obtained in a solvent system of 40:60 methanol and water. Retention time for other concentrations of pymetrozine i.e., 0.01, 0.05, 0.1, 0.25, 0.50, 0.75 ppm also at 3.80 ± 0.5 min (Figure 2).

Figure 2: Determination of retention time.
Linearity and range
Seven concentrations of pymetrozine i.e., 0.01, 0.05, 0.1, 0.25, 0.50, 0.75 and 1.00 ppm were prepared and injected to the ultra HPLC instrument in three replications. The peak areas were measured and tabulated. The detector responses in terms of peak areas by standard solutions of pymetrozine (0.1 to 1 μg/ml in mobile phase) were measured. There was a good correlation between the concentrations of pymetrozine injected and resultant chromatogram obtained. The regression equation obtained was y=2E+07x+191888 with goodness of fit (R2) of 0.996. Similarly, the matrix match calibration for rice matrices also studied for the linearity and found the R2 of more than 98 per cent for the six rice matrices (Figure 3).

Figure 3: Linearity studies of pymetrozine.
Limit of Detection (LOD) and Limit of Quantification (LOQ)
There was progressive increase in the chromatogram area with increasing concentrations for pymetrozine standard. A signal noise ratio at 3 is considered for Limit of Detection (LOD) and 10 for limit of quantification. For pymetrozine a S/N of 3 was observed at 0.01 ppm and 0.10 ppm.
Matrix match calibration of pymetrozine in different rice matrix
Calibration studies pertaining to pymetrozine neat standard and matrix match calibrations presented in the Table 2. The regression equation for neat pymetrozine standard at the concentrations of 0.01, 0.05, 0.10, 0.25, 0.50, 0.75, 0.10 is y=2E+07x+191888 with R²=0.996. Similarly, matrix match calibration of various rice matrixes was calculated for the suitability of the method for pymetrozine analysis in rice (Figures 4-9).
| Particulars | Regression equation | R² |
|---|---|---|
| Pymetrozine standard | y=2E+07x+191888 | R²=0.996 |
| DPR matrix | y=1E+06x+22238 | R²=0.996 |
| SPR matrix | y=1E+06x-1158.7 | R²=0.986 |
| Dehulled rice | y=2E+06x-18647 | R²=0.998 |
| Rice husk matrix | y=818703x+14899 | R²=0.995 |
| DPB | y=2E+06x-7148.7 | R²=1.000 |
| SPB | y=2E+06x+20959 | R²=0.988 |
Table 2: Matrix match calibration of pymetrozine in different rice matrix.

Figure 4: DPR matrix of match calibration of pymetrozine.

Figure 5: SPR matrix of match calibration of pymetrozine.

Figure 6: Dehulled rice of match calibration of pymetrozine.

Figure 7: The figure shows rice husk matrix.

Figure 8: The figure shows DPB matrix.

Figure 9: The figure shows SPB matrix.
Recovery
The recovery study for pymetrozine was studied at 0.05 ppm spiked concentration. The recovery of pymetrozine in different rice matrices indicated that, a recovery in the range of 70-120 per cent was observed. In dehulled rice, single polished rice, double polished rice it was 99.99, 101.36 and 96.73 per cent, respectively. In single polished bran, double polished bran it was 77.72 and 106.90 per cent and in rice grain it was 111.93 percent (Table 3).
| Commodity | Recovery at 0.05 ppm | |||||
|---|---|---|---|---|---|---|
| R1 | R2 | R3 | Mean | SD | ||
| Dehusked rice | ppm | 0.06 | 0.047 | 0.044 | 0.05 | 0.009 |
| % | 119.55 | 93.31 | 87.13 | 99.99 | 17.21 | |
| SPR | ppm | 0.058 | 0.047 | 0.047 | 0.051 | 0.006 |
| % | 116.03 | 93.87 | 94.18 | 101.36 | 12.71 | |
| DPR | ppm | 0.05 | 0.05 | 0.045 | 0.048 | 0.003 |
| % | 100.09 | 100.31 | 89.8 | 96.73 | 6 | |
| SPB | ppm | 0.086 | 0.072 | 0.075 | 0.078 | 0.008 |
| % | 86.37 | 71.76 | 75.04 | 77.72 | 7.67 | |
| DPB | ppm | 0.051 | 0.049 | 0.06 | 0.053 | 0.005 |
| % | 102.42 | 98.99 | 119.29 | 106.9 | 10.87 | |
| Paddy | ppm | 0.056 | 0.056 | 0.056 | 0.056 | 0 |
| % | 112.34 | 111.41 | 112.05 | 111.93 | 0.47 | |
Table 3: Recovery of pymetrozine in different rice matrices.
Residues of pymetrozine
The developed ultra HPLC method after validation was applied for testing the residues of pymetrozine in various rice matrices. The residues of pymetrozine at harvest of paddy crop in different matrices including rice grain with husk, dehulled rice, single polished rice, double polished rice, rice bran was below tolerance limit at harvest and it was below detectable level in all the test matrices at 7, 15, 30 days after storage (Table 4).
| Treatment | Day of harvest | 7 days after harvest | 15 days after harvest | 30 days after harvest |
|---|---|---|---|---|
| Double polished rice | Below LOQ | ND | ND | ND |
| Single polished rice | Below LOQ | ND | ND | ND |
| Dehulled rice | Below LOQ | ND | ND | ND |
| Rice with husk | Below LOQ | ND | ND | ND |
| Bran | Below LOQ | ND | ND | ND |
Table 4: Quantification of pymetrozine in rice at different intervals after harvest.
Discussion
In the present study, a method was developed for residue analysis of pymetrozine in ultra HPLC in a solvent system of methanol: water (40:60) at a flow rate of 0.8 ml. Being a polar pesticide, ultra HPLC was selected for pymetrozine. The method had good linearity (R²>0.996) for pure pymetrozine standard and also rice matrices fortified with pymetrozine. The RSD for pure pymetrozine concentrations was 0.04 to 1.97 and it was less than 20 per cent in different sample matrices of rice at the spiked concentrations [12]. The quenchers method of extraction is suitable and resulted in good recoveries of 77.82 to 111.93 percent in various rice matrices.
Similarly, a HPLC method for analyzing the residues and persistence of pymetrozine green tobacco leaves. The extraction was done in acetonitrile water and clean-up was done using SPE cartridges. Average recoveries were ranged from 97%-99% with RSDs below 2.1%. The limit of detection was 0.05 μg/ml.
Gong, et al. also developed a method for residue analysis of pymetrozine and its metabolites in Chinese kale in a simple determination method using liquid chromatography with tandem mass spectrometry. The developed method had good linearity (R²>0.99), accuracy (recoveries of 73.2%–94.1%) and precision (relative standard deviation of 2.5%–9.8%). Field results showed that half-lives of pymetrozine were 3.0–4.1 d in Chinese kale, and terminal residue concentrations were all below the United States environmental protection agency’s maximum residue limit (250 μg/kg) at harvest.
Muyesaier Tudi, et al., developed a liquid chromatography method for the residue analysis of pymetrozine in rice soils, rice fields. The results of the method performance showed that the recovery ranges for both two soils and water were between 70% and 120%, and the RSD was lower than 20% in this study, being within the accepted level for residue determination settled by document No. SANCO/12495/2011. The analytic methods for both of the red soil in Hunan and the loamy soil in Guangxi meet the requirement. The Limit of Detection (LOD) is the lowest concentration of analyte detectable by an analytical method and it was expressed in concentration units. The LOD calculated as a sample concentration was 0.1 μg/kg in soil and 0.1 μg/L in water, respectively.
Conclusion
In the present study, ultra HPLC based analytical method was developed for analyzing the residues of pymetrozine residues in different rice matrices. Chromatographic separation was done in XR-ODS II: 150 mm X 2.0 mm, 5 μm and chromatograms were detected in photo diode array detector. The samples were extracted using quenchers method with slight modifications. The retention time for pymetrozine was observed at 4.00 min ± 0.5 min. Calibration for pymetrozine pure standard was y=2E+07x+191888 with R^2=0.99. Matrix match calibrations were made with a series of concentrations. The results of the method performance showed that the recovery ranges for various rice matrices were between 70% and 120% and the RSD was lower than 20% in this study, being within the accepted level for residue determination settled by document no. SANTE/2019/12682. The developed analytical method is suitable for analyzing pymetrozine residues in different rice matrices. None of the rice matrices were found residues of pymetrozine after harvest.
References
- Lashkari MR, Sahragard A, Ghadamyari M (2007) Sublethal effects of imidacloprid and pymetrozine on population growth parameters of cabbage aphid, Brevicoryne brassicae on rapeseed, Brassica napus L. Insect Sci 14:207-212
- Li C, Yang T, Huangfu W, Wu Y (2011) Residues and dynamics of pymetrozine in rice field ecosystem. Chemosphere 82:901-904
[Crossref] [Google Scholar] [PubMed]
- Shen G, Hu X, Hu Y (2009) Kinetic study of the degradation of the insecticide pymetrozine in a vegetable-field ecosystem. J Hazard Mater 164:497-501
[Crossref] [Google Scholar] [PubMed]
- Zhang X, Cheng X, Wang C, Xi Z, Li Q (2007) Efficient high-performance liquid chromatography with liquid-liquid partition cleanup method for the determination of pymetrozine in tobacco. Ann Chim 97:295-301
[Crossref] [Google Scholar] [PubMed]
- Guan W, Li Z, Zhang H, Hong H, Rebeyev N, et al. (2003) Amine modified graphene as reversed-dispersive solid phase extraction materials combined with liquid chromatography-tandem mass spectrometry for pesticide multi-residue analysis in oil crops. J Chromatogr A 1286:1-8
[Crossref] [Google Scholar] [PubMed]
- Abd Al-Rahman SH, Almaz MM, Ahmed NS (2012) Dissipation of fungicides, insecticides, and acaricide in tomato using HPLC-DAD and quenchers methodology. Food Anal Methods 5:564-570
- Lehotay SJ, Son KA, Kwon H, Koesukwiwat U, Fu W, et al. (2010) Comparison of QuEChERS sample preparation methods for the analysis of pesticide residues in fruits and vegetables. J Chromatogr A 1217:2548-2560
- Mercan H, Yilmaz E, Inam R (2007) Determination of insecticide pymetrozine by differential pulse polarography/application to lake water and orange juice. J Hazard Mater 141:700-706
[Crossref] [Google Scholar] [PubMed]
- Lee SW, Choi JH, Cho SK, Yu HA, Abd El-Aty AM, et al. (2011) Development of a new quenchers method based on dry ice for the determination of 168 pesticides in paprika using tandem mass spectrometry. J Chromatogr A 1218:4366–4377
[Crossref] [Google Scholar] [PubMed]
- Gong J, Zheng K, Yang G, Zhao S, Zhang K, et al. (2019) Determination, residue analysis, risk assessment and processing factor of pymetrozine and its metabolites in Chinese kale under field conditions. Food Addit Contam Part A Chem Anal Control Expo Risk Assess 36:141-151
[Crossref] [Google Scholar] [PubMed]
- Shan J, Cheng X, Huang L, Chen X (2010) Solid phase extraction and HPLC analysis of pymetrozine residues in green tobacco leaves. Asian J Chem 22:2774-2782
- Tudi M, Atabila A, Ruan HD, Wang L, Lyu J, et al. (2022) Natural dynamics and residues of pymetrozine for typical rice-growing areas of China. Ecotoxicol Environ Saf 232:113230
[Crossref] [Google Scholar] [PubMed]

Open Access Journals
- Aquaculture & Veterinary Science
- Chemistry & Chemical Sciences
- Clinical Sciences
- Engineering
- General Science
- Genetics & Molecular Biology
- Health Care & Nursing
- Immunology & Microbiology
- Materials Science
- Mathematics & Physics
- Medical Sciences
- Neurology & Psychiatry
- Oncology & Cancer Science
- Pharmaceutical Sciences