ISSN : 2249 - 7412
Asian Journal of Plant Science & Research
Detection of some morpho enzyme traits under saline conditions in two bread wheat (Triticum aestivum L)
Waqas Manzoor Bhutta*
Department of Agriculture, University of Agriculture, Faisalabad, Punjab, Pakistan
- *Corresponding Author:
- Waqas Manzoor Bhutta
Department of Agriculture,
University of Agriculture,
Faisalabad, Punjab,
Pakistan
Tel: 9203226640593
E-mail: wmbhutta4055@yahoo.com
Received date: January 26, 2023, Manuscript No. AJPSKY-23-15714; Editor assigned date: January 30, 2023, PreQC No. AJPSKY-23-15714 (PQ); Reviewed date: February 13, 2023, QC No. AJPSKY-23-15714; Revised date: April 17, 2023, Manuscript No. AJPSKY-23-15714 (R); Published date: April 24, 2023, DOI: 10.36648/2249-7412.13.5.88
Citation: Bhutta WM (2023) Detection of some morpho enzyme traits under saline conditions in two bread wheat (Triticum aestivum L.). Asian J Plant Sci Res Vol:13 No:5:88.
Abstract
Soil salinity is a major constraint in agriculture particularly in food production because it limits crop yield and restricts the use of land previously untreated. Wheat is grown in arid and semi-arid regions of the world. Reduced shoot growth by salt stress was higher in salt sensitive genotypes in relation to resistance to salt alone. When both genotypes were subjected to salt stress (150 mM NaCl) significant changes in leaf area and the osmotic pressure was found. However, salt stress caused an increase in superoxide dismutase, catalase and peroxidase in both genotypes. These increases induced by salt more salt resistant genotypes. Peroxidase activity was reduced by salt stress in saltsensitive genotypes and increased salt tolerant genotypes. WMB-1 held maximum and minimum weight AS-2000 to take salinity compared to control. In addition, the relationship between the activity of superoxide dismutase and catalase enzymes were higher in salt tolerant genotypes. Thus, our results are consistent with hypothesis that the efficacy of antioxidant enzyme system WMB genotype 1 can be considered as one of the factors responsible for resistance to salt stress. It is assumed that the ratio of superoxide dismutase and catalase enzyme activity can be used as a working hypothesis for the biochemical markers of salt tolerance of wheat.
Keywords
NaCl stress; Wheat; Salinity tolerance; Solution culture; Hypothesis
Introduction
Wheat is grown on about 8.0 million hectares, more grain production at 18.2 million tons, but most of the wheat area suffers from salinity and sodicity, affecting field crops [1]. If wheat varieties capable of giving high yields from mild to moderate saline soil can be worked, productivity of these lands will be increased and it can also allow the expansion of agriculture into marginal lands. Thus, there is an urgent need to develop wheat varieties with improved ability to grow varieties with better ability to grow and produce grain in areas where wheat is grown inefficiently or not at all today. Pakistan occupies a total area of 80,5 × 10⁶ geographic haha 32,95 × 10⁶ considered suitable for cultivation, but only 20,36 × 10⁶ hectares currently cultivating [2]. The area 16,23 × 10⁶ hectares of irrigated canals and pipes are also other 4,13 × 10⁶ hectares depending on rain. Salt affected land in Pakistan is estimated to be about 11,87 × 10⁶ hectares. Thus, salinity is one of the major obstacles responsible for low crop yields in Pakistan. Salt sensitivity is a complex quantitative genetic character controlled by different genes. The main cause of salinity is the accumulation of salts in the soil profile unfavorable due to poor management of irrigation water and poor drainage should be clogging. Soil salinity strongly affects the physiology of plants. Malabsorption of nutrients and water affects plant growth and ultimately crop production. An economic loss caused by soil salinity is estimated at about 25 billion rupees a year. The concentration of salts in the soil, when you reach a level that affects the growth, salinity, are said to be developed. The accumulated salts mainly soluble salts of calcium, magnesium and potassium. Anions are mainly chloride and sulphate, carbonate and bicarbonate.
Sensitivity to salt harvest is usually expressed in lower expected return for a given level of soluble salts in the rhizosphere compared with performance at nezasoleni conditions. Salt tolerance of plants is its ability to develop and complete its life cycle on physiological substrate. In agriculture, the economic indicators should be the criterion of salt tolerant plants. In general, the maximum level of salinity, which yields linearly decreases with increasing salt stress. Changes in plant material digestion salt-tolerant GM crops succeed if there is genetic variation for salt tolerance between species. After beginning work on improving salt-tolerant. There are numerous reports indicated the existence of variation in the nature of different cultures, wheat. Good understanding of knowledge for salt tolerance mechanism is one of the basic requirements for crops in saline areas like tolerance and adequate performance. Plant growth in saline environments depends on a number of morphological, physiological, biochemical and anatomical, allowing plants to grow in the presence of high concentrations of toxic ions [3]. In general, the mechanism of salt tolerance implies the exclusion or inclusion of ions associated with osmotic adjustment in accordance with the genetic features of type. Different wheat truth is not in response to soil salinity. Some varieties have been spotted very sensitive to soil salinity. While others have shown high resistance salts. There is therefore a need to abandon wheat varieties suitable for cultivation in saline area. The only possible solution is the use of salt tolerant crops to cope with this problem.
Materials and Methods
Experiment 1 (Hydroponics culture)
Seeds of each 45 genotypes were sown on iron trays, randomized within trays. One seed per plug and five plants per family per tray were germinated [4]. With a total of ten trays being used. The trays were placed over vermiculite moistened with a solution containing 2.0 mol m-3 of aerated, phostrogen based nutrient solution containing 2.26 mol m-3 K, 0.1 mol m-3 Na, 0.24 mol m-3 Ca, 0.31 mol m-3 Mg, 2.8 mol m-3 NO3, 0.57 mol m-3 PO4 and micronutrient.
Transplanting
At two leaf stage (almost one week after emergence of seedling) the seedling were transplanted from iron trays to the 200 L capacity tubs. Two plants per hole of each genotype were transplanted into foam plugged holes in thermo pole sheets.
Treatments
After 3 days of transplanting, salt was added to the nutrient solution starting on the 15 days after germination, in increment of 25 mol m-3 NaCl day-1 to an initial level of 100 and 200 mol m-3 NaCl. CaCl2 was also added to maintain a Na:Ca ratio of 20:1. The pH was adjusted at 6.0 to 6.5 daily by adding HCl (IN) or NaOH (IN). Solutions were changed after 8 days during the entire experimental period.
Harvesting
Plants were harvested after 5 weeks of salinity development. Plants were washed with distilled water and dried with blotting paper. At the time of harvesting, data were regarding, root length (cm).
Relative salt tolerance=Value of a character in NaCl/Value of a character in control × 100
Origin of plant material
The two accessions WMB-1 was found to be the most tolerant and AS-2000 was observed the most salt sensitive. The seeds of these two accessions were obtained from the center of advanced study in genetics and saline agriculture, university of agriculture, Faisalabad, Pakistan.
Plant material and salinity treatments
Seeds of two wheat accessions WMB-1 (salt tolerant) and AS-2000 (salt sensitive) as determinated by Lacerda, et al. were sown in trays containing vermiculite and irrigated daily with distilled water [5]. Ten days old seedlings were transferred to tray containing nutrient solution and thirteen days later transferred to 3.5 L plastic pots containing nutrient solution, (control) without saline treatment (saline treatment) with 150 mM NaCl (saline treatment). The addition of salt (50 mM NaCl per day) began upon transplantation in to the plastic pots.
Growth measurements
Plants were harvested twenty eight days after the start of NaCl treatments. At harvesting, data regarding shoot fresh weight (g/plant) and root fresh weight (g/plant) of 5 seedlings of each accession in each replication was measured. Osmotic pressure was determined this way [6]. A portion of the centrifuged tissue sap was used to determine osmotic pressure in milli-Osmole kg-1 by using automatic micro-osmometer. After heading, length and width of the flag leaf of main shoot was measured and area was calculated according to the following formula given by Elings.
Flag leaf area=Flag leaf length × Flag leaf width x 0.75
Ionic analysis
The leaf material for in analysis was thawed and crushed using a glass rod with a tapered end the sap was transferred into two 1.5 ml Eppendorf tubes with the help of micropipette and these tubes were inverted vertically 5–10 times followed by spinning at 13,000 rpm for 15 minutes in centrifuge (MSB010 CX1.5, MSE, UK). After centrifugation supernatant was transferred from both tubes into another 1.5 ml Eppendorf tube and adding distilled water and analyzed for leaf Na+ using spectrophotometer.
Enzyme assays
Specific SOD activity was determined by measuring its ability to inhibit the photochemical reduction of nitro blue tetrazolium chloride, as described by Giannopolitis and Ries. About 3 ml of reaction combination, containing 0.1 ml of 3 mM EDTA, 0.1 ml of 200 mM methionine, 1.5 ml of 100 mM potassium phosphate buffer, 0.01 ml of 2.25 mM Nitro-Blue Tetrazolium (NBT), 0.05 ml of enzyme extraction and 1 ml distilled water were use within the test tubes in double in number for each enzyme model [7]. Two tubes were used as control with not including enzyme. The effect was in progress with the addition of 0.1 ml riboflavin (60 μM and insertion these tubes underneath the light supply of two 18 W lamps for 20 min. Reaction was stopped up by switching off the light. These tubes were covered with black cloth. Tubes used as control developed maximal color. A non-irradiated complete reaction mixture which did not develop color served as blank. Absorbance was recorded at 560 nm and one unit of enzyme movement was taken as the amount of enzyme. The tubes lacking enzymes compact the absorbance reading of samples up to 50%.
Catalase (CAT) action was precise according to Aebi. As concerning for Catalase (CAT) 3 ml reaction mixture containing 1.5 ml of 100 mM potassium phosphate buffer (pH=7.2), 0.5 ml of 75 mM H2O2, 0.05 ml enzyme extraction. The distilled water was used to construct the volume upto 3 ml. Reaction in progress by the addition of H2O2. The absorbance recorded in decrease at 240 nm for 60 seconds [8]. The enzyme action was accounted by calculating the quantity of decomposed H2O2. Peroxidase (POD) activity was assayed by recording 3 ml reaction mixture. The reaction mixture contained 0.1 mM EDTA, 1 ml of 0.2 M potassium phosphate buffer with containing (pH=7.6), 0.1 ml of 2 mM (NADPH), 0.5 ml of 3 mM DTNB, 0.1 ml enzyme extract. The distilled water was used to create a closing volume of 2.9 ml. Reaction initiated by adding of one unit of POD activity. The raise within absorbance at 412 nm recorded at 25°C in excess of a period of 5 min on a spectrophotometer. Protein extract was quantified through the technique of Bradford.
Statistical analysis
The experimental design was a completely randomized 2 (genotypes) x 2 (salt levels) factorial with ten replications of one plant each. For each one of the enzyme assays ten replicated extracts were used of each plant part and the assays carried out in duplicate [9]. The data were expressed as the means.
Results and Discussion
Relative root length
Relative salt tolerance for relative root length provided further estimates of the salinity tolerance of genotypes (Table 1). Comparison of genotypes based on relative root lengths showed that some of the genotypes were more tolerant than others at 12 dS m-1 NaCl. Relative Root lengths of CIM-3 and SQ-26 were 76.05% and 57.30%, respectively in 12 dS m-1. With increased salinity level (24 dS m-1, relative root length of all the genotypes were affected but to varying degrees [10]. Under 24 dS m-1 genotype S-24 with salt tolerance index of 75.19% appeared to be less affected.
From the comparison of overall performance, the salt tolerance of different genotypes could be clearly assessed. Genotypes S-24 and DN-34 with tolerance indices of 84.10% and 81.98% respectively for root length in salinized solution, under 12 dS m-1 appeared to be the most tolerant genotypes. By contrast, DN-27 and DN-37 were 25.27% and 28.02% seem to be the most sensitive to salinity compared to DN-24 under 24 dS m-1. Other genotypes produced shoot lengths ranging between 42.712% to 61.45% at both salinity levels [11].
| Genotypes | 12 dS m-1 | 24 dS m-1 | Mean of 2 salinities |
|---|---|---|---|
| SW-31 | 46.08 | 46.08 | 46.08 |
| SS-6 | 62.89 | 51.67 | 57.28 |
| SARC-2 | 57.28 | 49.78 | 53.53 |
| SW | 61.11 | 51.82 | 56.4 7 |
| SW-20 | 63.29 | 35.51 | 49.4 |
| SW-34 | 50.81 | ,39.52 | 45.17 |
| 8670 | 50.31 | 45.06 | 47.69 |
| SARC-1 | 74.82 | 44.18 | 59.5 |
| 8721 | 48.11 | 30.3 | 39.21 |
| SARC-3 | 49.38 | 43.23 | 46.31 |
| CIM-31 | 48.96 | 38.03 | 43.5 |
| CIM-3 | 76.06 | 46.01 | 61.04 |
| SQ-26 | 57.3 | 48.65 | 52.97 |
| SQ-77 | 56.68 | 42.68 | 49.68 |
| SS-17 | 56.36 | 40.18 | 48.27 |
| PARC-N2 | 35.47 | 31.5 | 33.49. |
| Y02-2 | 47.34 | 41.8 | 44.57 |
| Y28 | 57.77 | 45.57 | 51.67 |
| WC-65 | 58.91 | 43.64 | 51.28 |
| KRL-24 | 52.87 | 35.66 | 44.27 |
| S-24 | 84.1 | 75.19 | 79.64 |
| KRL-20 | 65.17 | 53.16 | 59.17 |
| SQ-78 | 42.82 | 34.15 | 38.49 |
| WC-78 | 45.15 | 35.54 | 40.35 |
| DN-25 | 51.21 | 34.21 | 42.71 |
| DN-26 | 52.63 | 44.62 | 48.63 |
| DN-27 | 42.54 | 25.27 | 33.9 |
| K-65 | 65.07 | 55.15 | 60.11 |
| LU-26S | 48.32 | 38.82 | 43.57 |
| DN-30 | 74.65 | 42.87 | 58.76 |
| DN-31 | 44.29 | 21.34 | 32.81 |
| DN-32 | 42.51 | 21.63 | 33.07 |
| DN-33 | 72.69 | 37.15 | 54.92 |
| DN-34 | 81.98 | 40.92 | 61.45 |
| DN-35 | 81.17 | 42.33 | 61.75 |
| DN-36 | 70.97 | 31.46 | 51.22 |
| DN-37 | 62.48 | 28.02 | 45.25 |
| DN-38 | 69.04 | 36.14 | 52.59 |
| DN-39 | 75.29 | 34.62 | 54.95 |
| DN-40 | 67.65 | 24.5 | 46.08 |
| SQ-133 | 67.47 | 30.07 | 48.77 |
| WC-58 | 65.37 | 24.28 | 44.82 |
| WC-40 | 79.37 | 39.01 | 59.19 |
| WC-59 | 81.71 | 32.37 | 57.04 |
| 8244 | 66.17 | 27.74 | 46.96 |
| CIM-4 | 64.03 | 31.18 | 47.6 |
| SQ-92 | 81.18 | 31.84 | 56.51 |
| CIM-40 | 68.47 | 25.72 | 47.1 |
| CIM-26 | 57.08 | 29.98 | 43.53 |
| CIM-37 | 72.57 | 28.83 | 50.7 |
| CIM-34 | 67.83 | 26.62 | 47.23 |
Table 1: Relative root lengths (%) of 45 genotypes grown in control and at two salinity levels.
Peroxidase activity
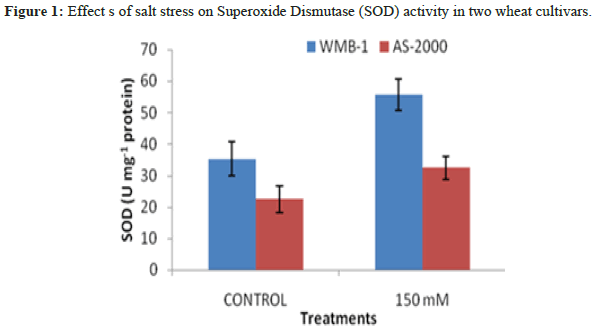
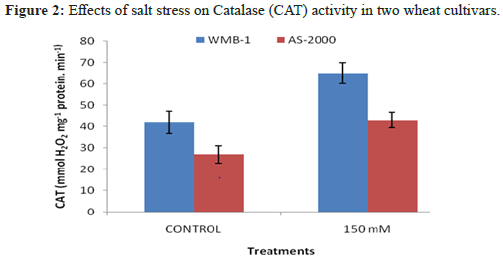
Leaves enzymatic activity of SOD activity significantly increased salinity power at two levels of salinity (Figure 1). Greater enzyme activity observed at high salinity for varieties: WMB-1 and AS-2000, although these ratings were low-level control [12]. Catalase activity showed the strongest growth in the presence of 150 mM NaCl and minimal activity was observed with the control. Increased concentration of 1 mm SA increased CAT activity (Figure 2). Superoxide anion generated from biotic and abiotic stresses such as salt stress. CAT is another important antioxidant enzyme that converts H2O2 into water peroxisomes. In this organelle, H2O2 is produced from β-oxidation of fatty acids and fotodyhannya. Greater activity of CAT and APX reduction of H2O2 in the cell membrane and increase the stability and CO2 fixation because several enzymes of the Calvin cycle in chloroplasts are extremely sensitive to H2O2. High H2O2 directly inhibits CO2 fixation. Both varieties have similar trends, the salt concentration increases [13]. CAT activity also in 150 mM NaCl in WMB-1 was higher than AS-2000 and there are significant differences (P<5%). There were many differences between the genotypes of the control and 150 mM NaCl. It seems that in WMB-1, CAT activity was not adequate. Although its activity increases with increasing salt stress, it was not sufficient for complete washing of H2O2. In plant cells, the cooperation of antioxidant enzymes is essential for ROS scavenging. When SOD activity was high, ROS, particularly superoxide radical cleaning was done properly and, therefore, membrane damage and oxidative stress decreased, leading to an increased tolerance to oxidative stress. Salt stress increased levels of superoxide in the cells. If this radical is not relieved of SOD, it provides essential biomolecules. In addition, it inactivates antioxidant enzymes, which are essential for the H2O2 treatment, such as catalase and peroxidase. WMB-1 in one hand, the increased production of superoxide radical with other stress salt. But SOD activity was constant at all levels of salt stress. For this reason, dangerous radical cleaning was not done to perfection [14]. SOD is an antioxidant enzyme that cleans up free radicals, converting them to H2O2. Superoxide dismutase activity increased significantly with increasing salinity. When the activity of antioxidant enzymes such as superoxide SOD and CAT content low radical and H2O2 increases two react together to produce hydroxyl radicals. These radical attacks all biomolecules and disrupts cellular metabolism.
Relative water content (%)
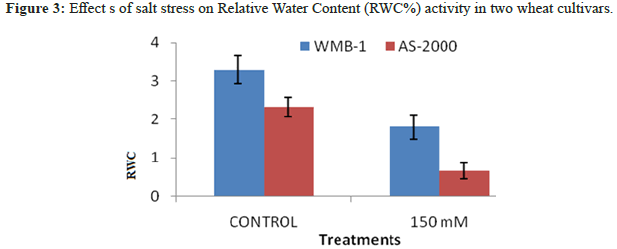
Salinity sensitive wheat genotypes AS-2000 showed a significantly higher reduction in RWC, the tolerant genotypes WMB-1 for salt stress in which reflects its tolerant nature (Figure 3). Decreasing salinity induced RWC and MSI have been reported previously [15]. Srivastava, et al. also have chlorophyll parameters of salt tolerance of crops. Hernandez, et al. observed more chlorophyll degradation varieties sodium chloride sensitive pea against a tolerable. According reduce shoot growth, RWC (%) gradually decreases with increasing NaCl. In addition, greater reduction in RWC (%) was obtained at a concentration of PEG with respect to the concentration of NaCl [16,17]. RWC (%) in seed large was higher than small seeds under all potential osmotic water stress created with NaCl and PEG. In contrast, osmotic stress with PEG, shoot out large seeds was slightly higher RWC (%), than take after the secondary seed.
Shoot fresh weight
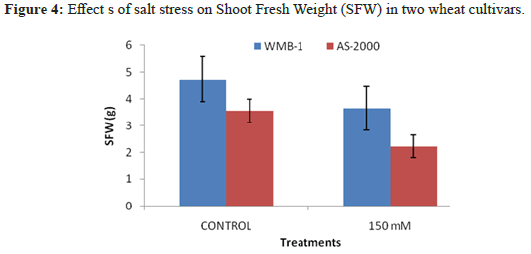
Increasing concentrations of NaCl reduced growth AS-2000. WMB-1 growth was not inhibited at high salt concentrations. The growth of AS-2000 was almost completely inhibited at 150 mM NaCl. Wet weight of salt stressed plants AS-2000 was reduced by 60% when 150 mMNaCl, while the fresh weight of plants WMB-1 decreased by 7.2%, the same level of salinityin (Figure 4). Species vary considerably in their growth response to salinity [18]. Many plants have the ability to adapt to adapt to multiple environmental changes. We observed differences in the underlying mechanisms of oxidative stress injury and tolerance to salinity later. Salinity treatment resulted in growth inhibition as Pinnata A. and A. filiculoides as evidenced by the reduction in dry weight. The growth inhibition caused by NaCl stress in A. Pinnata compared with observations Zimmerman and Rajarathinam and Padhya. However, A. filiculoides was more sensitive and prevent the processing of salinity beyond 20 mM. Reduced growth may be due to osmotic injury or specific ion toxicity in the context of the entry of salt [19].
Tissues Na+
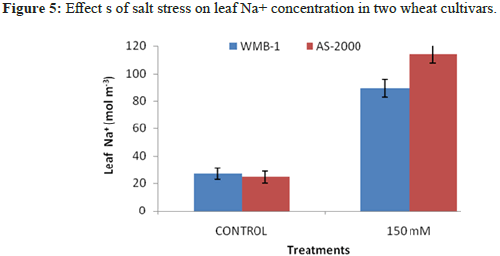
There are two types of significant differences in the concentration of endogenous Na+ with increasing NaCl concentration in the medium (Figure 5). In both filiculoides and A. Pinnata accumulation of Na+ is proportional to the concentration of NaCl exogenous. However, WMB-1, it will increase the endogenous Na+ content is relatively lower than the AS-2000 plants. Feedback between endogenous Na+ content and salt tolerance in different organs of rice observed Dionisio-Sese and Tobita [20]. Heaven and Paradise observed significant differences in the ability of Azolla plants stressed and able to regulate the concentration of ions in the salinity stress. Sreenivasulu, et al. found that less Na+ ions in the salt tolerant strains of foxtail millet. Failure to maintain the homeostasis of the intracellular ion leads to reduced growth of cells of Catharanthus pink salt effect. Salt stress has been reported to modulate ion transporter involved in homeostasis. Further research is necessary in correlation with the ionic regulation of salt stress. Our results show the difference in the adaptive response of plants to salinity and probably it could be one of the mechanisms conferring salt tolerance of Azolla plants.
Conclusion
The tolerance of plants to salinity is a complex physiological mechanism. Along with the regulation of gene expression and metabolism, regulation of ion transport in cell membranes is necessary for maintaining the optimal ionic composition of the cytosol and the water potential of plant cells under salt stress. The studies revealed a pronounced genotypic specificity of the response to salinization in seedlings of the Triticum aestivum L. genotypes. It was found that under salinity conditions, the salt tolerant genotype was characterized by a low MDA level, a low Na+ content in the above ground parts and roots, high activity of antioxidant enzymes such as APX and CAT, high amounts of proline and soluble sugars, high water potential, and constant Fv/Fm values. It was also shown that, in response to salt stress, the TaHKT1; 5 gene activity changed differently in the roots of two genotypes with contrasting tolerance. Summarizing the above, we can conclude that the greatest difference between the studied bread wheat varieties was manifested in the greater ability of the salt tolerant MIR variety to constrain the input of Na+ into photosynthetic tissues as a result of the down regulation of the TaHKT1;5 gene expression in the roots and that it would be useful to develop a salinity tolerant wheat variety in future breeding programs.
References
- Ahsan M, Wright D, Virk DS (1996) Genetic analysis of salt tolerance in spring wheat (Triticum aestivum L.). Cereal Res Comm 24:353-360
- Amtmann A, Sanders D (1999) Mechanisms of Na+ uptake by plant cells. Adv Bot Res 29:75–112
- Blum A (1996) Crop responses to drought and the interpretation of adaptation. Plant Growth Regul 20:135–148
- Blumwald E, Aharon GS, Apse MP (2000) Sodium transport in plant cells. Biochemical Biophysica Acta 1465:140–151
[Crossref] [Google Scholar] [PubMed]
- Cheeseman JM (1988) Mechanisms of salinity tolerance in plants. Plant Physiol 87:547–550
[Crossref] [Google Scholar] [PubMed]
- Davenport RJ, Reid RJ, Smith FA (1997) Sodium-calcium interactions in two wheat species differing in salinity tolerance. Physiol Plant 99:323–327
- Demiral T, Turkan I (2006) Exogenous glycinebetaine affects growth and proline accumulation and retards senescence in two rice cultivars under NaCl stress. Environ Exp Bot 56:72-79
- Gorham J, McDonnell E, Wyn Jones RG (1984) Pinitol and other solutes in salt stressed Sesbania aculeata Z. Pflanzenphys 114:173-178
- Greenway H, Munns R (1980) Mechanisms of salt tolerance in no halophytes. Annu Rev Plant Physiol 31:149-190
- Juan M, Rivero MR, Romero L, Ruiz JM (2005) Evaluation of some nutritional and biochemical indicators in selecting salt-resistant tomato cultivars. Environ Exp Bot 54:193-201
- Khan MA, Rizvi Y (1994) Effect of salinity, temperature and growth relation on the germination and early seedling growth of Atriplex griffithii var. Stocksii. Can J Bot 72:475-479
- Lauchli A, Epstein E (1990) Plant responses to saline and sodic conditions. Agri Assess Manag 71:113-137
- Levitt J (1972) Responses of Plants to Environmental Stresses. Academic Press Inc, New York.
- Mather K, Jinks JL (1982) Biometrical Genetics. 3rd edition. Chapman and Hall Ltd. London, UK.
- Rafiq M (1990) Soil variability in agronomic research. Pak J Soil Sci 5:9–14
- Shannon MC, Rhoades JD, Draper JH, Scardaci SC, Spyres MD (1998) Assessment of salt tolerance in rice cultivars in response to salinity problems in California. Crop Sci 38:394-398
- Singh P, Narayanan SS (2000) Biometrical techniques in plant breeding. 2nd edition. Kalyani publishers, Ludhiana, New Delhi, India.
- Steel RGD, Torrie JH (1980) Principles and procedures of statistics, a biometrical approach. 2nd edition. McGraw Hill Book Co, New York, USA. 633
- Termaat A, Munns R (1986) Use of concentrated macronutrient solutions to separate osmotic from NaCl-specific effects on plant growth. Aus J Plant Physiol 13:509–522
- Vranova E, Atichartpongkul S, Villarroel R, Montagu MV, Inze D, et al. (2002) Comprehensive analysis of gene expression in Nicotiana tabacum leaves acclimated to oxidative stress. Proc Natl Acad Sci USA 99:10870–10875
[Crossref] [Google Scholar] [PubMed]

Open Access Journals
- Aquaculture & Veterinary Science
- Chemistry & Chemical Sciences
- Clinical Sciences
- Engineering
- General Science
- Genetics & Molecular Biology
- Health Care & Nursing
- Immunology & Microbiology
- Materials Science
- Mathematics & Physics
- Medical Sciences
- Neurology & Psychiatry
- Oncology & Cancer Science
- Pharmaceutical Sciences
