Design of Ni-oxide Nanocomposites Containing 13-Retinoic Acid and Cholecalciferol Compounds and their Cytotoxicity on CP70 and Mice
Soheila Zare*
Department of Medical Library and Information Sciences, School of Allied Medical Sciences, University of Sciences and arts of yazd, Iran
*Corresponding Author:
Soheila Zare
Department of Medical Library and Information Sciences
School of Allied Medical Sciences
University of Sciences and arts of yazd, Iran
Tel: 09103313048
E-mail: soheila7310@gmail.com
Received Date: September 17, 2020; Accepted Date: October 01, 2020; Published Date: October 08, 2020
Citation: Zare S (2020) Design of Ni-oxide Nano-composites Containing 13-Retinoic Acid and Cholecalciferol Compounds and their Cytotoxicity on CP70 and Mice. Endocrinol Metab Vol. 4 No.4:3. DOI: 10.36648/endocrinology-metabolism.4.4.3
Copyright: © 2020 Zare S. This is an open-access article distributed under the terms of the Creative Commons Attribution License, which permits unrestricted use, distribution, and reproduction in any medium, provided the original author and source are credited.
Abstract
Ovarian cancer is the most common cause of female death due to genital cancers and five causes of cancer death in women. The results of this study show that NiO nanoparticles can be prepared with homogeneity and suitable size for different applications. The study also shows the ability of NiO nanoparticles to supply D3 and A vitamins. Samples were also evaluated by XRD and FTIR techniques. NiO nanostructured crystals, nickel oxide bound to vitamin D (total calciferol) and NiO, bound to vitamin A (retinoic acid) were estimated by the Debye-Sherrer ratio of 13, 98 and 170 nm. Then, CP70 ovarian cancer cells In 5% CO2 and 37°C, cells were cultured with nickel oxide nanoparticles, vitamins A and prepared at different concentrations, as well as nanoparticles containing these vitamins at different levels of 24, 48, 72 and 96 hours were affected. According to the results of MTT, 10 and 25% vitamins treatments were single or attached to NiO nanoparticles at treatment time of 72 and 96 hours (p<0.001). Finally, induction of cancer in mice was done by injection of CP70 and after 4 weeks the mice were prepared. Treatment of mice by NiO treatment groups attached to vitamin A, NiO bound to vitamin D, vitamin A alone, and vitamin D was performed. Meanwhile, two control groups: negative (healthy and untreated) and positive (non-treated) mice were tested. The diseased and healthy tissues of the rats were determined by describing the results and analyzing the chromosomal chromosome-eosin staining. The results of the present study indicate that the interaction groups of nickel oxide nanoparticles containing vitamins A and D can produce significant cellular effects on blood cells and cause significant growth in these cells. The bioavailability of vitamins A and D can be effective in the treatment of ovarian cancer.
Keywords
Ovarian cancer; Vitamin A; Vitamin D; Cytotoxicity; CP70
Introduction
The application of nanoparticles in medical science has created new possibilities for diagnosis, tumor imaging and cancer treatment in humans. Nanoparticles-particles in the size of 1-100 nm-are emerging as a group of cancer treatments. Early clinical results indicate that treatment with nanoparticles can be more effective, while simultaneously reducing side effects due to properties such as target localization in tumors and active cellular uptake [1]. Among the various nano-materials, metal oxides have been increasingly considered by industry and technology [1]. The unique physical and chemical properties of metallic nanoparticles have attracted great attention in recent years and have a wide application in chemical and medical industries, due to their very small and special surface properties. These nanoparticles are very high [2]. NiO nanoparticles have shown superior properties, such as catalytic properties [2], magnetic [3], electrochemical [4], optical and electrochemical [3]. Generally speaking, making nanofilaments is difficult because of their rapid reaction with oxygen and conversion to metal oxide. Therefore, in the manufacturing method, it should be done in such a way that oxidation does not occur.
Various methods have been proposed for the fabrication of this nanoparticle in the sources, some of which include resuscitation, sonochemistry of photolytic reactions and pyrolysis, solvent extraction micro elution and chemical deposition. Methods such as pyrolysis by ultrasonic waves [5], fluid controlled sedimentation [6], electrode position [7], chemical vapor deposition [8], sol-gel method [9], reduction of metal salts, then metal oxide oxidation [10] and laser erosion [11] are among the most advanced methods for synthesizing nickel nanoparticles. Vitamins facilitate the metabolism of amino acids, fats and carbohydrates, and allow the growth and development of iodine cells. Vitamins A and D is a bunch of water-soluble vitamins and fat-loving ones. Retinol and vitamin A derivatives affect cell differentiation, proliferation and apoptosis, and play an important physiological role in a wide range of biological processes. Vitamin A can be obtained from the diet or as pre-made vitamin A from retinal ester, retinol, and in much less retinoic acid or carotene protivitamin A. Vitamin D3 is a steroid hormone produced by sunlight [12]. Vitamin D can be found in various chemical structures such as calciol or cholecalciferol, calcidiol and calcitriol [13].
Materials and Methods
Synthesis of nanoparticles
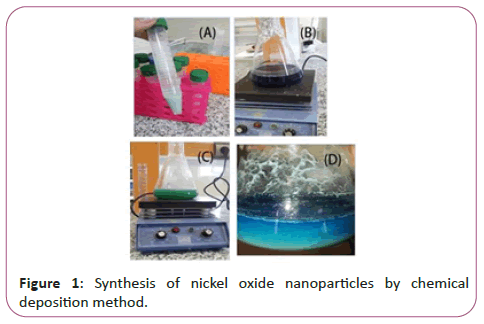
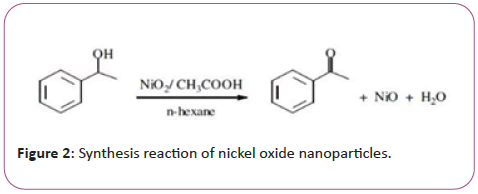
Nanoparticles of nickel oxide were synthesized by chemical deposition method (Figure 1). Briefly, 50.89 gr Ni (NO3) 2.6H2O powder was mixed with 100 ml distilled water. The NH3 (OH) solution was added to the solution as a dropper and washed on a magnetic stirrer at 1000 rpm and at 70°C. until a green deposition of the nickel oxide nanoparticles was obtained. Then, in order to wash the sediment, ethanol was added to 1:1 ratio, and the sediments were centrifuged 10 times each time for 10 minutes at a speed of 1500 rpm. The precipitates were placed in an incubator at 43°C for 24 hours and then in a furnace at 340°C for 2 hours to obtain a gray powder of the nickel oxide nanoparticle (Figure 2).
Vitamin A loading on nickel oxide nanoparticle
The loading of vitamin A nanoparticles was done by first dissolving 2 g of nanoparticles in 100 ml of PBS and then taking 12 ml of the solution to 600 μl of vitamin A and 2.4 ml of dextran solution (1%), which acts as a linker of vitamin A and nanoparticles. To the solution, we added 1.2 ml of zinc chloride (1m) to prevent nano particulate fusion. To the resulting mixture, 1 ml of mannitol was added 5% and was centrifuged at 3000 rpm for 1 hour and the precipitate was extracted with 1 ml of ethanol 96% washed and dissolved in 1 ml DMSO.
Vitamin D loading on nickel oxide nanoparticles
In this method, we first solved 0.01 g of nickel oxide nanoparticles of 12 ml of PBS solution. Then, 1 ml of vitamin D was added and the resulting solution was vortexed and then centrifuged at 800 rpm for 10 minutes. The solution was placed in a refrigerated incubator at 4°C for 24 hours. After one night, the solution was centrifuged for 30 minutes at 13000 rpm. The precipitate was dissolved in 10 ml sterile distilled water and 1 ml 96% ethanol and 1 ml DMSO.
Preparation of treatments
In this study, three concentrations were obtained from each treatment. Nickel oxide nanoparticles were prepared at concentrations of 1%, 10%, 50% and vitaminized nanocomposites with 2%, 10%, 25% vitamins and 50% nano-particles concentration. To prepare each concentration, Hertymar was mixed separately with its solvent. For nano-particle solvent, Vitamin A was used from PBS and ethanol was used for solvent vitamins.
Treatment of cells with nano-composites
After cultivating cells in 96-well plates of each nano sample, vitamin A, vitamin D, nano-vitamin A, nano-vitamin D and nano-vitamin A+D, at 50 microplate was added to the cells, each test was repeated 2 times and the plates were kept in the incubator for 24, 48, 72, 96 hours. This test was performed to measure cell survival.
Absorbance was read at 570 and 630 nm, thanks to the ELISA device. The mean wavelengths were calculated and then the wavelengths of 570 were reduced from opposite numbers at 630 wavelength and then calculated to calculate the survival percentage in the following formula:
(Positive optical absorption control-Negative optical absorption control)/(Positive control optical absorption-Negative control Absorbent light) × 100
Then, to calculate the percentage of cell death, 100 is reduced from the number obtained from the above formula.
Negative control: cell-free medium and positive control: cell suspension without treatment.
Injection of the cell line into the mouse
CP70 cells cultured after trispinning and washed with PBS buffer, and 106 cells per 50 μl of PBS in insulin were prepared as peritoneal injection to 400 ml per ml Two left and right ovaries were injected each 200 μl. After a week, mice were treated with naphthalene for mutagenesis. The second injection of CP70 cells was done after two weeks of the first injection. After examination and assurance of complete ovarian cancer, after one month, the treatments are through peritoneal and oral injections.
Therapeutic and control groups
In this project, 7 groups, each containing 3 female mice, were defined (Table 1):
| Concentration of nanoparticles (%) | Concentration of vit A (%) | Concentration of vit D (%) | |
|---|---|---|---|
| 1 Group | 50 | - | - |
| 2 Group | - | 25 | - |
| 3 Group | - | - | 25 |
| 4 Group | 25 | 25 | - |
| 5 Group | 25 | - | 25 |
Table 1: Concentrations prepared for treatment of mice.
Our sixth and seventh groups of control groups include healthy mice and non-treated mice. All treated mice were injected 50 μl of all treatments. Injections were done peritoneally and to both ovaries. Mice were described during the third, sixth and seventh weeks of treatment.
Results
Microscopic and spectroscopic analysis
Finally, in order to evaluate and characterize the fuzzy structure of the powders (sediment), X-ray diffraction (XRD) techniques were used using the D8 Bruker X-ray diffraction The ray-X source used in the CuKα release gun and the diffraction operation was in the range of 10 to 70 degrees, and the Fourier Transform Infra-Red Spectroscopy (IRF) The Bruker IR-FT device was used to examine the morphology of the powder from Transmission Electron Microscopy and Dynamic Light Scattering (DLS).
TEM electron microscopy analysis
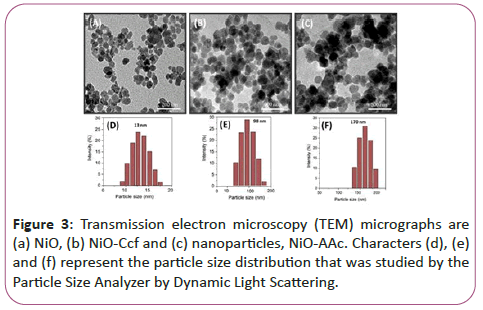
Figure 3 shows transient electron microscopy (TEM) of Figure 3a shows NiO nanoparticles, Figure 3b shows nanoparticles connected to Kelsofyrol (Ccf)-NiO-Ccf and Figure 3c shows nano-particles attached to retinoic acid (RA) NiO-RA. According to electron microscopy, nanoparticles are seen as separate particles before and after binding to vitamins, and no accumulation is observed in them.
Figures 3d-3f represents the particle size distribution that was examined by the particle size analyzer by dynamic light scattering.
X-ray diffraction analysis
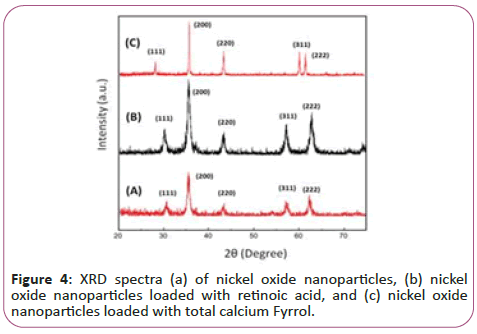
Figure 4 illustrates the dispersion pattern of nano-particles of nickel oxide. The obtained peaks at the angles 30, 36, 44, 57 and 62 degrees in the forms (A), (B) and (C) confirming the formation of a nickel oxide composition. These pixes are respectively bunch pages (111), (200), (220), (311) and (222) respectively. According to the results, the formation of nickel oxide in the state of using potassium carbonate without any impurity phase is confirmed. As can be seen, the degree of crystallization of the nanoparticle powder has been very successful and the intensity of the peaks has increased significantly, indicating a high degree of crystallinity of pure nanoparticles and nanoparticles attached to vitamins. The crystalline size of NiO, NiO-Ccf and NiO-RA nanostructures was estimated by the Debye-Sherrer ratio of 13, 98 and 170 nm.

In this regard, D is the size of crystallites in nanometres, λ is the wavelength of x-rays in nanometres (0.154 nm), B is the highest peak in half the height in radians as (Full width at half maximum) is expressed by FWHM and θ is the angle of dissociation of the longest peak in degrees. It should be noted that the size of the calculated grains is estimated by the Debye-Sherrer equation. According to the results, increasing the size of the seeds due to the addition of vitamins implies an increase in the degree of crystallization and further growth of NiO seeds.
Check FTIR results
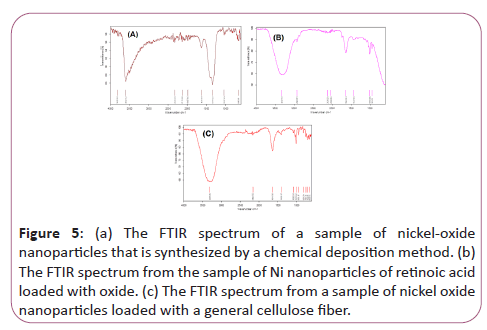
Figure 5a represents the FTIR spectrum of a sample of nickeloxide nanoparticles that is synthesized by a chemical deposition method. As seen, the band in the region of 1341/25 is related to vibrations Symmetric and asymmetric OH bonding of H2O hydrate to nickel oxalate. While the 1624/99 cm-1 peak of the asymmetric vibrations of O-C is the carbonyl oxalate group. Also, the bending vibrations of water are 10.1089 cm-1 and 985/54 cm-1. Finally, the NiO bands were recorded in the region of cm-1 606.66. The 1260/3 cm-1 cm-1 is related to the tensile vibrations of the H-N molecule of ammonia.
Figure 5: (a) The FTIR spectrum of a sample of nickel-oxide nanoparticles that is synthesized by a chemical deposition method. (b) The FTIR spectrum from the sample of Ni nanoparticles of retinoic acid loaded with oxide. (c) The FTIR spectrum from a sample of nickel oxide nanoparticles loaded with a general cellulose fiber.
Figure 5b represents the FTIR spectrum from the sample of Ni nanoparticles of retinoic acid loaded with oxide. As it is seen, NiO bands were recorded in the 1665/14 cm-1 region, indicating that nickel nanoparticles retained their properties when linked to vitamin A. A small band in the region of cm-1 577/1407 relates to the symmetric and asymmetric vibrations of the O-H bond of H2O-hydrated molecule to nickel oxalate. While the 161.92 cm-1 peak is related to the asymmetric vibrations of O-C, the carbonyl group is present in the ring-like retinoic acid structure as well as the nanostructure oxalate. Also, the bending vibrations of O-H of the retinoic acid structure are located at 1/162 cm2 and 10/105 cm-1. The cm-1 of 03/3309 is related to the tensile vibrations of the H-N ammonia molecule. Therefore, we conclude that the structures of retinoic acid and nano-particles of nickel oxide were successful without changing the properties of both materials.
Figure 5c represents the FTIR spectrum from a sample of nickel oxide nanoparticles loaded with a general cellulose fiber. As seen, the cm-1 spectra of 91/1085 It is related to the general vibration of the COC. However, the CM-1 peak of 92/1641 C=O of the Oritan group is Kelly-Fyrrol. The cm-1 3309 spectrum is related to N-H total calciferol vibrations.
MTT analysis calculate cell survival
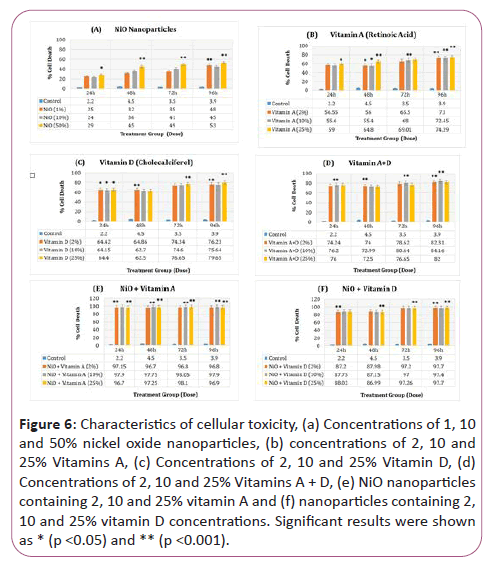
Figures 6a-6f represents the columnar graphs of MTT analysis results in 6 treatment groups (NiO, Vitamin A, Vitamin D, NiO+Vitamin A, NiO+Vitamin D, Vitamin A+Vitamin D for 24, 48, 72 and 96 hours. The statistical analysis of the results was analyzed by SPSS software. Significant results were recorded as p<0.05 and p<0.001, which were specified in (*) and (**) respectively in the charts.
Figure 6: Characteristics of cellular toxicity, (a) Concentrations of 1, 10 and 50% nickel oxide nanoparticles, (b) concentrations of 2, 10 and 25% Vitamins A, (c) Concentrations of 2, 10 and 25% Vitamin D, (d) Concentrations of 2, 10 and 25% Vitamins A + D, (e) NiO nanoparticles containing 2, 10 and 25% vitamin A and (f) nanoparticles containing 2, 10 and 25% vitamin D concentrations. Significant results were shown as * (p <0.05) and ** (p <0.001).
According to chart Figure 6a, the effect of the toxicity of NiO nanoparticles on growth of CP70 cells, the highest cytotoxicity in doses of 10 and 50% of NiO nanoparticles during 72 and 96 hours treatment periods Which was statistically significant (p<0.001) compared to the control group. In the case of cellular toxicity, 50% dose was significantly less in the 24-hour treatment period than the control group (p<0.05).
According to chart Figure 6b, the effect of vitamin A (retinoic acid) nanoparticle toxicity on growth of CP70 cells, the highest cytotoxicity at doses of 2%, 10% and 25% of vitamin A overtime Treatments were recorded for 96 hours and 72 hours, which was significantly higher than control group (p<0.001). A dose of 25% at 72 and 24 hours showed significant results as well (p<0.001). In case of 25% cytotoxicity in the 24-hour treatment period, it was less significant than the control group (p<0.05).
According to chart Figure 6c, on the effect of vitamin D toxicity (total calciferol) on growth of CP70 cells, the highest cytotoxicity in all doses of 2, 10 and 25% for 72 and 96 hours was investigated. Compared with the control group (p<0.001). A dose of 2% provided significant toxicity over a 48-hour period (p<0.001). All concentrations of vitamin D even showed significant results in 24 hours treatment compared to control (p<0.05).
According to Chart Figure 6d, on the effect of vitamin D (total calciferol)+vitamin A (retinoic acid) on the growth of CP70 cells, the highest cytotoxicity in all doses of 2, 10 and 25% For 24, 48, 72 and 96 hours, compared to the control group (p<0.001). However, the toxicity of vitamin D (total calcipiferol)+vitamin A (retinoic acid) attached to NiO nanoparticles provided the highest cytotoxicity at all treatment hours, indicating an increase in the effect of these vitamins in the presence of nickel oxide nanoparticles is (p<0.001) (Figures 6e and 6f).
Hematoxylin-eosin staining and histopathology of cancerous tissues
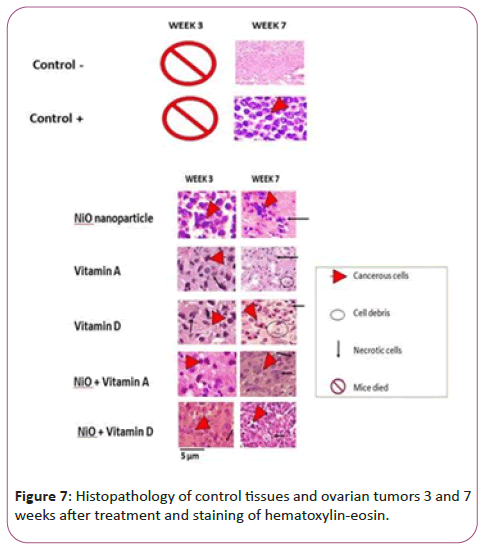
Figure 7 refers to the tissues stained with hematoxylin-eosin paint i.e. coloring of tissues after 3 and 7 weeks of treatment. According to the histopathologic comparison of control and treatment tissues, negative control tissues showing healthy and uncontrolled tissues are a pink background that represents healthy cells. But in the tissue of the positive control group, which contains the tissue containing cancer, and has not received any treatment, after 7 weeks of study, there are coarse and inflamed cells that are seen in purple color of hematoxylin and there is no necrosis in this figure.
Compared to control groups, the treatment group with NiO nanoparticles showed large cancer cells, which results indicate that even after 3 weeks of treatment, nanoparticles had no significant cytotoxicity alone. This trend has improved after the seventh week and the effect of nanoparticles on cancer cells has increased and the pink background has increased, indicating a reduction in inflammation. But vitamin A and D alone and also attached to NiO nanoparticles had significant cytotoxic effects on NiO (p<0.05) and control group (p<0.001). But vitamin A-linked NiO-treated groups, as well as vitamin D-linked NiO, showed the highest cell-mediated effects in colored bacon (p<0.001).
Discussion
Cancer is the biggest health problem in the whole world and in Iran. The third cause of death in Iran after cardiovascular disease and accidents is cancer. Ovarian cancer is the most common cause of female genital mutilation due to genital cancers and the fifth cause of cancer death in women [14]. This cancer has no clear symptoms in the early stages of the disease, so it is detected when the disease progresses. Despite commonly used chemotherapy, radiotherapy and photodynamic therapy, 85% of patients require combined therapy, which requires has created a new and innovative way of life. Despite commonly used treatments for ovarian cancer, one of the strategies to improve the effects of chemotherapy drugs is the use of compounds such as natural products that, while reducing side effects, can have a strong effect on cancer cells [15]. Nanotechnology has a high potential for a wide range of cancer research, such as diagnosis, monitoring, and therapeutic strategies, and offers valuable ideas in this regard. In recent years, researchers have been helping cancer treatment with many physical and chemical methods as intermittent and combined therapies for the production of Nano rods [16,17].
Conclusion
In conclusion, the method for producing nickel oxide nanoparticles is as follows: First, metal ions react with a suitable quenching factor and form a complex solution in which there is a precipitating agent. Then the complex separates to release metal ions. This is done through solvent conditions such as concentration or temperature. In this experiment, ammonia was selected as a quenching agent and nickel nitrate as a source of Ni2+. Initially, a solution of the nickel hexa-amine complex is formed, then the complex proceeds by separating the solution by diluting the solution with water. The solution is also heated to remove ammonia from the aqueous solution. The concentration of ammonia in the solution decreases and the free ion of nickel increases. When the concentration of free ions reaches a certain amount of nickel hydroxide it is uniformly obtained in solution. The resulting nickel oxide nanoparticles have a high efficiency and purity, a process that is inexpensive, fast and producible for the synthesis of nickel oxide nanoparticles, as well as nano-carriers of vitamin A and D3 are suitable in large quantities.
References
- Keating CD, Natan MJ (2003) Striped metal nanowires as building blocks and optical tags. Adv Mater 45: 451.
- Wang D, Xu R, Wang X, Li Y (2006) NiO nanorings and their unexpected catalytic property for CO oxidation. Nanotechnology 17: 979-983.
- Uhma YR, Park JH, Kima WW, Chob CH, Rhee CK et al. (2004) Magnetic properties of nano-size Ni synthesized by the pulsed wire evaporation (PWE) method. Mater Sci Eng B106: 224-227.
- Lin SH, Chen FR, Kai JJ (2008) Electrochromic properties of nano-composite nickel oxide film. Appl Surf Sci 254: 3357-3363.
- Oh SW, Bang HJ, Bae YC, Sun YK (2007) Effect of calcination temperature on morphology, crystallinity and electrochemical properties of nano-crystalline metal oxides (CO3O4, CuO, and NiO) prepared via ultrasonic spray pyrolysis. J Power Sources 173: 502.
- Deng XY, Chen Z (2004) Preparation of nano-NiO by ammonia precipitation and reaction in solution and competitive balance. Mater Lett 58: 276.
- Da Fonseca CNP, De Paoli MA, Gorenstein A (1991) The electrochromic effect in cobalt oxide thin films. Adv Mater 3: 553.
- Umar, Kim BK, Kim JJ, Hahn YB (2007) Synthesis, characterization, and electrochemical properties of self-assembled leaf-like CuO nanostructures. Nanotechnology 18: 175-606.
- Svegl F, Orel B, Svegl IG, Kaucic V (2000) Characterization of spinel CO3O4 and Li-doped CO3O4 thin film electrocatalysts prepared by the sol–gel route. Electrochim Acta 45: 4359.
- Illy-Cherrey S, Tillement O, Dubois JM, Fort FMY, Ghanbaja J, Be´gin-Colin S et al. (2002) Synthesis and characterization of nano-sized nickel(II), copper(I) and zinc(II) oxide nanoparticles. Mater Sci Engi A338: 70.
- Wang Y, Qin QZ (2002) A nanocrystalline NiO thin-film electrode prepared by pulsed laser ablation for Li-Ion batteries. J Electrochem Soc 149: A873-A878.
- Krishnan AV, Feldman D (2011) Mechanisms of the anti-cancer and anti-inflammatory actions of vitamin D. Annu Rev Pharmacol Toxicol 51: 311-336.
- Trump DL, Deeb KK, Johnson CS (2010) Vitamin D: Considerations in the continued development as an agent for cancer prevention and therapy. Cancer J 16: 1-9.
- Xiao-yan G, Jian-cheng D (2007) Preparation and electrochemical performance of nano-scale nickel hydroxide with different shapes. Mat Lett 61: 621.
- Siegel RL, Miller KD, Jemal A (2016) Cancer statistics, 2016. CA Cancer J Clin 66: 7-30.
- Zhang ZK, Cui ZI (2000) Nanotechnology and nanomaterials. National Defence Industry Press, Beijing, PR China. 2000:118-55.
- Ouyang L, Shi Z, Zhao S, Wang F, Zhou T et al. (2012) Programmed cell death pathways in cancer: A review of apoptosis, autophagy and programmed necrosis. Cell Prolif 45: 487-498.

Open Access Journals
- Aquaculture & Veterinary Science
- Chemistry & Chemical Sciences
- Clinical Sciences
- Engineering
- General Science
- Genetics & Molecular Biology
- Health Care & Nursing
- Immunology & Microbiology
- Materials Science
- Mathematics & Physics
- Medical Sciences
- Neurology & Psychiatry
- Oncology & Cancer Science
- Pharmaceutical Sciences
