ISSN : 0976-8505
Der Chemica Sinica
Cost Effective Quantification of Trace Level EDTA (Ethylene Di-amine Tetra Acetic Acid) by Titrimetry in Active Pharmaceutical Ingredients
Cherukuru Nagaraju1,2*, Uttam Kumar Ray1 and Siddaiah Vidavalur2
1APL Research Centre-II (A Division of Aurobindo Pharma Ltd), Survey No: 71 and 72, Indrakaran (V), Sangareddy (M), Medak, Hyderabad, Telangana, India
2Department of Organic Chemistry and FDW, Andhra University, Visakhapatnam, Andhra Pradesh, India
Abstract
Abstract
Quantification of trace level EDTA (Ethylene di amine tetra acetic acid) content method was developed and optimized in Active Pharmaceutical Ingredients. The method was based up on the complexometric titration of metal with EDTA in presence of pH: 10 Buffer by using potentiometric titration. The optimized method was validated for different parameters like Linearity, Limit of detection (LOD),Limit of quantification (LOQ), System Precision, Method precision, Ruggedness, Robustness and accuracy .Based on the validation study limit of detection and limit of quantification of EDTA was found to be 0.0160 %w/w and 0.0350 %w/w respectively. The RSD of the system precision and method precision was found to be 4.12% and 8.22% respectively. The developed method was rugged and robust based on experiments. The recovery of the method is in the range of 98-100%.The developed method is cost effective and simple to estimate EDTA content in trace level in different drug substances.
Keywords
Titrimetry, Amoxicillin, Ampicillin, 7-ACA, 6-APA, EDTA, Method development, Method Validation
Introduction
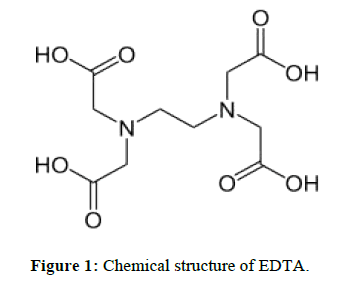
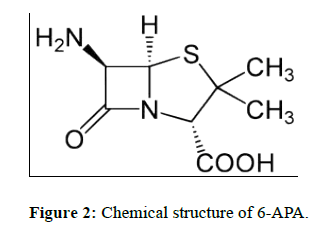
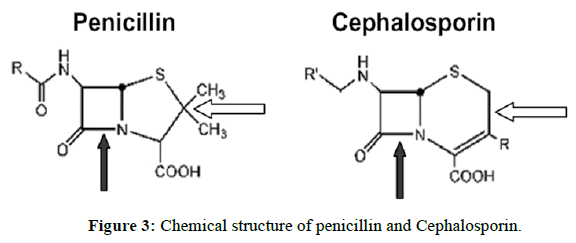
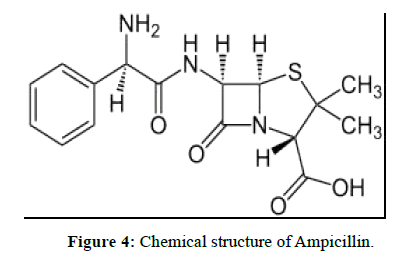
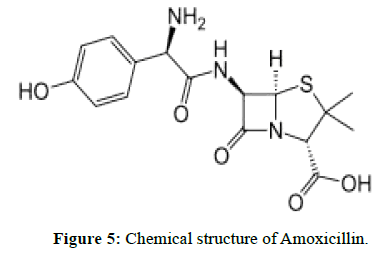
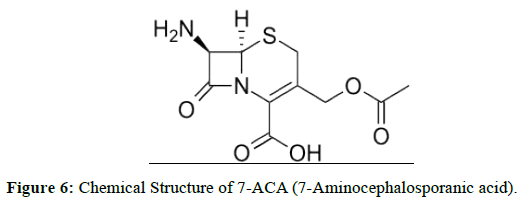
EDTA [1-4] (Ethylene di amine tetra acetic acid) is widely used in pharmaceutical industry for the synthesis of drug substances. In the synthesis of active pharmaceutical ingredients 6-APA is a key intermediate.6-APA is key intermediate for many drug substances. Any impurity other than active pharmaceutical ingredient is to be controlled with suitable limits in the drug substance irrespective of its harmful nature as per International council for harmonization (ICH) guidelines on impurities. Now our aim is to be controlled in Ethylene diamine tetra acetic acid in 6-APA stage only. It is the key intermediate for many drug substances. Therefore, the present developed method is simple and rugged method for the determination of EDTA in 6-APA.Literature survey reveals many analytical methods include HPLC, Titrimetric and other techniques. The optimized titrimetric method was validated according to ICH guidelines to prove its suitability and reliability for the determination of EDTA In 6-APA (Pharmaceutical drug substances during routine analysis). Now our aim is to be estimate the EDTA (Figure 1) content in 6-APA (Figure 2). This 6-APA is key intermediate for many drug substances those are penicillin and Cephalosporin (Figure 3), Amoxicillin (Figure 4), Ampiciliin (Figure 5) and 7-ACA (Figure 6). Now our aim is to be controlled the EDTA Content in this 6-APA Stage only.
Amoxicillin is an antibiotic useful for the treatment of a number of bacterial infections.
Amoxicillin was discovered in 1958 and came into medical use in 1972. It is on the World Health Organization's List of Essential Medicines, the most important medications needed in a basic system. It is one of the most commonly prescribed antibiotics in children. Amoxicillin is available as a medication. It has a wholesale cost in the developing world of between 0.02 and 0.05 USD per pill. In the United States ten days of treatment costs about 16 USD.
Ampicillin is an antibiotic used to prevent and treat a number of bacterial infections, such as respiratory tract infections, urinary tract infections, meningitis, salmonellosis, and endocarditis. It may also be used to prevent group B streptococcal infection in newborns. It is used by mouth, by injection into a muscle or intravenously. Like all antibiotics, it is not useful for the treatment of viral infections.
7-ACA (7-aminocephalosporanic acid) is the core chemical structure for the synthesis of cephalosporin antibiotics and intermediates. It can be obtained by chemoenzymatic hydrolysis of cephalosporin C.
In present studies, EDTA was used in preparation of drug intermediate and also the drug substance.
Titrimetric method is a convention cost effective analytical technique. The optimized titrimetric method was validated according to ICH guidelines to prove its suitability and reliability for the determination of EDTA in pharmaceutical drug substances during routine analysis.
Materials and Methods
Chemicals, reagents and samples
Analytical reagent grade of EDTA.2Na, Ammonia, Ammonium chloride, Copper sulfate from Merck chemicals, India. Water was distilled and purified with Millipore system (Millipore milford, MA USA), 6-Amino pencillic acid was provided by APL Research Centre-II(A Division of Aurobindo pharma limited).
Instrument
Auto titrator with titration vessel and ion selective electrode with reference electrode suggested system Metrohm titrino with electrode no:6.0502.140 and 6.0726.100.
Methods
Preparation of solutions
Preparation of Ammonia-Ammonium chloride buffer solution (pH 10): Dissolve 67.5 g of ammonium chloride in about 200 ml of water, add 570 ml of strong ammonia solution and dilute to 1000 ml water.
Preparation of copper sulphate solution 0.01M: Dissolve 2.5 g of copper sulphate penta hydrate in 1000 ml of water and standardise this solution using 50 ml of 0.1 N Standardized sodium thiosulfate solution.
Preparation of 0.1M Sodium thiosulphate: Weight and transfer about 25 g of Sodium thiosulphate and 0.2 g of sodium carbonate in a 1 litre volumetric flask containing 500 ml of water. Dissolve and make up to the mark with water. Allow to stand for 24 hours and standardize the solution.
Standardization
Accurately weigh and transfer about 0.06 g of potassium bromated into a clean and dry iodine flask. Note down the weight as W (g). Add about 50 ml water, 20 ml of hydrochloric acid solution and about 2.0 g potassium Iodide to the iodine flask and stopper immediately and allow to stand in the dark for exactly 10 minutes. Rinse the stopper and the inner walls of the flask with water and titrate with sodium thiosulphate solution until colour changes to pale yellow. Add 3 ml of starch solution as indicator and continue the titration until the blue colour is discharged. Note down the volume of sodium thiosulphate solution consumed in ml as V(1) ml. Perform a blank titration in duplicate and note down the average volume of sodium thiosulphate solution consumed in ml as V(2) ml.
Molarity (M)=W(g)/(V(1)-V(2)) × 0.02784
W(g)=Weight in g of potassium bromate
V(1) ml=Volume in ml of sodium thiosulphate solution consumed in the titration
V(2) ml=Average Volume in ml of sodium thiosulphate solution consumed in the blank titration
Repeat the mean of two values.
Note
The difference between the two values should not be more than 0.5%.Restandardize the solution as frequently as supported by laboratory stability data. In the absence such data, re-standardize the solution weekly. Whenever 0.01 M or 0.05 M or lower molar solutions required, dilute appropriately from 0.1 M and use.
Preparation of standard solution
Accurately weighed 1.5211 g of EDTA.2Na (Equivalent to 1.1948 g of EDTA) in a 250 ml volumetric flask sonic ate to dissolve by adding water to make up to the mark with water.
Preparation of sample solution
Accurately weigh and transfer 1g of sample in a clear titration vessel add 10 ml of pH 10.00 Buffer (ammonia ammonium chloride) sonicate to dissolve add 60 ml water. Then titration with 0.01 M Copper sulphate determine the end point potentiometrically note down the volume as V1(ml).Perform the Blank titration without sample addition note down the volume as V2 (ml).
EDTA Content (%w/w)=(V1(ml)-V2(ml)) × N × 29.22/Weight(g)
V1 (ml)=Volume in ml of copper sulphate solution consumed in the sample.
V2 (ml)=Volume in ml of copper sulphate solution consumed in the blank titration.
W1 (g)=Weight of the sample taken in grams
Results and Discussion
Method development activity
The most commonly used method for the determination of trace level ethylene diamine tetra acetic acid in pharmaceutical drug substance. The objective of this work is to determine trace level EDTA [5,6] in pharmaceutical drug substances. Any impurity other than the active moiety has to be controlled as a part of specification. This is the one impurity we are controlling with cost effective process. During method development 6-APA solubility was studied finally pH 10 Buffer (Ammonia ammonium chloride) chosen as a diluent to dissolve the sample. The following titration parameters are followed estimation of EDTA content.
Optimised titration parameters
Titration mode: MET U
Signal Drift: 50 mv/min
Min Wating time: 0 s
Max Waiting time: 26 s
Dosing Volume Increment: 0.02 ml
Dosing rate: Max
Stop volume: 2.5 ml
Potentiometric evalution
EP Criterion: 5 mv
EP Recogmition: Greatest
Initial Measured value signal drift: off
Solubility of 6APA
Based on trial and error method 6APA is not at all soluble in different solvents. Finally we have chosen pH 10 ammonia and ammonium chloride buffer. Initially for 1 g of sample 10 ml of pH 10 Ammonia ammonium chloride is sufficient to clear the solution after addition of 10 ml of buffer stir the solution until it will clear then add 60 ml water to proceed for the titration.
Method parameters: Instrument parameters.
Method validation
Method Validation [7,8] is the process used to confirm that the analytical procedure employed for a specific test is suitable for its intended use. Results from method validation can be used to judge the quality, reliability and consistency of analytical results; it is an integral part of any good analytical practice.
The potentiometric titration method was developed and validated according to International Conference on Harmonization (ICH) guidelines for validation of analytical procedures [9]. The method was validated for the parameters like Linearity, accuracy, system precision, Intra-day precision, Inter-day precision, intermediate precision/ Ruggedness, Robustness, Limit of detection (LOD) and Limit of quantitation (LOQ).
Specificity
Specificity is the ability of the method to measure the analyte response in the presence of all impurities related to drug substance, for specificity determination checking the interference of Blank, EDTA [9-11] spiked to drug substance at known concentration level and all known related substances of drug substance including EDTA [12-14] with known concentration level were prepared and analysed and Perform the EDTA Content the percentage difference between EDTA content in spiked individually and spiked with known related substance was determined. Calculate the percentage difference between spiked and unspiked.
Linearity
Standard solutions of EDTA at different concentrations were prepared. Calibration curve was performed by plotting the concentration level of EDTA (Ethylene di amine tetra acetic acid) versus corresponding volume of 0.01 M Copper sulphate consumed in the titration. Accurately weighed 1.5211 g of EDTA.2Na (Which is equivalent to EDTA) in a 250 ml volumetric flask sonicate to dissolve and make up to the mark with water. To this take separately with micro pipette 100 μl, 150 μl, 200 μl, 250 μl, 300 μl to all the solutions add 10 ml of PH:10 buffer add 60 ml water swirl well to dissolve then titrate with 0.01 M Copper sulphate solution determine the end point potentiometrically note down the volume as V1 (ml). Calibration curve was constructed by plotting the concentration of EDTA (in mg) versus volume of 0.01 M Copper sulphate solution. The result show an excellent correlation between volume of copper sulphate consumed and concentration of EDTA with in the concentration range (w.r.t sample concentration 0.05% to 0.15%) are given. The correlation coefficient was greater than 0.999, which meet the method validation acceptance criteria and hence the method is said to be linear (Table 1).
| n | EDTA standard (mg) | Cuso4 consumed(ml) |
|---|---|---|
| 1 | 0.4792 | 0.1772 |
| 2 | 0.7188 | 0.2568 |
| 3 | 0.9584 | 0.3520 |
| 4 | 1.1980 | 0.4208 |
| 5 | 1.4376 | 0.5142 |
| Regression equation | y=0.3497x+0.0090 | |
| Correlation coefficient (r2) | 0.9991 | |
Table 1: Calibration data for EDTA
LOD and LOQ (Limit of detection and Limit of quantification) precision
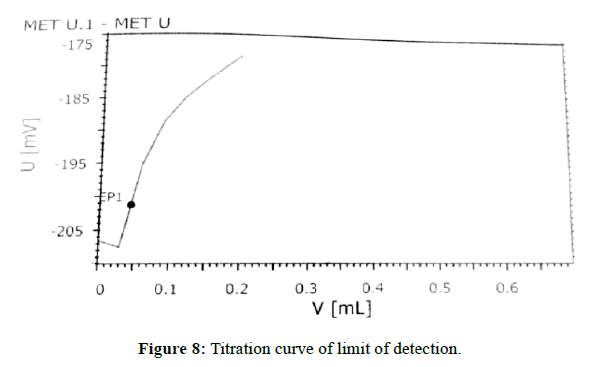
From The linearity study Limit of detection, Limit of quantification was found to be 0.0062% and 0.0189%. But the actual response of EDTA By titrimetric LOD,LOQ values are 0.0160% and 0.0350%.We have chosen Limit of Detection(LOD) is 0.0160 and Limit of quantification (LOQ) is 0.0350 and it is verified by preparing LOD, LOQ precision experiment. The RSD of LOD is less than 33% and LOQ is 10%. The LOD and LOQ Solutions were prepared at about predicted concentration levels and analysed six times for checking precision (Table 2).
| n | EDTA Content(%w/w) |
|---|---|
| 1 | 0.0151 |
| 2 | 0.0148 |
| 3 | 0.0136 |
| 4 | 0.0181 |
| 5 | 0.0181 |
| 6 | 0.0171 |
| Mean | 0.0161 |
| SD^ | 0.0019 |
| %RSD* | 11.8 |
| ^ Standard deviation * Relative standard deviation |
|
Table 2: Limit of De tection for precision.
LOD and LOQ (Limit of detection and Limit of quantification)
The LOD and LOQ Solutions were prepared at predicted concentration and analysed as per the method the RSD was found to be less than 10% for LOQ and 33% for LOQ (Table 3).
| n | EDTA Content(%w/w) |
|---|---|
| 1 | 0.0356 |
| 2 | 0.0362 |
| 3 | 0.0362 |
| 4 | 0.0347 |
| 5 | 0.0335 |
| 6 | 0.0356 |
| Mean | 0.0353 |
| SD^ | 0.001 |
| %RSD* | 2.83 |
^ Standard deviation
* Relative standard deviation
Table 3: Limit of Quantification for precision
Precision
System precision
System precision was demonstrated by preparing standard solution at about 0.05% level and performed the titration six times and calculated EDTA Content. %RSD (Relative Standard Deviation) less than 5 concerning EDTA Content which indicates the acceptable reproducibility and thereby the precision of the system. System precision results are tabulated in (Table 4).
| n | EDTA Content(%w/w) |
|---|---|
| 1 | 0.0584 |
| 2 | 0.0599 |
| 3 | 0.0539 |
| 4 | 0.0570 |
| 5 | 0.0597 |
| 6 | 0.0602 |
| Mean | 0.0582 |
| SD^ | 0.0024 |
| %RSD | 4.12 |
^ Standard deviation
* Relative standard deviation
Table 4: System precision results of EDTA.
Method Precision
Method precision was demonstrated by preparing six separate sample solutions were prepared using single batch of pharmaceutical drug substance spiking with known amount of EDTA spiked in sample solution and calculate the EDTA Content. Method precision results are tabulated in (Table 5).
| No. | EDTA Content(%w/w) |
|---|---|
| 1 | 0.0603 |
| 2 | 0.0500 |
| 3 | 0.0532 |
| 4 | 0.0560 |
| 5 | 0.0533 |
| 6 | 0.0480 |
| Mean | 0.0535 |
| SD^ | 0.004 |
| %RSD* | 8.22 |
^ Standard deviation
* Relative standard deviation
Table 5: Method precision results of EDTA (0.05%) spiked in 6-APA.
Ruggedness (Intermediate precision)
Intermediate precision was performed by preparing six separate sample solution using single batch of pharmaceutical drug substance spiking with known amount of EDTA by different day, different analyst, different system and different electrode.
Accuracy
Accuracy of the method was performed by recovery experiment using standard addition method technique. The recoveries of I, II and III were determined by spiking EDTA at three different levels ranging from 0.05% to 0.15% into drug substance. These samples were prepared as per the procedure and analysed in triplicate and the percentage recoveries were calculated. The recovery value of EDTA Ranged from 98 % to 100.5%.The average recovery of three levels (Nine determinations).The accepted limits of recovery are 98 % to 100.5% and all observed date are within the required range which indicates good recovery values and hence the accuracy of the method developed (Table 6).
| Accuracy (Average of triplicates) |
Level-I (LOQ) | Level-II (100%) | Level-III (150%) |
|---|---|---|---|
| Amount Added (%) | 0.0535 | 0.1064 | 0.1554 |
| Amount Found (%) | 0.0535 | 0.1044 | 0.1554 |
| Recovery (%) | 100.0 | 98.09 | 100.0 |
| RSD (%) | 1.35 | 0.31 | 1.00 |
Table 6: Recovery results from spiking of 6-APA with EDTA.
Robustness
The Robustness of an analytical method is found to be robust by performing small variations in the analytical method parameters it will not affect the results. Based on this study it is concluded that the method is Robust.
Sensitivity
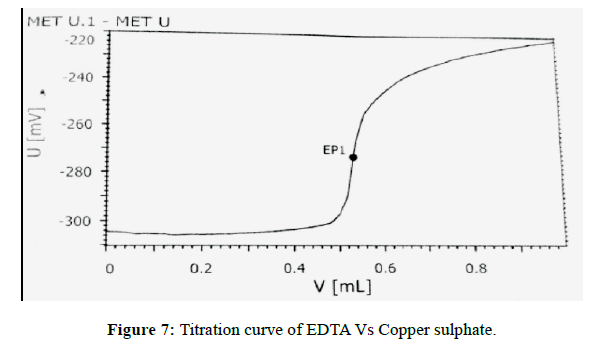
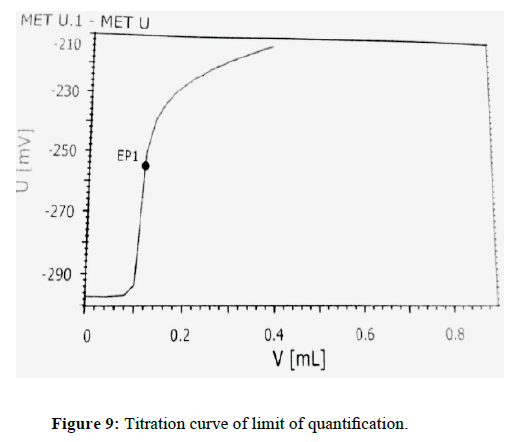
The sensitivity of measurement of EDTA content (standard) (Figure 7) by use of the proposed method was estimated in terms of the limit of quantitation (LOQ), Limit of detection (LOD). The limit of detection (LOD) (Figure 8) and Limit of quantitation (LOQ) (Figure 9) were found to be 0.0160% and 0.0350% respectively. Optical characteristics results are summarized in (Table 7).
| Parameters | Results |
|---|---|
| Linearity range (%w/w) | 0.0350-0.150 |
| Regression equation (y=mx+c) | y=0.3497x+0.0090 |
| Correlation coefficient (r2) | 0.9991 |
| LOQ (%w/w) | 0.0350 |
| LOD (%w/w) | 0.0160 |
Table 7: Optical characteristics of EDTA content in pharmaceutical drug substances.
Conclusion
Quantification of EDTA content Method was developed in pharmaceutical drug substances and validated as per the ICH [15] Guidelines.
Acknowledgements
The authors express their sincere gratitude to APL Research Centre-II (A division of Aurobindo Pharma Ltd) located at Hyderabad, India, for providing the analytical support to pursue this work and are also grateful to colleagues who helped us in this work and also thankful to the authorities of Andhra university.
References
- Heydari R, Shamsipur M, Naleini N (2013) Simultaneoous determination of EDTA, Sorbic acid and Diclofenac sodium in pharmaceutical preparation using High-Performacne Liquid chromatography. AAPS PharmSciTech 14: 764-769.
- Cagnasso CE, Lo´pez LB, Rodrı´guez VG, Valencia ME (2007) Development and validation of a method for the determination of EDTA in non-alcoholic drinks by HPLC. J Food Comp Anal 20: 248-251.
- Johnston MB, BernardJr AJ, Flaschka HA (1958) EDTA and complex formation. J Chem Educ 35: 601.
- Bergers PJM, de Groot AC (1994) The Analysis of EDTA in water by HPLC. Water Research 28: 639-642.
- MR Seely D, Wu P, Mills EJ (2005) EDTA chelation therapy for cardiovascular disease: a systematic review. Cardiovasc Disord 5: 32.
- Szekeres L (1972) Determination of chromium by EDTA titration. Microchem J 17: 360-363.
- Narola B, Singh AS, Mitra M, Santhakumar PR, Chandrashekhar TG (2011) A validated reverse phase HPLC method for the determination of disodium EDTA in meropenem drug substance with UV-detection using precolumn derivatization technique. Anal Chem Insights 6: 7-14.
- Oviedo C, Rodríguez J (2003) EDTA: the chelating agent under environmental scrutiny. Quím Nova 26: 6.
- Zhao HY, Lin LJ, Yan QL, Yang YX, Zhu XM, et al. (2011) Effects of EDTA and DTPA on lead and zinc accumulation of ryegrass. J Environ Prot 2: 932-939.
- Goonasekera C, Tennakoon R, Rajakrishna PN, Gunasena GA, Wanniarachchi CR, et al. (2010) The Effect of EDTA Chelation Therapy in Symptomatic Coronary Heart Disease: An Observational Study. Chinese Medicine 1: 49-54.
- Baffour A, Quao E, Kyeremeh R, Mahmood SA (2013) Prolong storage of blood in EDTA has an effect on the morphology and osmotic fragility of erythrocytes Samuel. J Biomed Sci Eng 1: 20-23.
- Van der Schaar PJ, Pahlplatz RTB, Blaurock-Busch E (2014) The Effects of Magnesium-EDTA Chelation Therapy on Arterial Stiffness. Health 6: 2848-2853.
- Sugiyama T, Dabwan AHA, Katsumata H, Suzuki T, Kaneco S (2014) Optimization of Conditions for the Photocatalytic Degradation of EDTA in Aqueous Solution with Fe-Doped Titanium Dioxide. OJINM 4: 28-34.
- Validation of compendial procedures USP <1225>.
- International Conference on Harmonization of Technical Requirement for Registration of Pharmaceuticals for Human use. ICH harmonized tripartite guideline. Validation of analytical procedures text and methodology Q2 (R1).

Open Access Journals
- Aquaculture & Veterinary Science
- Chemistry & Chemical Sciences
- Clinical Sciences
- Engineering
- General Science
- Genetics & Molecular Biology
- Health Care & Nursing
- Immunology & Microbiology
- Materials Science
- Mathematics & Physics
- Medical Sciences
- Neurology & Psychiatry
- Oncology & Cancer Science
- Pharmaceutical Sciences
