ISSN : ISSN: 2576-1412
Journal of Applied Microbiology and Biochemistry
Characterization of an Alcohol Dehydrogenase of the Hyperthermophilic Archaeon Hyperthermus Butylicus
Ching Tse, Nasser E Ibrahim and Kesen Ma*
Department of Biology, University of Waterloo, Waterloo, Ontario, Canada
- *Corresponding Author:
- Kesen Ma
Department of Biology
University of Waterloo, 200 University Avenue West
Waterloo, Ontario N2L 3G1, Canada
Tel: 1-519-8884567, Extn: 33562
Fax: 1-519-746-0614
E-mail: kma@uwaterloo.ca
Received Date: October 04, 2017; Accepted Date: October 23, 2017; Published Date: October 31, 2017
Citation: Tse C, Ibrahim NE, Ma K (2017) Characterization of an Alcohol Dehydrogenase of the Hyperthermophilic Archaeon Hyperthermus Butylicus. J Appl Microbiol Biochem Vol.2 No.1:2
Abstract
Hyperthermus butylicus is a peptide-fermenting hyperthermophilic archaeon producing 1-butanol as an end-product. The pathway for 1-butanol production in H. butylicus is unknown. Alcohol dehydrogenase (ADH) is a key enzyme responsible for alcohol production, which has to be present in H. butylicus, however, the gene encoding the enzyme is unknown. From the H. butylicus genome sequence, the gene Hbut_0414 is the only one annotated as an zinc-containing ADH, but it was unclear if it would be the enzyme catalyzing the production of 1-butanol. The gene was cloned and overexpressed in Escherichia coli. The recombinant enzyme encoded by Hbut_0414 was shown to be an NAD(H)-specific primary/secondary ADH capable of using a wide range of substrates including butyraldehyde and butanol. Optimal pH values for catalyzing aldehyde reduction and alcohol oxidation were of 5.0 and 8.5 respectively. Apparent Km values for acetaldehyde, propanal, acetone, butyraldehyde, ethanol, 1-propanol, 2-propanol and butanol were 0.61 ± 0.11, 0.41 ± 0.07, 1.41 ± 0.19, 1.75 ± 0.29, 1.79 ± 0.17, 2.30 ± 0.24, 4.85 ± 0.21 and 1.68 ± 0.15 mM, respectively. The specificity constant kcat/Km for propanal was the highest (15,975 s-1M-1) compared to that of butyraldehyde (1120 ± 345 s-1M-1). Its optimal temperature was found to be 60°C, and it lost 50% of its activity when incubated at 60°C for 3 hours, and 85% of its activity when incubated at 95°C for 5 min. It is unlikely that the ADH is functional for catalyzing the production of 1-butanol in H. butylicus growing optimally at 95°C. Further investigation is required for identifying the ADH responsible for catalyzing the 1-butanol production in this hypertehrmophilic archaeon.
Keywords
Hypertermophile; Hyperthermus Butylicus; Butanol; Alcohol dehydrogenase; Archaea; Thermostability; Propanal; Butyraldehyde
Introduction
Hypertehrmus butylicus is a peptide-fermenting and sulfurreducing archaeon belonging to Crenarchaeota isolated from the sea floor, a solfataric habitat of the coast of Sao Miguel, Azores [1]. H. butylicus is a neutrophil with a sharp optimal pH at 7.0 and optimal salt concentration of 17 g/L NaCl [1]. It grows between 80°C to 108°C with optimal growth temperatures between 95°C to 106°C [1]. It utilizes peptide mixtures as carbon and energy sources and all the enzymes of the gluconeogenesis pathway were found in the genome sequence [1,2].
Major metabolic end-products from fermentation are detected by using gas chromatography-mass spectroscopy and nuclear magnetic resonance spectroscopy [1]. About 0.67 mM of 1-butanol, a similar amount of acetic, propionic and phenylacetic acids, and very small amounts of hydroxyphenylacetic acid, propylbenzene, acetophenone, and hydroxyacetophenone were detected [1], suggesting they are probably formed from metabolizing different amino acids. Acetic acid is formed from alanine and glycine [3]; propionic acid is from leucine, isoleucine or valine [4] phenylacetic acid is from phenylalanine and hydroxyphenylacetic acid is from the metabolism of tyrosine [5]. The metabolic pathway for 1-butanol production in H. butylicus has not been elucidated and no homolog of the bacterial acetoacetate-butyrate/acetate CoA transferase is found in the genome, which is essential for 1-butanol production in Clostridium species [6].
Butanol dehydrogenase, the only enzyme known for catalyzing butanol production, must be present. The study of this enzyme serves as an initial step to understand the physiological importance of the pathway. One ADH homolog is annotated in the genome of H. butylicus, Hbut_0414 (WP_048061395). It is deduced to have the closest similarity with a zinc-containing ADH. The gene has 843 base pairs encoding a protein of 280 amino acid residues. This sequence also has 37.3% and 27.9% identity with Zn-containing ADH from Pyrolobus fumarii and Streptomyces sclerotialus, respectively. It is highly possible that this gene could encode a functional alcohol dehydrogenase (ADH) and characteristics of the ADH might help understand its potential role in 1-butanol production in H. butylicus, which may further help us to optimize microbial butanol production and advance our understanding of thermostable ADHs in Crenarchaeota.
Materials and Methods
Microorganisms and chemicals
H. butylicus (DSM 5456) from the Deutsche Sammlung von Mikroorganismen und Zellkulturen, Germany, E. coli DH5α [(supE44 ΔlauU 169 Φ80 lazZΔM15) hsdR17 recAlgyrA96 thi-1 relAl] (Biomedical Research Laboratories, CA, USA) and E. coli BL 21 (DE3)-Rosetta [F-, ompT, hsdSB (rB-mB -) gal dcm lacY1, pRARE (CamR)] (Strategene, CA, USA) were used for this study. All chemicals were commercially available.
Growth of microorganisms
H. butylicus was grown in medium as described by Zillig et al. [1]. The preparation of trace elements solution was prepared according to the DSMZ formula with modifications from Balch [7].
E. coli was grown in LB media (Difco, New Jersey) with 10 g/L of tryptone, 5 g/L of yeast extract and 10 g/L of NaCl in a shaking incubator at 180-2000 rpm at 37°C. For the recombinant stock of E. coli, a single colony was picked from an LB agar plate containing 50 μg/ml kanamycin and inoculated into a 5 ml liquid LB media with the same selective antibiotic. It was then grown at 37°C with vigorous shaking until OD600 0.6-0.8. Then an aliquot (0.8 ml) of the bacterial culture was transferred to a sterilized cryo-vial containing 0.5 ml of 50% glycerol. After gently mixing the culture, it was stored at -20°C or -80°C for short and long term storage, respectively.
Isolation of genomic DNA
The genomic DNA from H. butylicus was isolated from 0.2 g of wet cells. After the lysis of the cells using lysozyme and SDS, the sample was treated with 1 mg/ml proteinase K and 5 M NaCl. DNA from the mixture was isolated using a solution of phenol, chloroform, and isoamyl alcohol (25:24:1). The genomic DNA was precipitated by using 100% isopropanol and desalted with 75% ethanol. The quality and quantity of DNA were measured using a NanoDrop spectrophotometer and running on a 1% agarose gel for visualization respectively.
Gene cloning and expression
The target gene Hbut_0414 was amplified from genomic DNA using primers HButF1, HButF2, HButR1, and HButR2 (Table 1). HButF1 and HButR1 were designed at the 5’ and 3’ region of the gene and HButF2 and HButR2 were designed at the termini of the open reading frame. Primers were designed with software Primer Premier5 (Premier Biosoft, USA) and parameters were optimized. Two rounds of PCR were performed for confirming the correct gene being amplified by PCR. The annealing temperature for primers in both rounds was at 55°C and amplified for 35 cycles. Taq DNA polymerase was used for amplifying the gene in a volume of 50 μl and all reagents were added according to standard conditions recommended by the manufactures. The PCR product was separated by electrophoresis on a 1.5% agarose gel to check for appropriate size and the PCR products were then purified using QIAquick PCR purification kit (Qiagen, Canada).
Table 1 List of primers used for cloning and sequencing the annotated zinc dehydrogenase gene (Hbut_0414).
| Name of Primers | Nucleotide sequence (5’- 3’) |
Restriction enzyme sites (underlined) |
|---|---|---|
| HbutF1 | GCGTGCCCAGCATTGTGATT | |
| HbutF2 | GGAATTCCATATGCAGCATGTCCAGCCACTAG | NdeI |
| HbutR1 | AACGGCGGCGGCAAGAACAC | |
| HbutR2 | GGCGAGCTCCTAGCCGAGCCTATACACTAGACCC | XhoI |
| T7 terminator | GCTAGTTATTGCTCAGCGG |
The expression vector for Hbut_0414 was constructed through the following procedures. Hbut_0414 was isolated and amplified by gene specific primers with appropriate restriction enzyme sites. The forward primers HbutF2 was linked to NdeI recognition site and the reverse primer HbutR2 was liked to XhoI recognition site. The gene was amplified by PCR with initial denaturation at 95°C for 5 minutes, followed by 35 cycles of denaturation at 95°C for 30 seconds, annealing at 55°C for 30 seconds and extension at 72°C for 1 minute and a final extension step at 72°C for 10 minutes. The PCR products were purified using QIAquick PCR purification kit (Qiagen, ON, Canada) and digested with NdeI and XhoI to create sticky ends for ligation. The digestion was performed at 37°C for 30 minutes to 1 hour using 10-20 U of restriction enzyme per 0.5-1.5 μg DNA. After completion of the restriction digestion, the reaction mixture was analyzed on a 1.5% agarose gel.
The expression vector pET30a, 5630bp, PT7, KanR (Novagen, WI, USA) with similar cut ends was used for ligation. The insert to vector molar ratio was in 3:1 to optimize the ligation and the ligation was performed using 1U T4DNA ligase (Fermentas, Canada) and incubation at 16°C overnight.
The ligation mixture (3 μl) was transformed into E. coli DH5α by standard heat stock method of heating at 42°C for 45 seconds. After recovery on ice for 30 minutes, E. coli was plated on an agar plate containing 50 μg/ml of kanamycin. Colony PCR was performed with primers HbutF2 and T7 terminator to select colonies with the inserted plasmid and gene of interest. The same colony was then grown in 5 ml LB media with 50 μg/ml kanamycin for plasmid extraction with a plasmid extraction kit (Bio Basic Inc, Canada) the next day. After plasmid extraction, the plasmid was digested with the same restriction enzymes used in cloning to verify the gene insert. The recombinant plasmids were sent to the Centre for Applied Genomics at the University of Toronto for sequencing.
The recombinant plasmid that was confirmed to have the inserted gene was transformed into the E. coli Rosetta 2 expression strain using standard heat shock method. As H. butylicus genes have a very different codon usage compared to E. coli, E. coli Rosetta 2 was chosen as it contains 6 tRNAs for rare codons (AGG, AGA, CGG, AUA, CUA, CCC, and GGA). The transformation mixture was spread onto an agar plate supplemented with 50 μg/ml kanamycin and 34 μg/ml chloramphenicol for selection of E. coli colonies that contained the constructed plasmids.
For expression of the cloned gene in E. coli Rosetta 2, the transformants were grown in LB medium at 37°C before induction. Recombinant protein expression was driven by the T7- lac promoter and the recombinant enzyme was obtained when IPTG was added. The concentration of IPTG, temperature of induction and cell density at which the IPTG was added affected the final yield of the recombinant protein. To optimize the yield, the inducer IPTG was added in the exponential phase when the OD600nm of the E. coli culture reached 0.4-1.0, and the ideal yield with the highest activity presented is when the cell culture reached OD600nm of 0.8. Different concentrations of IPTG, 0.1 mM, 0.2 mM, 0.4 mM, 0.6 mM, 0.8 mM and 1.0 mM and different temperatures 18°C, 25°C, 30°C and 37°C were tested to optimize recombinant protein expression. Whole cells lysates of E. coli were run on SDS-PAGE for visualization of recombinant protein overexpression. The culture was then induced with 0.6 mM of IPTG and cultivated at 30°C for 12-16 hours prior to harvesting of the cells.
Assay of alcohol dehydrogenase
The ADH assay was based on monitoring the substrate-dependent absorbance change of NADP(H) at 340 nm (ε340 = 6.3 mM-1cm-1). Unless otherwise specified, the enzyme assay was carried out in duplicate using the assay mixture (2 ml) for alcohol oxidation containing 60 mM 1-butanol and 0.4 mM NAD(P) in 100 mM EPPS (4-(2-Hydroxyethyl)-1-piperazinepropanesulfonic acid, pH 8.5) buffer. The assay mixture (2 ml) for reduction of ketone/ aldehyde contained 30 mM butyraldehyde and 0.4 mM NAD(P) H in 100 mM citrate acid, pH 5.0. The addition of the appropriate amount of purified enzyme initiated the enzyme assay. One unit of activity is defined as 1 μmol of NAD(P)H formed or oxidized per min.
Preparation of cell-free extract
The steps for the preparation of cell-free extracts were carried out anaerobically. Frozen cells were transferred into a degassed serum bottle and immediately sealed with a gray butyl stopper and capped with an aluminum seal. The bottle was immediately degassed for 30 minutes and pressurized by 3 psi N2 gas. Lysing buffer contained 50 mM Tris-HCl at pH 7.5, 2 mM sodium dithionite, 2 mM dithiothreitol, 0.1 mg/ml lysozyme, and 0.01 mg/ml DNase I (Sigma, Oakville). Lysing buffer was then degassed. The volume of anaerobic lysis buffer was about five times the weight of the cells (v/w). The lysing buffer was then anaerobically transferred with a syringe to the degassed serum bottle containing the cells and the cell suspension was stirred with a magnetic stirrer at 37°C for 2 hours. To achieve complete breakage of cells, the cell suspension was then transferred into a French Press cell (Thermo scientific, MA) and lysed at 25,000 psi. The lysis mixture was centrifuged at 8,000 rpm for 15 minutes at 4°C to separate the cell-free extract and cell debris. The cellfree extract was then transferred anaerobically into a degassed serum bottle for further use.
Purification of ADH
AKTA™ Fast Performance Liquid Chromatography (FPLC), a liquid chromatography system with P-920 pump (Amersham Pharmacia Biotech) was used to purify the enzyme under anaerobic conditions using Tris-HCl buffer (pH 7.8) at room temperature. Buffer A consisted of 50 mM Tris-Base, 5% (v/v) glycerol, 2 mM sodium dithionite and 2 mM dithiothreitol. The buffer was filtered using a vacuum filtration device, degassed and maintained at an overpressure of 3 psi N2. Three columns were run in series for the purification of the recombinant ADH. The CFE was first loaded on a DEAE-Sepharose column (3 cm x 5 cm, column volume [CV] 35 ml) that was equilibrated with 70 ml of buffer A. Buffer B was prepared by dissolving 2 M NaCl in buffer A. The bound proteins onto the column were eluted with a gradient of 3 CV buffer B from 12% to 35% and the ADH was eluted when 0.3 M of buffer B was applied to the column at a flow rate of 2ml/min. Fractions containing the ADH activity were combined and loaded onto a hydroxyapatite (HAP) column equilibrated with Buffer A (2.6 cm × 12 cm) at a flow rate of 1.0 ml/min. Buffer C (0.5 M phosphate in buffer A) from 35% to 100% was applied to the column in 3 CV. ADH started to elute from the column when 0.5 M potassium phosphate buffer was applied to the column. Fractions containing the ADH activity were then pooled and applied to a phenyl-Sepharose column (5 cm x 10 cm) that was equilibrated with 2.0 M (NH4)2SO4 in buffer A at a flow rate of 2 ml/min. A linear decreased gradient from 0.82 M to 0 M (NH4)2SO4 was applied to the column and ADH started to elute out when 0.0 M of (NH4)2SO4 was applied. Fractions containing the ADH activity were combined, concentrated and desalted with ultrafiltration using a Ultracel PL 10 membrane (EMD Millipore Ultracel, ON).
Determination of ADH native molecular mass
The purified ADH was loaded onto a Superdex 200 gel filtration column (2.6 × 60 cm: Amersham Biosciences) after the phenyl- Sepharose column to determine the molecular mass of its native form. The column was first equilibrated with 50 mM Tris-HCl (pH 7.8) containing 100 mM KCl. The size of its native form was calculated based on the elution volumes of standard proteins (Pharmacia, NJ, USA) that contained blue dextran (molecular mass, Da, 2,000,000), thyroglobulin (669,000), ferritin (440,000), catalase (232,000), aldose (158,000), bovine serum albumin (67,000), ovalbumin (43,000), chymotrypsinogen A (25,000) and ribonuclease A (13,700).
Determination of optimum pH and temperature dependency
The optimal pH values for alcohol oxidation and aldehyde/ketone reduction of the purified ADH were determined by enzyme assay of 1-butanol oxidation and butyraldehyde reduction. The standard enzyme assay was performed with 100 mM buffer at different pH at 60°C. The optimal pH for oxidation was determined using buffers HEPES (7.5, 8.0), EPPS (8.0, 8.5, 9.0) and glycine (9.0, 9.5, 10.0). The optimal pH for reduction was determined using citrate (4.5, 5.0, 5.5, 6.0) and PIPES (6.0, 6.5).
The effect of temperature on the enzyme activity was examined at temperatures between 30°C to 80°C using the standard enzyme assay described above. Thermostability of the ADH was also examined at 60°C, 75°C and 95°C. Residual activities were measured after different time intervals of incubation and compared to the initial activity without incubation at high temperatures.
Determination of oxygen sensitivity
The effect of oxygen on enzyme activity was investigated by determining the residual activity after exposure of the purified ADH to air at room temperature under stirring. The residual activities of each sample at different time intervals were measured using the standard assay.
Determination of substrate specificity and enzyme kinetics
Substrate specificity of the purified ADH was determined using primary (C1-8) and secondary (C3-C6) alcohols, diols (C3-5) and glycerol at 60 mM or aldehydes (C2-4), benzaldehyde and ketone (C3-4) at 30 mM under optimal enzymatic conditions determined.
Enzyme kinetic parameters were determined using different substrates and cofactors (NAD(P)+ or NAD(P)H). For the oxidation reaction, 1-propanol, 2-propanol, ethanol, and 1-butanol were used and the corresponding ketone acetone and aldehydes propanal, butyraldehyde and acetaldehyde for reduction were used for determining the respective Km and kcat. NAD(H) was the cofactor used. Unless specified, various substrates with concentrations from 0 to ≥ 10 Km unless specified were used to determine the corresponding activity. Substrate was prepared at a concentration of 0.3 M and different volumes (2.5-200 μl) of the solution were added into the enzyme mixture to achieve different final concentrations of the substrates. The concentration of the corresponding cofactor was kept constant, which was ≥ 10 Km. Apparent values of Km and kcat were calculated using the nonlinear curve fittings of the Michaelis-Menten equation  from GraphPad Prism (GraphPad Software, Inc, CA).
Protein sequence analysis
The ADH sequences used in sequence alignments were from the database available at https://www.ncbi.nlm.nih.gov/guide/ proteins/. Protein alignments were done using the online software Clustal Omega (https://www.ebi.ac.uk/Tools/msa/clustalo/). Conserved domains were identified from the conserved domains database (https://www.ncbi.nlm.nih.gov/cdd/).
Other methods
The Bradford assay was used to measure protein concentrations in solutions using a spectrophotometer [8]. Bio-Rad reagent 200 μl was added into 800 μl of diluted protein solution and a control was set by replacing the protein solution with 800 μl deionized water. A linear calibration curve was constructed with known concentrations of standard protein bovine serum (BSA, albumin fraction V). The absorbance reading was taken at 595 nm.
SDS-PAGE was performed using a Hoefer Mighty Small 250 mini system (Amersham Biosciences, Montreal) based on the methods by Laemmli [9]. Protein samples for SDS-PAGE were prepared by heating in boiling water for 10 minutes in 1x sample loading buffer (0.1 M sodium phosphate buffer, 4% SDS, 10% 2-mercaptoethanol, 20% glycerol, pH 6.8). The protein samples were loaded onto an SDS-PAGE (12.5% acrylamide) and was run under a constant voltage of 150 V. The gel was then stained with Coomassie Brilliant Blue R250 for at least one hour on a shaker at approximately 100-150 rpm. It was followed by destaining with a destaining solution (15% methanol, 10% glacial acetic acid and 75% deionized water) until protein band(s) started to become visible. The molecular mass of the enzyme under denaturing conditions was estimated by using the protein marker Extended PS 13 (5- 245 kDa, GeneON, Germany).
Results
Sequence analysis of Hbut_0414
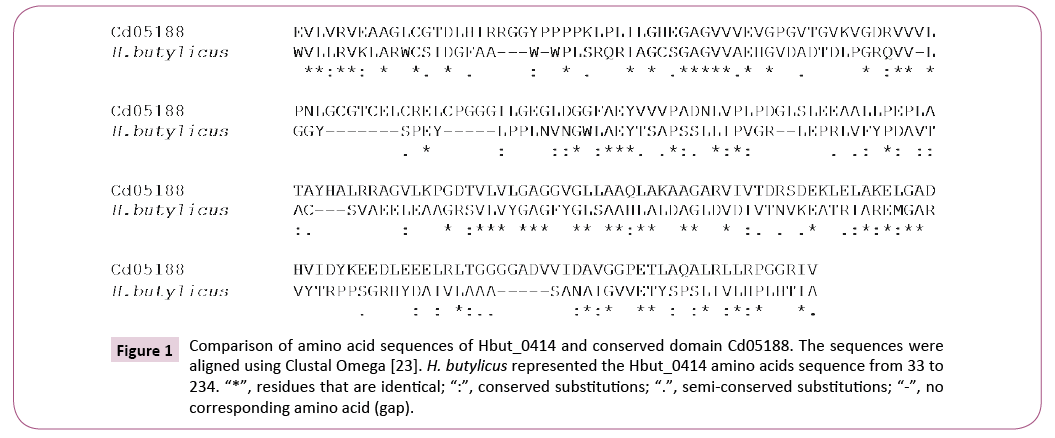
The gene Hbut_0414 has 843 bp with a deduced 280 amino acids sequence. The molecular weight was calculated to be 30,581 Da. It belongs to the superfamily of Zn-dependent alcohol dehydrogenase. This classification is based on a 29.4% overall identity between the sequence (amino acid 33 to 234) and the conserved domain (cd05188) corresponding to Zndependent alcohol dehydrogenase-like family (Figure 1). The sequence also has the lowest e-value with Zn-dependent alcohol dehydrogenase-like family. Members of this family have two signature domains including a C-terminal NAD(P) binding- Rossmann fold domain of a β-α form and an N-terminal catalytic GroES-like domain. ADHs in this superfamily contain zinc metal, and some have binding motifs for both catalytic and structural zinc while others have only the motif for binding catalytic zinc.
Figure 1: Comparison of amino acid sequences of Hbut_0414 and conserved domain Cd05188. The sequences were aligned using Clustal Omega [23]. H. butylicus represented the Hbut_0414 amino acids sequence from 33 to 234. “*”, residues that are identical; “:”, conserved substitutions; “.”, semi-conserved substitutions; “-”, no corresponding amino acid (gap).
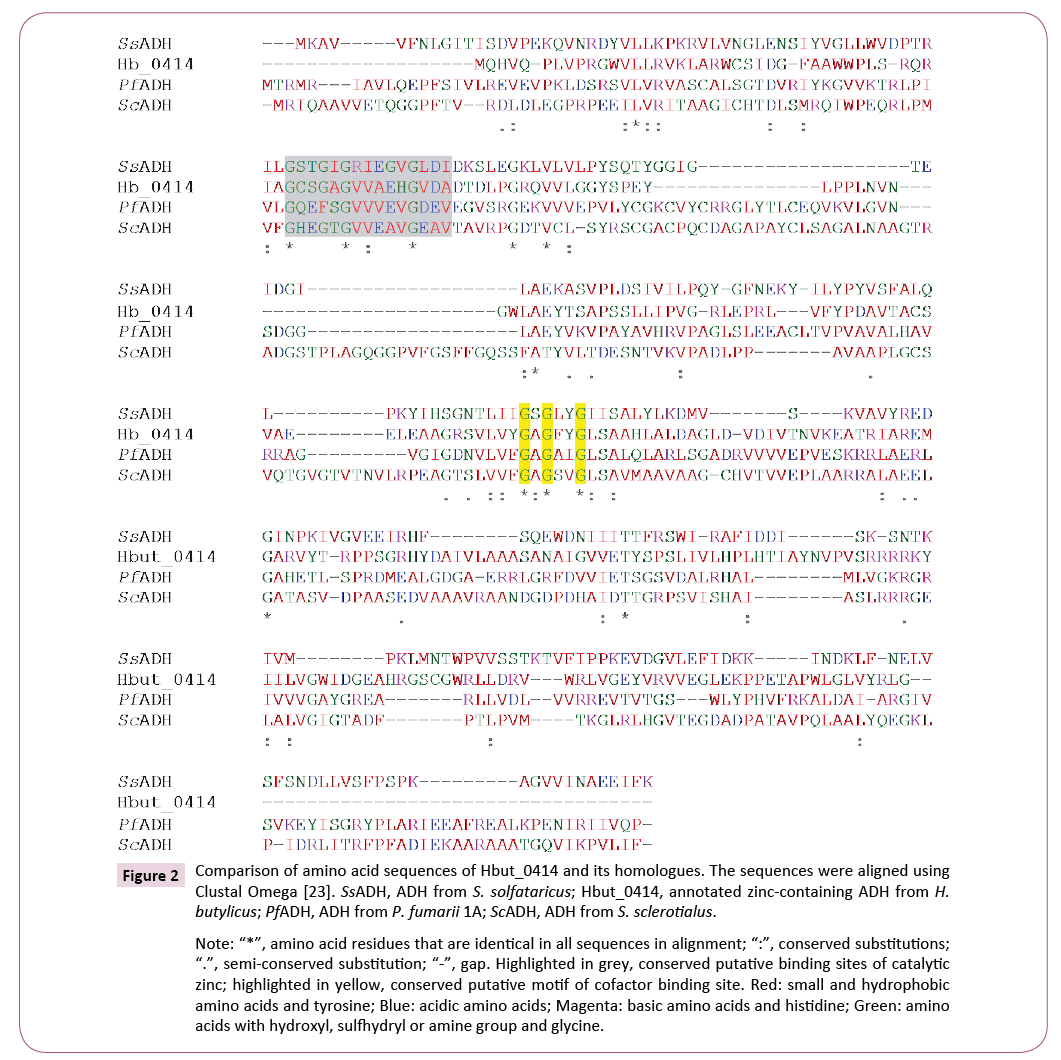
Hbut_0414 amino acid sequence had relatively low overall identities (24.9% to 37.3%) with other Zn-containing ADHs in hyperthermophiles (https://blast.ncbi.nlm.nih.gov/Blast. cgiPROGRAM) compared to other thermophilic ADHs that belong to the same group of Zn-containing ADHs that can have an overall identity in the range of 70 to 80% [10]. Through blast search, the sequence showed comparative higher overall identities with ADHs from Crenarchaeota, the same phylum as H. butylicus and interestingly mesophilic bacteria as well. These include ADHs from Pyrolobus fumarii (37.3% identity, WP_014026672.1), Staphylothermus hellenicus (27.9%, WP_013143693.1), Sulfolobus solfataricus (26.8%, WP_009988924.1), Pyrobaculum islandicum (25.0%, WP_014026672.1), Desulfurococcus fermentans (24.9% identity, WP_048815804.1) and ADHs from mesophilic bacteria Streptomyces sclerotialus (28.8% identity, WP_030623043.1) and Vibrio sp. EJY3 (29.3% identity, WP_014232168). In the sequence alignment with the mesophilic and hyperthermophilic ADHs, amino acids sequence of Hbut_0414 had the conserved cofactor NAD(P) binding motif (GXGX2G, residues 130-135) but the catalytic zinc binding motif is modified from GHEX2GX5GX2V to GCSX2GX5GX2A (residues 41-55) [11]. This catalytic Zn-binding motif is also modified in the other ADHs compared (Figure 2). Cysteine is also an amino acid for coordinating Zn and the replacement of glutamic acid by serine and valine by alanine are semi-conserved substitutions. Moreover, a structural Zn-binding motif site was not found in all the sequences compared.
The amino acid composition of Hbut_0414 and its mesophilic and thermophilic ADH homologs were compared. As the Hbut_0414 protein has 100 fewer amino acids than the other Zn-containing ADHs compared, the percentage of each amino acid was used for comparison. The primary amino acid sequence analysis revealed that Hbut_0414 and ADH from its thermophilic homolog P. fumarii had apparent higher percentages of hydrophilic amino acid Val, Leu and lower percentages of Phe and Ala than ADH from mesophilic homolog Vibrio sp. EJY3. Also, Hbut_0414 had noticeable higher percentages of small hydrophobic amino acid Arg, Pro, and Tyr than P. fumarii ADH. The amino acid composition of the protein encoded by Hbut_0414 was also compared to well-characterized hyperthermophilic Zn-containing ADHs from S. solfataricus P2 (28.7% identity, WP_009988924) and T. guaymasensis (23.4% identity). Both ADHs have optimal enzyme activity above 80°C [11,12]. T. guaymasensis is from the phylum Euryarchaeota, whereas S. solfataricus P2 is from the phylum Crenarchaeota. In comparison, Hbut_0414 had higher percentages of hydrophobic amino acids Val, Leu, Ala, and Pro but a lower percentage of charged amino acid Lys compared to both S. solfataricus P2 and T. guaymasensis ADHs.
Cloning of Hbut_0414
H. butylicus genomic DNA (gDNA) was isolated in a high purity (1,028 ng/μl). It was used as the template for the amplification of Hbut_0414 directly by two rounds of PCR for ensuring gene specificity. The first round PCR directed by primers HBADHF1 and HBADHR1, produced a single band on a 1% agarose gel with an approximate size of 1,000 bp (Figure 3). The second round PCR directed by primers HBADHF2 and HBADHR2 also produced a single band on a 1% agarose gel with a size of around 900 bp (Figure 3).
The gene after the second round PCR amplification was cloned into the expression vector pET30a. The amplified gene with NdeI and XhoI restriction sites at the 5’ and 3’ terminals were digested with respective restriction enzymes to create overhang regions which was inserted into the NdeI and XhoI double digested pET- 30a expression vector. The recombinant plasmids were selected from colonies grown on an agar plate with 50 μg/ml kanamycin. The selected colonies were then confirmed by colony PCR and DNA sequencing, and they contained the inserted Hbut_0414 gene in the recombinant plasmids in the correct orientation and without any mutation.
The codon usage of E. coli and H. butylicus were compared to assess E. coli capability to express protein from H. butylicus. It showed that codons AGG (codon for arginine), CTA and CTC (codons for leucine), ATA (codon for isoleucine) and CCC (codon for proline) are rare codons in E. coli but commonly used in H. butylicus. Hence, E. coli Rosetta 2 that co-expresses the tRNAs for these rare codons including AGG, CTA, ATA and CCC were used for the expression of the gene Hbut_0414. However, E. coli Rosetta 2 doesn’t have tRNA for the codon CTC.
Over-expression of Hbut_0414
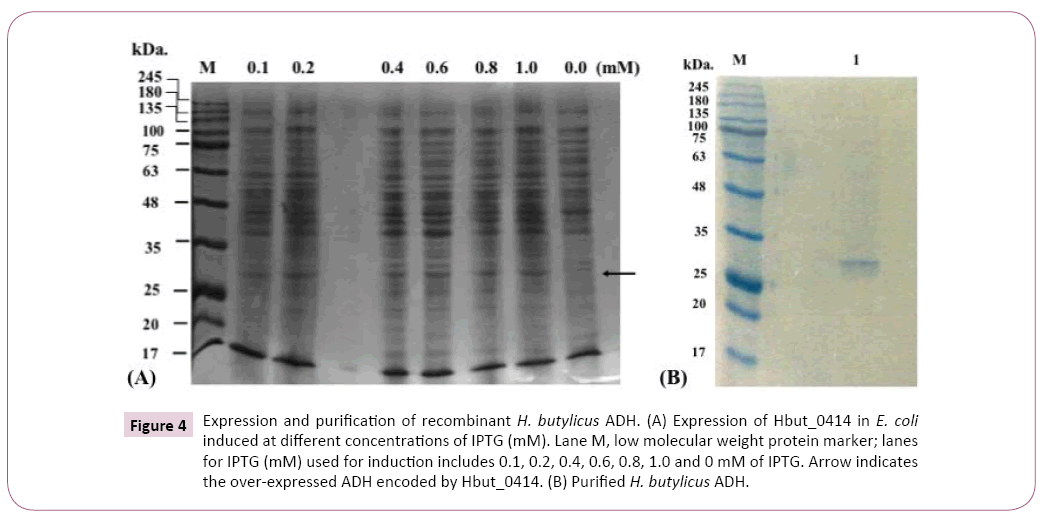
The expression vector pET-30a is driven by T7-lac promoter, and the overexpression of Hbut_0414 was induced by IPTG, corresponding to a band of approximately 32 kD on a 12.5% SDSPAGE. Only the cell-free extract prepared from cells with IPTG induction showed ADH activity with NAD as a cofactor. The use of E. coli Rosetta 2 strain as the expression host showed better expression than E. coli BL21, which was due to the fact that E. coli Rosetta 2 contains more extra tRNAs for rarely used codons than E. coli BL21.
Using a small culture (5 ml), optimal expression of was achieved when the concentration of IPTG reached 0.6 mM at 30°C (Figures 4A and 4B). The larger scale (0.5-1 L) culture of the recombinant E. coli was incubated in LB medium with 50 μg/ml kanamycin at 37°C until OD600nm 0.8 before induction, which took 4-5 hours. It was then incubated at 30°C and 0.6 mM of IPTG was added for starting the induction.
Figure 4: Expression and purification of recombinant H. butylicus ADH. (A) Expression of Hbut_0414 in E. coli induced at different concentrations of IPTG (mM). Lane M, low molecular weight protein marker; lanes for IPTG (mM) used for induction includes 0.1, 0.2, 0.4, 0.6, 0.8, 1.0 and 0 mM of IPTG. Arrow indicates the over-expressed ADH encoded by Hbut_0414. (B) Purified H. butylicus ADH.
Recombinant E. coli strains without IPTG induction or with empty vector inserted were grown under the same conditions as the induced recombinant E. coli contained Hbut_0414. Their cell-free extracts (CFE, 0.3 mg) were used for measuring ADH activity in 100 mM of EPPS at pH 8.5 and 60°C with 1-butanol as substrate. The specific activity of CFE prepared using the recombinant E. coli grown without IPTG induction was 0.064 ± 0.004 U/mg and for E. coli with empty vector was 0.059 ± 0.005 U/mg. The specific activity was much lower than the specific activity of the CFE prepared from cells with the overexpression of Hbut_0414 (0.87 ± 0.02 U/mg). In E. coli genome, there is also no annotated gene encoding an ADH with similar molecular size as the recombinant ADH encoded by Hbut_0414.
Purification of the ADH encoded by Hbut_0414
The recombinant H. butylicus ADH was purified through a series of chromatography columns (Table 2). The cell-free extract contained 201 U of ADH was first loaded onto a DEAE column. Most of the E. coli proteins did not bind to the DEAE column and eluted out with buffer A. The partially purify ADH was then loaded onto a HAP column followed by a phenyl-Sepharose column. The ADH bound strongly to the phenyl-Sepharose column, by which a further purification of ADH was achieved. Gel-filtration chromatography resulted in the purification of the ADH to homogeneity. The purified ADH has a specific activity of around 9 U/mg toward 1-butanol. The yield of the purification was 57%. The purified ADH was stored at -20°C for further characterization experiments.
Table 2 Purification of the ADHencoded by Hbut_0414.
| Total protein (mg) | Total activity (U) | Specific Activity (U/mg) | Purification fold | Yield (%) | |
|---|---|---|---|---|---|
| Cell-free extract | 230 | 201 | 0.874 | 1.0 | 100 |
| DEAE | 80 | 172 | 2.157 | 2.5 | 86 |
| HAP | 52 | 140 | 2.698 | 3.1 | 70 |
| Phenyl-sepharose | 28 | 128 | 4.573 | 5.2 | 64 |
| Gel-filtration | 13 | 117 | 9.032 | 10.3 | 57 |
The molecular weight of the ADH under denaturing condition was estimated to be 33 kDa on a 12.5% SDS-PAGE (Figure 4). The native molecular weight was determined by size exclusion chromatography with Superdex-200 column. The ADH was eluted with an effective volume (Ve) of 165 ml at a flow rate of 2 ml/min. The molecular weight of its native form was determined to be around 130 kDa, indicating the ADH to be a homotetramer, similar to other ADHs from hyperthermophiles [13].
Protein-dependent ADH activity
ADH activity could be measured when coenzyme NAD(H) was used, however, NADP(H) did not support any activity measurable, indicating it is an NAD(H) dependent enzyme. It was also determined to be not oxygen sensitive after incubation in air for 5 h.
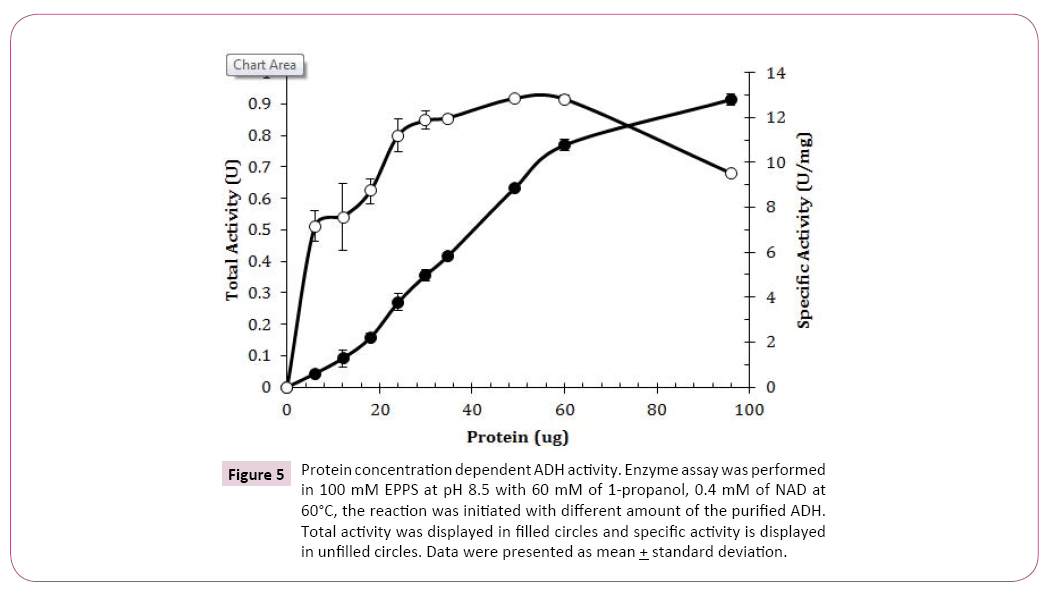
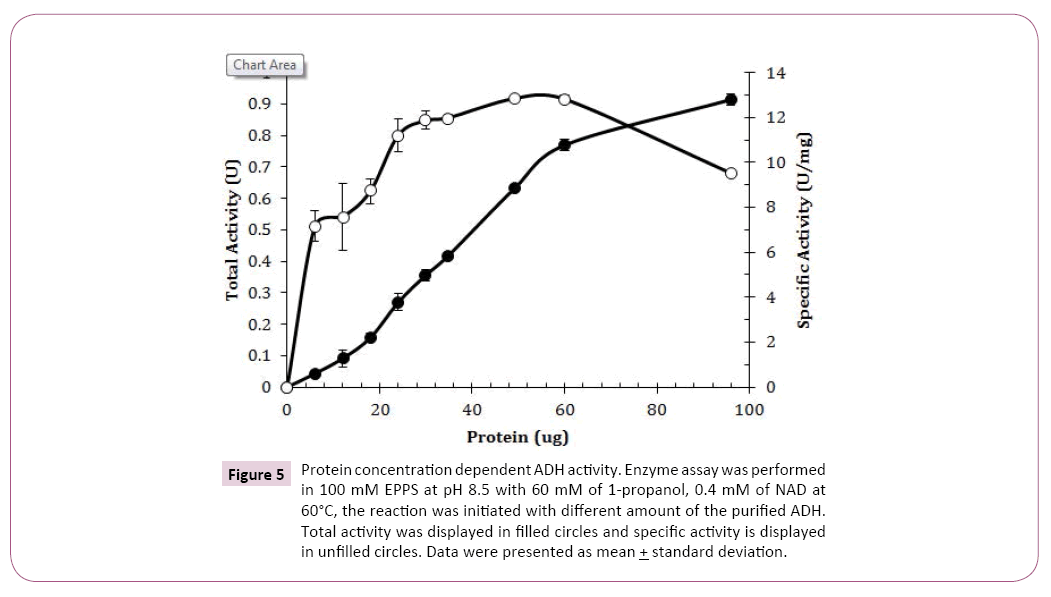
Different protein amounts from 6 μg to 96 μg were tested and protein amounts from 24 μg to 60 μg in the assay mixture showed a relatively constant specific activity (Figure 5). It showed that approximate 35 μg of purified ADH should be used for accurately measuring the enzyme activity. Protein amount less than 25 μg did not initiate the enzyme activity fully so no enzyme assay should be performed with protein less 30 μg. Decreased enzyme specific activity was observed when protein was greater than 60 μg , indicating that enzyme concentration was no longer a limited factor in the reaction.
Figure 5: Protein concentration dependent ADH activity. Enzyme assay was performed in 100 mM EPPS at pH 8.5 with 60 mM of 1-propanol, 0.4 mM of NAD at 60°C, the reaction was initiated with different amount of the purified ADH. Total activity was displayed in filled circles and specific activity is displayed in unfilled circles. Data were presented as mean + standard deviation.
pH dependent ADH activities
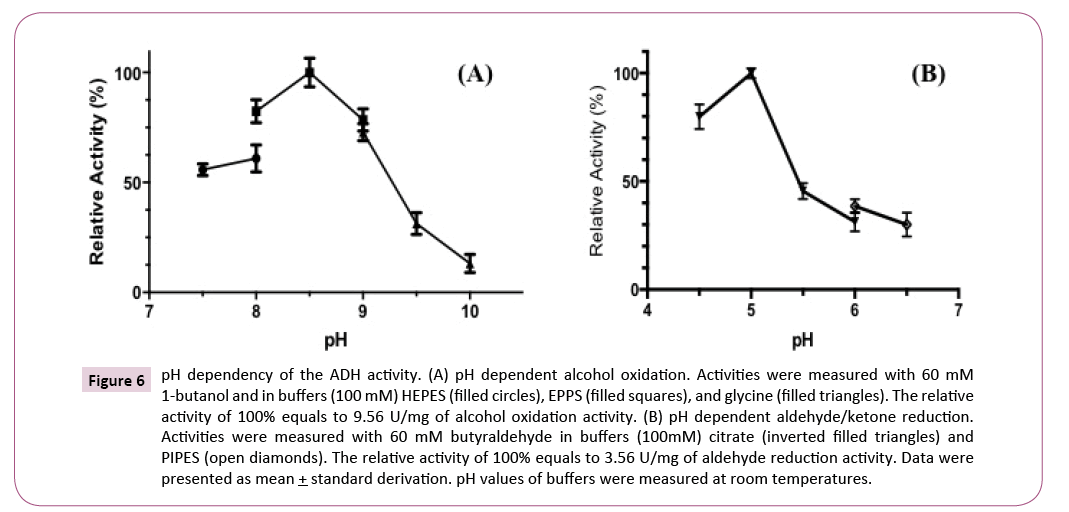
The optimal pH of the purified ADH was determined with various buffers (100 mM) from pH 4.5 to 6.5 for aldehyde reduction and pH 7.5 to 10 for alcohol oxidation. The optimal pH for 1-butanol oxidation was at 8.5 (Figure 6A) and for butyraldehyde reduction was at 5.0 (Figure 6B). The oxidation activity decreased dramatically when pH increased to higher than 9.0 and reduction activity decreased sharply when pH was higher than 5.
Figure 6: pH dependency of the ADH activity. (A) pH dependent alcohol oxidation. Activities were measured with 60 mM 1-butanol and in buffers (100 mM) HEPES (filled circles), EPPS (filled squares), and glycine (filled triangles). The relative activity of 100% equals to 9.56 U/mg of alcohol oxidation activity. (B) pH dependent aldehyde/ketone reduction. Activities were measured with 60 mM butyraldehyde in buffers (100mM) citrate (inverted filled triangles) and PIPES (open diamonds). The relative activity of 100% equals to 3.56 U/mg of aldehyde reduction activity. Data were presented as mean + standard derivation. pH values of buffers were measured at room temperatures.
Temperature dependent ADH activity and thermostablity
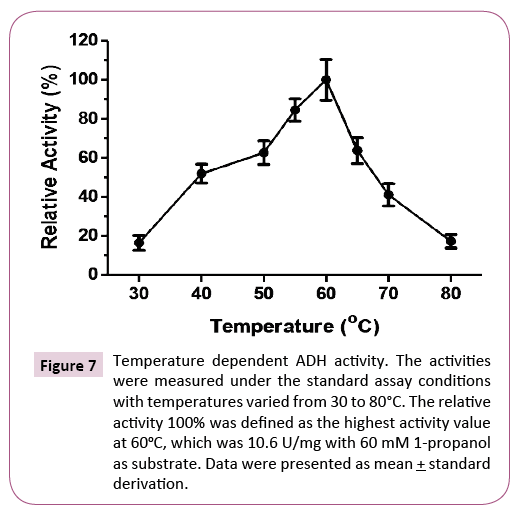
Temperature dependent ADH activity was measured from 30°C to 80°C. The activity increased from 30°C to 60°C and decreased at higher temperatures (Figure 7). The optimal temperature was at 60°C, which was lower than other characterized hyperthermophilic ADHs. The relative activity was less than 20% at 80°C, at which other hyperthermophilic ADHs are relatively thermostable.
Figure 7: Temperature dependent ADH activity. The activities were measured under the standard assay conditions with temperatures varied from 30 to 80°C. The relative activity 100% was defined as the highest activity value at 60oC, which was 10.6 U/mg with 60 mM 1-propanol as substrate. Data were presented as mean + standard derivation.
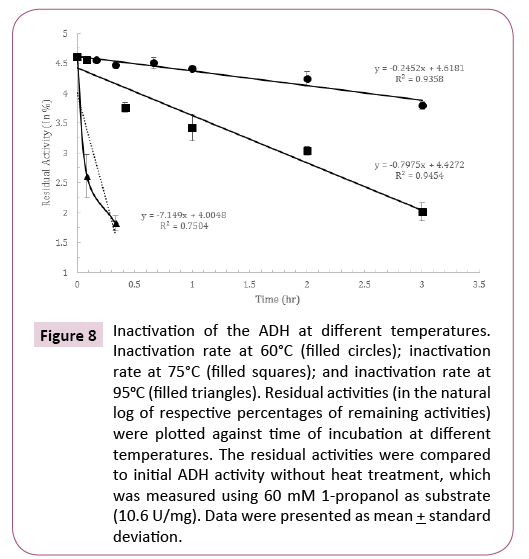
Thermostability of the ADH was measured at 60°C, 75°C and 95°C, respectively. The optimal growth temperature for H. butylicus is 95°C. The time for the loss of 50% of the activity at 60°C was about 3 hours, and it decreased to 20 minutes at 75°C and the activity was lost more than 80% after incubation at 95°C for 5 minutes. This showed the ADH had relatively low resistance to heat. Inactivation kinetic for the resistant portion of the activity was determined. The semi-log plot of the residual activities versus heating time was linear at 60°C and 75°C (Figure 8). From the slopes of these lines, inactivation rate constant was 3.2 times higher at 75°C compared to that at 60°C. The ADH was almost immediately inactivated at 95°C.
Figure 8: Inactivation of the ADH at different temperatures. Inactivation rate at 60°C (filled circles); inactivation rate at 75°C (filled squares); and inactivation rate at 95oC (filled triangles). Residual activities (in the natural log of respective percentages of remaining activities) were plotted against time of incubation at different temperatures. The residual activities were compared to initial ADH activity without heat treatment, which was measured using 60 mM 1-propanol as substrate (10.6 U/mg). Data were presented as mean + standard deviation.
Substrate specificity and enzyme kinetics
Substrate specificity of the ADH was determined using a set of alcohols, aldehydes, and ketones (Table 3). In the oxidation reactions, the ADH was able to oxidize a broad range of primary alcohols except methanol (Table 3). The ADH was also reactive with secondary alcohols but with lower activities, suggesting it was a primary/secondary ADH. It was also able to oxidize diols with higher activities towards primary diols than secondary diols. The ADH showed no activity toward the polyol-glycerol examined. In the reduction reactions, the ADH exhibited the ability to reduce various aldehydes and ketones (Table 3). The activities were higher toward aldehydes than ketones. For the oxidation reaction, the substrate with the highest activity was 1-propanol and for the reduction reaction, propanal supported the highest activity measured.
Table 3 Substrate specificity of the ADH in the oxidation and reduction reactions.
| Substrates Alcohols (Oxidationa) | Relative Activity (%) | Substrates Alcohols (Oxidationa) |
Relative Activity (%) | Substrates Alcohols (Oxidationa) |
Relative Activity (%) |
|---|---|---|---|---|---|
| Methanol | 0 | 2-propanol | 43 ± 1 | 1,5-pentanediol | 31 ± 6 |
| Glycerol | 0 | 2-butanol | 12 ± 3 | 2,4-pentandiol | 7.9 ± 0.6 |
| Ethanol | 88 ± 6 | 2-pentanol | 39 ± 4 | Aldehydes/ketones (Reductionc) | |
| 1-propanol | 100 ± 3 b | 2-phenylethanol | 6 ± 0.7 | Benzaldehyde | 0.5 ± 0.06 |
| 1-butanol | 88 ± 2 | 1,3-propanediol | 21 ± 0.9 | Acetaldehyde | 73.3 ± 2 |
| 1-pentanol | 74 ± 3 | 1,2-butanediol | 10 ± 2 | Propanal | 100 ± 4 d |
| 1-hexanol | 62 ± 5 | 1,3-butanediol | 12 ± 0.8 | Butyraldehyde | 26.1 ± 3 |
| 1-heptanol | 60 ± 4 | 2,3-butanediol | 4.7 ± 1.2 | Acetone | 9.4 ± 1 |
| 1-octanol | 27 ± 3 | 1,4-butanediol | 11 ± 0.9 | Butanone | 12.1 ± 2 |
Note: aEnzyme assay was performed under standard conditions at pH 8.5 and 60°C with various substrates. The ADH activity was initiated with the addition of purified enzyme. The oxidation activity was measured with 0.4 mM NAD+. bA relative activity of 100% in alcohol oxidation was 9.85 ± 0.3 U/mg.cEnzyme assay was performed under standard conditions at pH 5.0 and 60°C with various substrates. The ADH activity was initiated with the addition of purified enzyme. The reduction activity was measured with 0.2 mM NADH.dA relative activity of 100% in aldehyde/ketone reduction was 11.85 + 0.5 U/mg
The apparent Km values for substrates in the reduction reaction were lower than that for the corresponding alcohols in the oxidation reaction (Table 4). The apparent Km value for propanal was 5.6 times lower than 1-propanol, and apparent Km value for acetone was 3.4 times lower than 2-propanol. The specificity constant kcat/Km for propanal was the highest (15,975 s-1M-1) and about 8 times higher than propanol. The kcat/Km specificity constants were similar for the primary alcohols examined. The kcat/Km specificity constant for 1-propanol was around 35 times higher than that for acetone (Table 4). These catalytic properties suggest ADH could play an important role in the reduction of aldehyde especially propanal in vivo.
Table 4 Kinetic parameters of the ADH.
| Substrates (mM)a | Cofactors (mM) | Apparent Km(mM) |
kcat (s-1) |
kcat/ Km (s-1M-1) |
|---|---|---|---|---|
| Ethanol (0.36-26.43) |
NAD (0.4) | 1.79 ± 0.17 | 4.36 ± 0.12 | 2436 ± 706 |
| 1-Propanol (0.36-26.43) |
NAD (0.4) | 2.30 ± 0.24 | 5.18 ± 0.18 | 2252 ± 750 |
| 2-Propanol (0.36-48.58) |
NAD (0.4) | 4.85 ± 0.21 | 1.56 ± 0.21 | 322 ± 100 |
| Butanol (0.36-26.43) |
NAD (0.4) | 1.68 ± 0.15 | 4.36 ± 0.08 | 2595 ± 533 |
| Acetaldehyde (0.36-13.82) |
NADH (0.2) | 0.61 ± 0.11 | 4.79 ± 0.21 | 7852 ± 1909 |
| Propanal (0.36-13.82) |
NADH (0.2) | 0.41 ± 0.07 | 6.55 ± 0.22 | 15,975 ± 3143 |
| Acetone (0.36-26.43) |
NADH (0.2) | 1.41 ± 0.19 | 0.64 ± 0.03 | 454 ± 158 |
| Butyraldehyde (0.36-26.43) |
NADH (0.2) | 1.75 ± 0.29 | 1.96 ± 0.10 | 1120 ± 345 |
Note: a Various concentrations of alcohols (0.36, 0.72, 1.08, 1.44, 2.16, 2.87, 3.58, 7.08, 13.82, 26.43 and 48.58 mM) were used for the determination of oxidation kinetics parameters, and various concentrations of aldehydes/ketones (0.36, 0.72, 1.08, 1.44, 2.15, 2.87, 3.58, 7.08, 13.82 and 26.43 mM) were used for the determination of reduction kinetics parameters
Discussion
H. butylicus is named butylicus because of the similarity to fermentation products of Clostridium butylicum, also known as C. beijerinckii [1]. Unlike other Clostridium species, where n-butanol is produced at pH values below 5.0, C. beijerinckii produces over 60 mM of n-butanol when pH was maintained constant at 6.8 [14]. Homologs of key enzymes in the Clostridium’s butanol pathway were searched in the H. butylicus genome. However, those key enzymes including butyryl-CoA dehydrogenase, β-hydroxybutyryl-CoA dehydrogenase, acetoacetyl-CoA: acetate: CoA-transferase, acetoacetyl-CoA: butyrate: CoA transferase and butyraldehyde dehydrogenase have no significant homolog in the genome (Table 5). It is unlikely that H. butylicus would have the same pathway for butanol production. However, there is a gene (Hbut_0414) encoding an ADH similar to the butanol dehydrogenase with low sequence identity (Table 5). Although the pathway for butanol production in H. butylicus is unknown, an ADH is the only enzyme required for catalyzing the reduction of aldehyde into alcohol in vivo, therefore, it must be present in H. butylicus for 1-butanol production.
Table 5 Potential homologs of genes from H. butylicusencoding enzymes involved in the butanol metabolic pathway in C. acetobutylicumATCC 824.
| Enzymes from C. acetobutylicum ATCC 824 | Homolog genes present in H. butylicus | E-value a | % identity b | Description |
|---|---|---|---|---|
| Pyruvate ferredoxin oxidoreductase | Hbut_0730 | 5.44E-134 | 28.23 | Pyruvate ferredoxin oxidoreductase |
| Hbut_0668 | 1.45E-31 | 27.43 | Pyruvate ferredoxin oxidoreductase | |
| Thiolase | Hbut_1528 | 9.53E-152 | 29.01 | Acetyl-CoA acetyltransferase |
| β-hydroxybutyryl-CoA dehydrogenase | Hbut_0193 | 2.8 | 13.47 | 3-hydroxyisobutyate dehydrogenase |
| Crotonase | Hbut_1155 | 8.62E-28 | 28 | Methylmalonyl-CoA carboxyltransferase |
| Butyryl-CoA dehydrogenase | Hbut_0229 | 1.1 | 4.48 | AbrB family transcriptional regulator |
| Acetoacetyl-CoA: acetate: CoA-transferase | Hbut_1028 | 0.9 | 7.71 | Predicted ABC transporter |
| Acetoacetyl-CoA: butyrate: CoA transferase | Hbut_0788 | 3.5 | 11.48 | Hypothetical protein |
| Butyraldehyde dehydrogenase | Hbut_0044 | 3.6 | 2.09 | Hypothetical protein |
| Butanol dehydrogenase | Hbut_0414 | 6.24E-10 | 10.56 | Zinc-dependent alcohol dehydrogenase |
Note: aExpected value of homolog genes from H. butylicusDSM 5456 (taxid:415426) with the conserved domains of corresponding enzymes from C. acetobutylicum ATCC 824 (taxid:272562). bShowing the percentage of identity between the protein sequences of corresponding enzymes from C. acetobutylicumATCC 824 and H. butylicusDSM 5456 using Clustal W2 available from https://www.genome.jp/tools/clustalw/. The enzymes are compared with genes from H. butylicuswith the highest bit scores showed from blastp program (protein to protein blast) from database non-redundant protein sequence (nr) available at https://www.ncbi.nlm.nih.gov/ blast/Blast.cgiQUERY.
The sequence analysis showed that Hbut_0414 encodes a zinccontaining ADH with a Zn-binding motif identified to be modified from GHEX2GX5GX2V to GCSX2GX5GX2A (residues 41-55) [11]. The presence of different types of ADHs in hyperthermophiles has been reported in S. solfataricus and P. furiosus [15-18].
The annotated zinc-containing ADH gene Hbut_0414 in H. butylicus was cloned and overexpressed in E. coli Rosetta 2. The purified recombinant Hbut_0414 (ADH) showed to be an NAD(H)-specific ADH and not oxygen-sensitive. It is believed that its physiological roles maybe be revealed by its enzyme kinetics and substrate specificity.
The enzyme encoded by Hbut_0414 was found to be a primary/ secondary ADH with higher relative activities toward primary alcohols than secondary alcohols. Its apparent Km values for aldehydes were lower than alcohols, indicating a preferable catalysis for the alcohol production. It is interesting to note that the highest specificity constant kcat/Km was for catalyzing the reduction of propanal to 1-propanol, whose physiological function is not clear. Since it showed a reasonable value of specificity constant kcat/Km for butyraldehyde, it might have the capability of catalyzing the production of 1-butanol in H. butylicus. However, its optimal pH for the reduction reaction was found to be 5.0, which is lower than many hyperthermophilic ADHs [13].
The ADH showed a maximal thermoactivity at 60°C and a loss of 85% of its activity after incubation for 5 minutes at 95°C. Considering 95°C is the optimal growth temperature of H. butylicus, the much lower thermostability of the ADH raises the questions of whether the expression of Hbut_0414 in E. coli was unable to produce the version of the enzyme in H. butylicus, or whether it could be functionally expressed in H. butylicus. For the first question, there was no indication of any folding problem of the ADH in E. coli, and its catalytic properties were shown to be typical enzymatic catalysis. It may be interesting to study the native enzyme encoded by Hbut_0414 from H. butylicus in the future. NAD-dependent ADH activity was detected in the cellfree extract of H. butylicus, but it is no known if it could be the one encoded by Hbut_0414. If the ADH would be not stable in vivo, H. butylicus would not have it functioning in any metabolic pathway.
However, if H. butylicus does not use the ADH encoded by Hbut_0414, the enzyme would not have any selection pressure to be thermostable. The mechanisms for thermostability varied from enzyme to enzyme, which consisted of a combination of intrinsic stabilizing factors including the formation of salt bridges, hydrogen bonds or hydrophobic interactions, and enzymes could also be thermostable with extrinsic stabilizing factors [19,20]. The analysis of primary structure, the amino acid sequences of the ADH encoded by Hbut_0414 and its homologs showed a decrease in the percentage of charged amino acid residues and an increase in the percentage of hydrophobic amino acid residues compared to characterized thermostable ADHs (data not shown). It is difficult to conclude whether the difference in amino acid composition would lead to low thermostability because the decrease in the percentage of charged amino acid residues decreases the number of ion pairs and destabilizes the enzyme but the increase in small hydrophobic amino acid residues would lead to more hydrophobic interactions and stabilize the enzyme [21-23].
Conclusion
The biophysical and biochemical characteristics suggest the ADH encoded by Hbut_0414 is unlikely the ADH catalyzing the production of 1-butanol in H. butylicus. Further studies including the identification of the ADH responsible for the 1-butanol production in H. butylicus are required.
Acknowledgements
This work was supported by research grant from the Natural Sciences and Engineering Research Council of Canada (NSERC) to K.M.
References
- Zillig W, Holz I, Janekovic D, Klenk HP, Imsel E,et al. (1990) Hyperthermus butylicus a hyperthermophilic sulfur-reducing archaebacterium that ferments peptides. J Bacteriol 172: 3959-3965.
- Brugger K, Chen L, Stark M, Zibat A, Redder P, et al. (2007) The genome of Hyperthermus butylicus: a sulfur-reducing, peptide fermenting, neutrophilic Crenarchaeote growing up to 108 degrees C. Archaea 2:127-135.
- Kinoshita S, Udaka S, Shimono M(1957) Studies on the amino acid fermentation part 1. Production of l-glutamic acid by various microorganisms. J Gen Appl Microbiol 3: 193-205.
- Gao S, Oha DH, Broadbentb JR, Johnsonc ME, Weimer BC, et al. (1997) Aromatic amino acid catabolism by lactococci. Le Lait 77: 371-381.
- Christensen HN (1990) Role of amino acid transport and countertransport in nutrition and metabolism. Physiol Rev 70: 43-77.
- Toth J, Ismaiel AA, Chen JS(1999) Thealdgene, encoding a coenzyme A-Acylatingaldehyde dehydrogenase, distinguishes clostridium beijerinckii and two other solvent-producing clostridia from clostridium acetobutylicum. Appl Environ Microbiol 65: 4973-4980.
- Balch WE, Fox GE, Magrum LJ, Woese CR, Wolfe RS (1979) Methanogens: Reevaluationof a unique biological group. Microbiol Rev 43: 260-296.
- Bradford MM (1976) A rapid and sensitive method for the quantitation of microgram quantities of protein utilizing the principle of protein-dye binding. Anal Biochem72: 248-254.
- Laemmli UK (1970) Cleavage of structural proteins during the assembly of the head of bacteriophage T4. Nature 227: 680-685.
- Machielsen R, Uria AR, Kengen SW, van der Oost J (2006) Production and characterization of a thermostable alcohol dehydrogenase that belongs to the aldo-ketoreductase superfamily. Appl Environ Microbiol 72: 233-238.
- Ying X, Ma K(2011) Characterization of a zinc-containing alcohol dehydrogenase with stereoselectivity from the hyperthermophilic archaeon thermococcus guaymasensis. J Bacteriol 193: 3009-3019.
- Raia CA, Giordano A, Rossi M (2001) Alcohol dehydrogenase from Sulfolobussolfataricus. Methods Enzymol 331: 176-195.
- Radianingtyas H, Wright PC (2003) Alcohol dehydrogenases from thermophilic and hyperthermophilic archaea and bacteria. FEMS Microbiol Rev 27: 593-616.
- George HA, Johnson JL, Moore WEC, Holdeman LV, Chen JS(1983) Acetone, Isopropanol, and Butanol Production by Clostridium beijerinckii (syn. Clostridium butylicum) and Clostridium aurantibutyricum. Appl Environ Microbiol 45: 1160-1163.
- Ammendola S, Raia CA, Caruso C, Camardella L, D'Auria S, et al. (1992) ThermostableNAD(+)-dependent alcohol dehydrogenase from Sulfolobussolfataricus: gene and protein sequence determination and relationship to other alcohol dehydrogenases. Biochemistry 31: 12514-12523.
- Ma K, AdamsMW (1999)An unusual oxygen-sensitive, iron- and zinc-containing alcohol dehydrogenase from the hyperthermophilic archaeon Pyrococcus furiosus. J Bacteriol 181: 1163-1170.
- van der Oost J, Voorhorst WG, Kengen SW, Geerling AC, Wittenhorst V,et al. (2001) Genetic and biochemical characterization of a short-chain alcohol dehydrogenase from the hyperthermophilic archaeon Pyrococcus furiosus. Eur J Biochem 268:3062-3068.
- Contursi P, Cannio R, Prato S, Fiorentino G, Rossi M, et al. (2003) Development of a genetic system for hyperthermophilic Archaea: expression of a moderate thermophilic bacterial alcohol dehydrogenase gene in Sulfolobus solfataricus. FEMS Microbiol Lett 218: 115-120.
- Gromiha MM, Oobatake M, Sarai A (1999) Important amino acid properties for enhanced thermostability from mesophilic to thermophilic proteins. Biophys Chem 82: 51-67.
- Matsumura M, Yasumura S, Aiba S (1986) Cumulative effect of intragenic amino-acid replacements on the thermostability of a protein. Nature 323: 356-358.
- Kumar S, Nussinov R (2001) How do thermophilic proteins deal with heat? Cell Mol Life Sci 58: 1216-1233.
- Van den Burg B, Dijkstra BW, Vriend G, Van der Vinne B, Venema G, et al. (1994) Protein stabilization by hydrophobic interactions at the surface. Eur J Biochem 220: 981-985.
- Larkin MA, Blackshields G, Brown NP, Chenna R, McGettigan PA, et al. (2007) Clustal W and Clustal X version 2.0. Bioinformatics 23: 2947-2948.
Open Access Journals
- Aquaculture & Veterinary Science
- Chemistry & Chemical Sciences
- Clinical Sciences
- Engineering
- General Science
- Genetics & Molecular Biology
- Health Care & Nursing
- Immunology & Microbiology
- Materials Science
- Mathematics & Physics
- Medical Sciences
- Neurology & Psychiatry
- Oncology & Cancer Science
- Pharmaceutical Sciences
