ISSN : ISSN: 2576-1412
Journal of Applied Microbiology and Biochemistry
Biochemical Characterization of H2O2-Induced Oxidative Stress in E.coli
Santosh Kumar Sahu* and Himadri Gourav Behuria
Laboratory of Molecular Membrane Biology, Department of Biotechnology, North Orissa University, India
- *Corresponding Author:
- Santosh Kumar Sahu
Assistant Professor, Department of
Biotechnology, North Orissa University,
Takatpur, Baripada, Odisha, India-757003
Tel: +91-9178939281
Fax: 06792-256906
E-mail: drsantoshnou@gmail.com
Received date: July 11, 2018; Accepyed date: August 29, 2018; Published date: September 05, 2018
Citation: Sahu SK, Behuria HG (2018) Biochemical Characterization of H2O2- Induced Oxidative Stress in E.coli. J Appl Microbiol Biochem. Vol.2 No.3:10
Abstract
H2O2-induced toxicity led to remodeling of phospholipid (PL) in E. coli (DH5α) grown in LB medium at 25°C. A dose-dependent enhancement in conjugated diene content of total cellular lipid extract was observed when E. coli (DH5α) was grown in LB containing 1 to 10 mM H2O2. Elevated conjugated diene content was accompanied by a dose-dependent augmentation of cardiolipin (CL) by two fold with 20% depletion in sum total of phosphatidyl ethanolamine (PE) and phosphatidyl glycerol (PG) [(PE+PG)] content without altering total PL content. A 75% depletion of catalase activity and a dose-dependent variation in cellular free iron content were the oxidative-stress regulatory mechanism in E. coli (DH5α) in response to elevated level of extrinsic H2O2. These findings suggest that E. coli responds to H2O2-induced toxicity by regulating cellular-free iron content and by modulating cellular PL composition. As CL is known to be augmentated in multiple stress conditions, we hypothesize that H2O2-induced augmentation in CL content of E. coli (DH5 α) is a regulatory mechanism to survive oxidative stress. Our findings revel that exogenous H2O2 induces a lipid-mediated oxidative stress regulatory mechanism in E. coli.
Keywords
Phospholipid; Cardiolipin; Catalase; Peroxidation; Conjugated diene
List of Abbreviations
BSA: Bovine Serum Albumin; CL: cardiolipin; IDR: Iron-detection Reagent; IRR: Iron Releasing Reagent; PC: Phosphatidyl Choline; PE: Phosphatidyl Ethanolamine; PG: Phosphatidyl Glycerol; CL: Cardiolipin; PM: Plasma Membrane; ROS: Reactive Oxygen Species; PUFA: Polyunsaturated Fatty Acid; 2D-TLC: Two Dimensional Thin Layer Chromatography; O2•-: Superoxide Ion; OH•-: Hydroxyl Ion; SOD: Superoxide Dismutase.
Introduction
Aerobic bacteria such as E. coli are subjected to a variety of extrinsic and intrinsic oxidative stress such as exposure to toxic chemicals, ionizing radiation, hyperbaric oxygen and incomplete reduction of O2 during metabolism. H2O2 is also generated in cells as a by-product of water radiolysis after exposure to ionizing radiation. The consecutive univalent reduction of molecular oxygen to water produces three active intermediates: superoxide anion (O2•-), hydrogen peroxide (H2O2) and hydroxyl radical (OH•-), collectively termed as reactive oxygen species (ROS) [1]. Reaction of H2O2 with transition metal ions like Fe3+ and Cu2+ accelerates oxidative damage of cellular constituents by producing reactive hydroxyl (OH•-) ions through Fenton reaction and Haber-Weiss reaction [2-4].
These ROS react with cellular components such as lipid, protein and nucleic acid that trigger a series of reactions culminating in cellular oxidative damage [5,6]. In bacteria, these detrimental consequences of oxidative damage can be lethal or mutagenic [7- 11]. Increasing evidences suggest that in human, the cumulative damage caused by ROS contributes to numerous degenerative diseases associated with aging, such as atherosclerosis, rheumatoid arthritis and cancer [12].
The detailed mechanism of H2O2-induced cytotoxicity is not yet completely explored. In E. coli (DH5α), two pathways of H2O2- mediated cytotoxicity are proposed that are distinguishable by metabolic, kinetic and genetic criteria [13]. Mode one is characterized by a greater rate of killing exhibited by low (1-3 mM) concentration of H2O2. However, mode two is characterized by a broad shoulder of H2O2 that is exhibited by intermediate concentration (3-10 mM) of H2O2. While mode one killing appears to result from DNA damage, the detailed pathway of lethal cell damage has not been identified for mode two killing [13].
Additional possible targets of H2O2 remain to be investigated [10].
Lipids are among the most vulnerable group of biomolecules that are prone to oxidative damage by ROS. PLs, the predominant class of lipids in E. coli constitutes ~89% of the cell envelope in Gram negative bacteria like E. coli. Phosphatidyl ethanolamine (PE) is the predominant PL that constitutes 69% of total PLs, 19% being phosphatidyl glycerol (PG) and 6.5% is cardiolipin (CL) [14]. Rest of the PL (including unidentified PLs) constitute ~6% of the total PL. Phosphatidyl choline (PC) and phosphatidic acid (PA) constitute minor PLs in E. coli that are normally not detected on TLC [14]. However, variation in cellular PL composition is observed in response to extreme conditions such as high osmotic stress, heavy metal toxicity and growth phase of E. coli [15- 18]. CL content of E. coli is known to be altered in multitude growth inhibitory conditions [19]. CL synthesis is upregulated in stationary phase, extreme pH and ionic strength etc. However, the effect of oxidative stress on CL content of bacteria has remained unexplored.
Recent investigation shows the importance of lipid-mediated regulatory pathways that control multiple cellular responses to extreme environmental conditions [20]. Alteration in CL composition affects lipid organization and lipid-protein interaction in plasma membrane of bacteria and inner mitochondrial membranes of eukaryotes [21,22]. Hence, cells might respond to oxidative stress by regulating CL composition in these membranes. However, the lipid-mediated cellular response to H2O2-induced oxidative stress remains to be understood. In the present work, we used E. coli (DH5α) as a model system to investigate the effect of H2O2-induced cytotoxicity on cellular lipid composition and lipid-mediated cellular responses to H2O2- induced toxicity.
Materials and Methods
Materials
E. coli (DH5α) was a gift from Dr. R.N. Munda from department of Biotechnology, North Orissa University. PL standards: PC, PE, PG and CL were obtained from Sigma (India). Lysozyme, bovine serum albumin (BSA), Triton-X-100, FeCl3, Ferrozine, Neucoproine, ammonium acetate, ascorbic acid, ammonium molybdate, potassium permanganate, sodium hydroxide, sodium chloride, Sodium carbonate, sodium potassium tartarate, copper sulphate, Tris Buffer and components of LB media (Yeast extract, Tryptone and Agar) were obtained from Himedia (India). H2O2, Silica gel GF 254, Follin’s reagent and Iodine balls were purchased from Merck (India). Butylated Hydroxy Toluene (BHT) was obtained from Sisco Research Laboratory (SRL), India. All organic solvents (Chloroform, Methanol, Acetic acid, and Ammonia solution (25%), Acetone) were purchased from Merck (India). Inorganic acids: hydrochloric acid and Perchloric acid were purchased from Merck (India).
Growth of E. coli (DH5α) and induction of H2O2- mediated toxicity
E. coli (DH5α) was grown in LB or LB containing different concentration of H2O2 by inoculating 100 ml broth in 250 ml Erlenmeyer flask with 1 ml seed culture grown for 12h at 25°C and 200 rpm. The cells were grown for 16h at 25°C and 200 rpm.
Collection and re-suspension of cells
The cells were collected at 16 h of growth (early saturation phase) by centrifugation at 5000 × g for 7 min at 25°C and re-suspended at ̴10 mg/ml total protein (cells from 10 ml saturated culture broth was re-suspended to 1 ml) in re-suspension buffer (50 mM Tris-HCl, pH 7.5, 100 mM NaCl, 5 mM BHT) and used immediately for further experiments.
Estimation of protein
Total protein from E. coli (DH5α) was quantitated by Lowry’s method with modification [23]. Briefly, 16 μl of re-suspended cells was incubated with 10 μg lysozyme at 25°C for 30 min with intermittent mixing to lyse bacterial cell wall. Cell membrane was lysed by incubating with 1% Triton-X-100 at 25°C for 30 min with intermittent mixing. Whole cell lysate was mixed sequentially with Lowry’s reagent I [2% Na2CO3 in 0.2 N NaOH (48 parts), 1% sodium-potassium tartarate (1 part) and 0.5% copper sulfate (1 part) by volume followed by Lowry’s reagent II [Follin Ciocalteu reagent (1 part) + distilled water (1 part) by volume] in a final assay volume of 2.6 ml and incubated for 1h at 25°C. The assay mix was centrifuged at 5000 × g to settle down the white precipitate resulting from triton-X-100. Absorbance of the supernatant was measured in a Systronics double beam spectrophotometer (Model 2202, Japan) at 750 nm. Protein concentration was calculated from the standard curve using known concentration of BSA.
Extraction of total lipid from E. coli (DH5α)
Total lipid from E. coli (DH5α) was extracted using aqueous two phase method described earlier [24]. Briefly, 0.5 mg cell in 0.5 ml of 20 mM Tris-HCl, pH 8.0 was mixed with 1.9 ml CHCl3:CH3OH (1:2 v/v) followed by 0.625 ml CHCl3. Aqueous and organic phases were separated by adding 0.625ml H2O. Cells were lysed and separated as aqueous and organic phases by rigorous mixing for 1 min and centrifuging at 3000 × g at 25°C using a table top Sorval (REMI, India). Lower phase was collected and upper phase including the protein ring was re-extracted with 0.625 ml CHCl3. CHCl3 was evaporated in the rotary evaporator overnight. The dried lipid samples were dissolved at approximately 1 μmol/ml PL in CHCl3 and stored at -20°C for further analysis.
Quantitation of phospholipid
Phospholipid (PL) content in total lipid extract was quantitated by phosphate assay [25]. Briefly, 100 μl of total lipid extract in CHCl3 was dried at 50°C, added with 325 μl of perchloric acid (16M) and incubated at 150°C for 2 h to hydrolyze the phosphate group. Phosphate thus released was added sequentially with 2.5% ammonium molybdate (0.25 ml) and 10% ascorbic acid (0.25 ml) that upon incubation at 100°C, yielded a blue colored ammonium-phosphomolybdate complex that absorbed at 797nm. Absorbance of the samples was measured using a Systronics double beam spectrophotometer (Model 2202, Japan) and compared with the standard curve obtained from KH2PO4 standard solution (1 nmol/μl) to calculate total PL content in the lipid extract.
Quantitation of conjugated-diene
Diene conjugation in total lipid extract was quantitated following the procedure of Howlett and Avery with modification [26]. Briefly, total lipid containing 1 μmol PL was completely dried and dissolved in 3ml cyclohexane. Absorbance of the samples was scanned from 200 nm to 400 nm. Two absorbance peaks were observed at 230 nm (peak1) (A230 nm) and 274 nm (A274 nm) (peak 2) respectively. The ratio A230 nm/A 274 nm gives the relative amount of conjugated-dienes formed in the lipid.
Two dimensional thin layer chromatography (2D-TLC)
2D-TLC of total lipid extract was performed using methods described previously [27]. Lipid extract containing 500 nmol PL in 50μl CHCl3 was applied on a 20 cm × 20 cm × 0.0002 cm silica gel GF 254 TLC plate. Samples were first developed in first dimension using solvent I (CHCl3:CH3OH:25% ammonia solution 65:35:5 by volume), air dried and developed in second dimension using solvent II (CHCl3:C3OH6: CH3OH:CH3COOH:H2O in 50:20:10:10:5 by volume). Plates were air dried and spots were detected using iodine vapor. PL was detected by the presence of phosphate in each spot from phosphate estimation and identified using PL standards developed in the same condition. Silica from each spot was scrapped into assay tubes for PL quantitation.
Quantitation of phospholipids from spots on TLC plates
PL content in spots obtained from TLC was quantitated by phosphate assay. Briefly, silica from the spots on plates was scrapped into 12 × 125 mm assay tubes and weighed. PL adsorbed to silica powder was hydrolyzed to release their phosphate by heating with 325 μl perchloric acid at 150°C for 2 h. Phosphate thus released was quantitated by method of Fiske and Subarrow [25]. PL in each spot on TLC plate was calculated by subtracting the error originated from silica using known weight of silica collected from places on TLC plates that were not stained.
Quantitation of total iron content
Cellular iron content was quantitated using method described previously [28]. Briefly, 1mg cells in 0.2 ml resuspension buffer was lysed in 0.8 ml of 10 mM HCl and neutralized with 1 ml of 50 mM NaOH. Bound iron was released by adding 1 ml iron releasing reagent (IRR) (2.25% KMnO4 in 0.7 M HCl) followed by incubation at 62°C for 2 h. The released iron was detected by 0.3 ml iron-detection reagent (IDR) (6.5 mM ferrozine, 6.5 mM neocuproine, 2.5M ammonium acetate, and 1M ascorbic acid) followed by incubation at 25°C for 30 min to develop a purple colored complex with absorption maxima at 550 nm. Absorbance of the samples were measured using a Systronics double beam spectrophotometer (Model 2202, Japan) and total iron was calculated from standard curve of FeCl3 (3 nmol/μl).
Catalase assay
Catalase assay was performed on freshly collected cells using the method of Beers and Sizer [29]. Briefly, catalase activity was quantitated by measuring the time dependent depletion of H2O2 as indicated by decrease of A240 in 3 ml assay mix (6.66 mM H2O2, 50 mM Tris-HCl, pH 7.5, 100 mM NaCl, and 0.3 ml cell lysate containing 2 mg total protein). Data obtained were analyzed by fitting them to Michelis-Menten equation using Graph-Pad prism. Absorbance due to protein in the assay mix was corrected by subtracting A240nm of the assay mix that didn’t contain H2O2 for all samples. Percentage depletion of A240nm per min was plotted against time and normalized against total protein content.
Results
H2O2 in growth medium results in depletion of growth rate, reduction in catalase activity and regulation of cytosolic iron content in E. coli (DH5α).
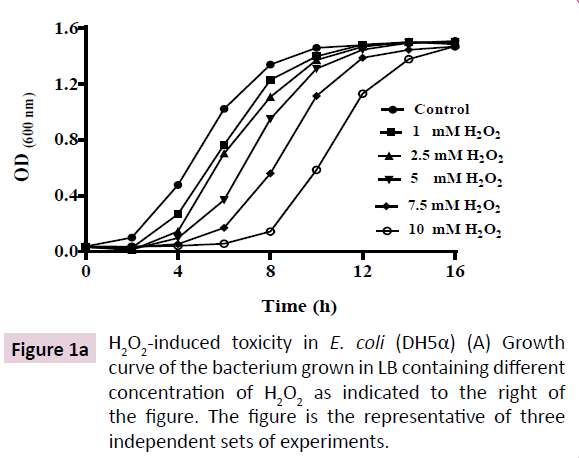
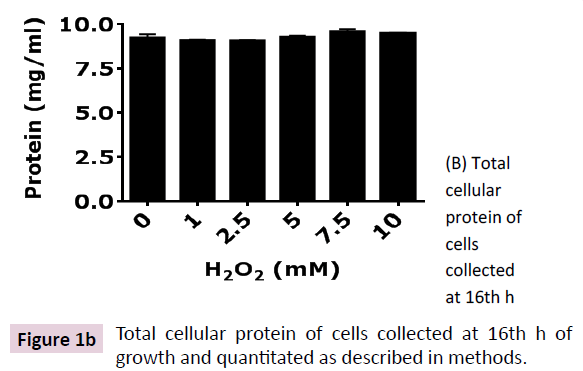
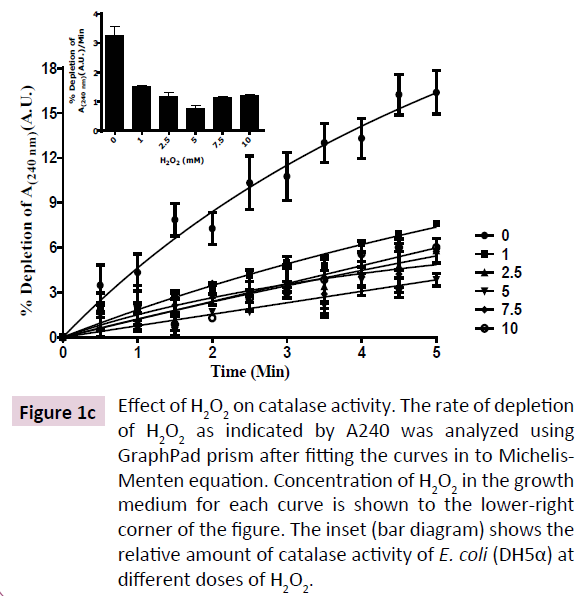
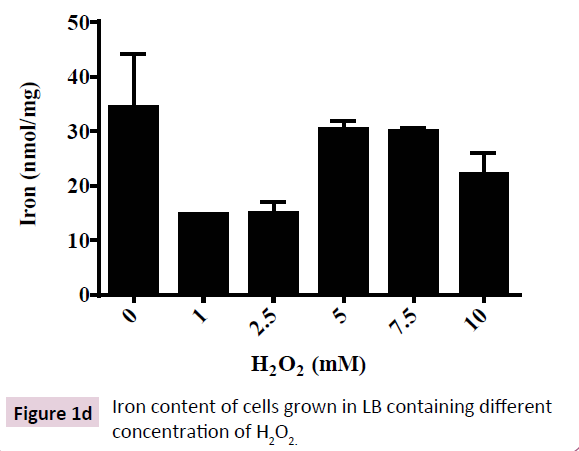
H2O2-induced toxicity was characterized by a dose-dependent depletion of growth rate (Figure 1A). Reduction in growth rate of E. coli (DH5α) was due to proportionately prolonged lag phase induced by increasing doses of H2O2 in growth medium. However, the cultures were saturated at ~16 h of growth as indicated by equal OD600 for all doses of H2O2 and equal total protein content (Figure 1B). These results show that H2O2 is not bacteriocidal rather bacteriostatic at moderate (1 to 10 mM) concentration. A time-dependent adaptation to H2O2-induced toxicity was observed in E. coli (DH5α) that was proportional to concentration of H2O2 in the growth medium. An adaptive response to H2O2- induced cytotoxicity was characterized by depletion of catalase activity and regulation of cellular iron content. Catalase, the central enzyme that regulates intracellular level of H2O2, depleted by ~75% and remained almost invariable at all concentrations of H2O2 tested (1 mM to 10 mM) (Figure 1C). These results show that E. coli (DH5α) regulates the toxic level of cytosolic ROS content by reducing degradation of H2O2, that is the less toxic compared to O2•- and OH•- [1]. Recent investigation shows that oxidative stress has a profound effect on cellular iron concentration [30]. Hence, we analyzed the intracellular iron content of E. coli (DH5α) grown in LB containing different concentration of H2O2. Our results show that E. coli (DH5α) grown in LB possess 30-40 nmol of iron/ mg protein (Figure 1D). Intracellular iron is depleted at lower doses (1-2.5 mM) of H2O2 and increased at higher doses (5-10 mM) of H2O2. These results show that E. coli (DH5α) regulates intracellular iron content as an adaptive mechanism to survive the H2O2-induced toxicity.
Figure 1b: Total cellular protein of cells collected at 16th h of growth and quantitated as described in methods.
Figure 1c: Effect of H2O2 on catalase activity. The rate of depletion of H2O2 as indicated by A240 was analyzed using GraphPad prism after fitting the curves in to Michelis- Menten equation. Concentration of H2O2 in the growth medium for each curve is shown to the lower-right corner of the figure. The inset (bar diagram) shows the relative amount of catalase activity of E. coli (DH5α) at different doses of H2O2.
Figure 1d: Iron content of cells grown in LB containing different concentration of H2O2.
H2O2 increases lipid peroxidation through formation of conjugated dienes
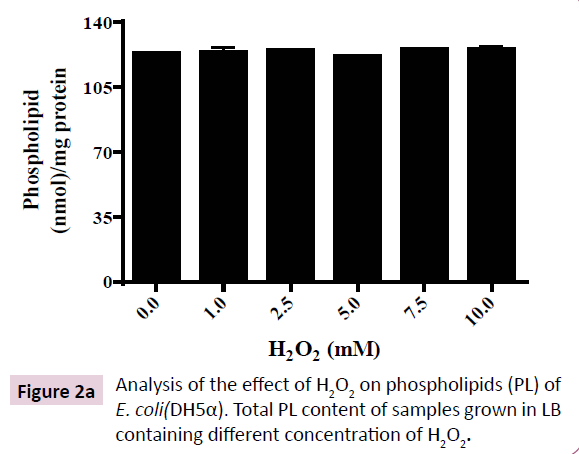
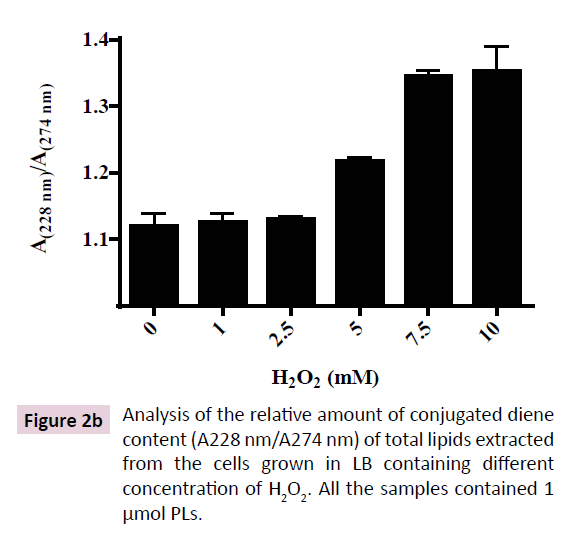
Diene conjugation is an initial step in the mechanism of lipid peroxidation. Extraction and quantitation of total lipid from E. coli (DH5α) at saturation phase shows that H2O2 up to 10 mM doesn’t affect total cellular lipid content (Figure 2A). However, increasing doses of H2O2 led to augmentation of conjugated diene level in E. coli (DH5α) (Figure 2B). Low level of H2O2 (1-2.5 mM) produced negligible amount of conjugated diene that increased up to 30% at 7.5 mM H2O2 and was not further augmented up to 10 mM H2O2. Hence, H2O2-induced formation of conjugated diene was saturable at 7.5 mM H2O2. These results indicate the existence of oxidative-stress regulatory mechanism in E. coli that buffers the conjugated diene level at 30% above the normal cellular level as a strategy to survive H2O2-induced toxicity.
Figure 2b: Analysis of the relative amount of conjugated diene content (A228 nm/A274 nm) of total lipids extracted from the cells grown in LB containing different concentration of H2O2. All the samples contained 1 μmol PLs.
E. coli (DH5α) regulates cellular PL composition as an adaptive mechanism to survive oxidative stress.
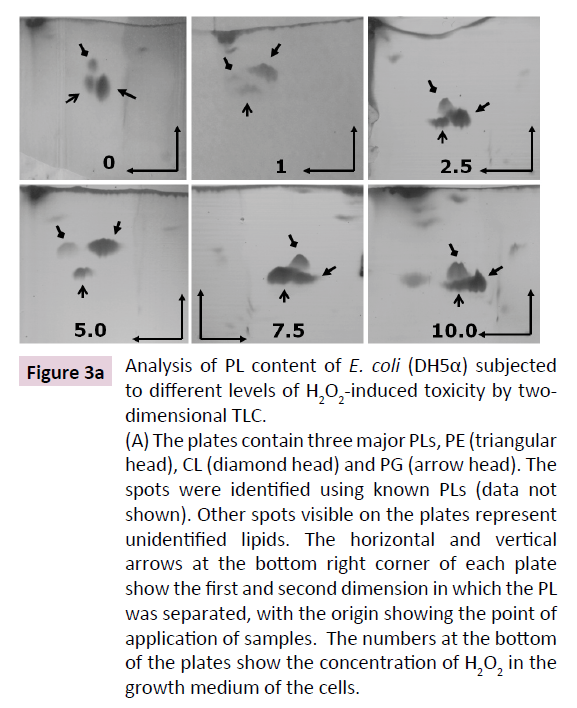
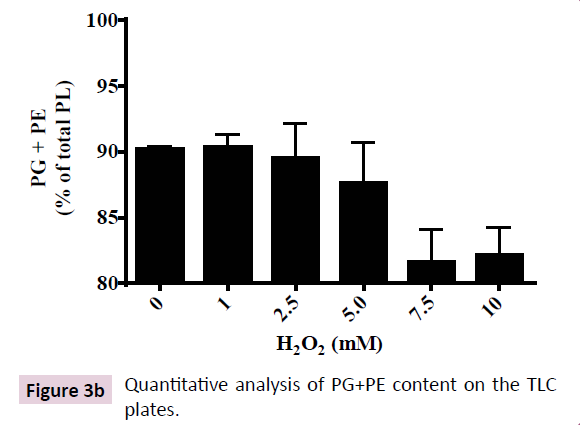
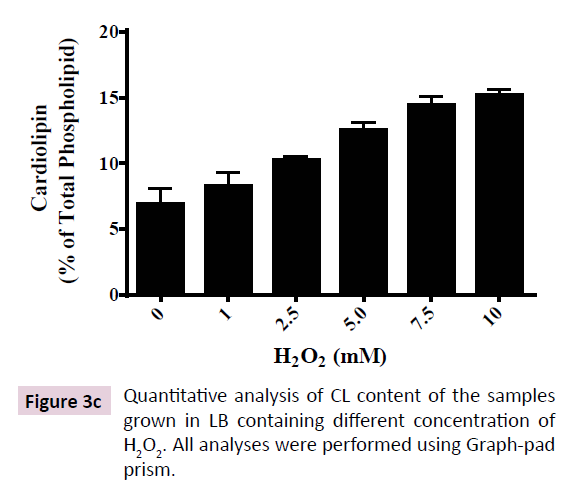
PLs that constitute ~89% of total lipids in E. coli are known to be altered in a multitude of stress conditions like high temperature, salinity, growth phase and toxic compounds [17-19,31-33]. CL is proposed to be the most unsaturated PL that possesses the most variable composition of fatty-acyl tails that is upregulated in multiple stress conditions [21]. Hence, we performed a quantitative analysis of PL composition of E. coli (DH5α) subjected to increasing concentration of H2O2 (from 1 to 10 mM). 2D-TLC shows three major PLs that constituted up to 95% of total PL loaded on the plate (Figure 3A).Three major PLs were identified as PE, PG and CL using PL standards (not shown). In control cells, PE and PG together constituted ~90% of the total PL, CL being ~7%. Increasing doses of H2O2 up to 10 mM led to augmentation of CL up to 15% (two fold) accompanied by corresponding depletion in PG+PE content to 82% (Figure 3B and 3C).
Figure 3a: Analysis of PL content of E. coli (DH5α) subjected
to different levels of H2O2-induced toxicity by twodimensional
TLC.
(A) The plates contain three major PLs, PE (triangular
head), CL (diamond head) and PG (arrow head). The
spots were identified using known PLs (data not
shown). Other spots visible on the plates represent
unidentified lipids. The horizontal and vertical
arrows at the bottom right corner of each plate
show the first and second dimension in which the PL
was separated, with the origin showing the point of
application of samples. The numbers at the bottom
of the plates show the concentration of H2O2 in the
growth medium of the cells.
Discussion
H2O2 is consistently generated in almost all cell types by several enzymes (including superoxide dismutase, glucose oxidase, and monoamine oxidase) that is detrimental to the cells and must be degraded to prevent oxidative damage [34,35]. Recent investigation reveals the use of exogenously administered H2O2 in imaging of pathological cells [36]. Apart from the normal physiological processes, a high level of H2O2 has been implicated in many pathological conditions including diabetes, cardiovascular diseases, neurodegenerative disorders and cancer [37-41]. Oxidative stress is recognized as a major contributor to aging and age-associated disease [42-46] and evidence suggests its involvement in the development of sarcopenia [47].
Our investigation shows a lipid-mediated cellular regulatory mechanism in response to exogenously added H2O2, using E. coli (DH5α) as a model system. H2O2-induces cytotoxicity in E. coli by reducing growth rate, however, without altering saturation density of cells or protein content indicating a bacteriostatic effect of H2O2 on the bacterium (Figure 1A and 1B). Our investigation shows that catalase activity is reduced by 75% in response to exogenous H2O2 at all concentration tested (Figure 1C). Catalase is the central oxidative stress regulatory enzyme in E. coli that is involved in maintenance of cytosolic H2O2- homeostasis. Reduced activity of catalase is observed in multiple cell types with increasing cytosolic H2O2, including developing rat oligodendrocytes [48] and aging sarcopenia [46]. H2O2-induced depletion in catalase activity was also observed as early as 1931 [49]. Depletion of catalase activity at elevated cytosolic H2O2 is a regulatory mechanism to maintain the oxidative stress at minimum, as H2O2 is known to be the less reactive compared to superoxide anion (O2•) and hydroxyl radical (OH•).
A depletion of cellular iron content was observed in cells cultured in presence of low (1 to 2.5 mM) concentration of H2O2 in growth medium. At low concentration of H2O2, cells are known to reduce cytosolic free iron content by converting them into tight, proteinbound form as observed in many different cell types including bacteria, plants and animals [50-52]. Reports suggest that oxidative stress induced by O2 and H2O2 lead to downregulation of iron regulatory protein (IRP) causing transient decrease of cytosolic free iron that otherwise would convert them into more potent oxidants such as hydroxyl radicals or equally aggressive iron-peroxo complexes [53]. H2O2-induced oxidative stress probably by over expression of high-affinity iron-binding proteins like Dps, Dpr, ferritins, IRR and OxyR that are known to scavenge free cytosolic iron leading to reduced detection of cytosolic iron [50, 53-58].
However, higher ( > 2.5 mM) doses of H2O2 is known to destroy the iron-sulfur (FeS) centers of many proteins containing iron-sulfur clusters, releasing the protein-bound iron that leads to augmentation of cytosolic pool of free iron content (Figure 1D) [30,59,60]. Fe-S enzymes (e.g. aconitase, succinate dehydrogenase, and ubiquinol-cytochrome c oxidoreductase), as well as cytosolic Fe-S enzymes (sulfite reductase and isopropylmalate isomerase) are known to release iron in response to elevated level of oxidative stress [30]. Our results indicate a biphasic effect of H2O2 on cytosolic iron of E. coli corresponding to low and high concentration of the oxidant as proposed in earlier studies.
Conjugated diene is one of the initial products of lipid peroxidation that is formed due to abstraction of hydrogen from double bonds of unsaturated fatty acyl chains of lipids [26,61]. Our results show that lipid peroxidation is negligible up to 2.5 mM H2O2 and is initiated beyond this concentration. However, higher concentration (≥ 5 mM) of H2O2 increased conjugated diene content of lipids. No alteration in total lipid content was observed (Figure 2A and 2B), implying that phospholipid biosynthesis remains unaltered under all the concentration of H2O2 tested. A 30% enhancement in conjugated diene content was observed at 7.5 mM H2O2, beyond which the cells resisted further enhancement in conjugated diene content. This phenomenon is explained by assuming either strict regulation of diene conjugation or by conversion of conjugated dienes into terminal products (e.g. lipid hydroperoxides and lipid peroxyl radicals) of lipid peroxidations.
A previous report suggested an important role of lipid in resistance of apoptotic cells to H2O2-induced [62]. Alteration of PL composition in biological membranes is a regulatory mechanism for maintenance of optimal packing and fluidity essentially required for function of many membrane proteins [63]. Cells respond to extreme environmental conditions by altering PL composition or by altering fatty-acyl composition of membrane lipids [17,19,31-33]. Biological membranes are known to reorganize their lipids in response to perturbations that modifies their polar head groups [64]. Our results show that higher concentration of H2O2 (5 mM to 10 mM) leads to oxidation of lipids in E. coli (DH5α) indicating a detrimental effect on plasma membrane (Figure 2B). We hypothesize that augmentation of CL content accompanied by depletion of PG+PE is a regulatory mechanism to adapt to oxidative membrane damage induced by high concentration of H2O2.
CL is essential for the function of multiple membrane-bound proteins and organization of electron transport chain [21,65]. Further, oxidative stress induced-disruption of iron homeostasis is partially due to loss of cardiolipin from inner bacterial and mitochondrial membranes resulting in damage to Fe-S centers of their proteins [22]. CL is required for biogenesis of proteins containing Fe-S cluster and maintenance of mitochondrial and bacterial iron homeostasis [22]. Hence, a twofold enhancement of CL content in response to higher concentration (5 mM to 10 mM) of H2O2 might be an adaptive mechanism to compensate for oxidative modification of membrane lipid and proteins.
In summary, our results support the previous findings by Imlay et al. that H2O2 shows a biphasic toxic effect on E. coli [13]. Our present investigation suggests that at low concentration of H2O2, (i) no lipid peroxidation was initiated, (ii) no protein-bound iron was released and (iii) no significant alteration in PL composition was observed. These results imply that low conc. of H2O2 doesn’t exhibit lipotoxicity in E. coli (DH5α). Hence, the observed growth reduction at 1-2.5 mM H2O2 was probably due to the genotoxic effects of H2O2 [2,66]. However, higher concentration (>2.5 mM) of H2O2 exerts its cytoxicity in part by lipid oxidation. Our previous work shows that treatment with toxic heavy metals such as Hg and Co that induce lipid peroxidation in bacteria, also alters their PL composition [67,68]. However, more studies are required to confirm if similar changes in PL composition is a general oxidative stress response mechanism in Gram negative bacteria.
Conclusion
In conclusion, our results show that in E. coli, H2O2-induced toxicity leads to lipid peroxidation and alters cellular lipid composition. Lipid peroxidation is mediated through formation of conjugated dienes, depletion of catalase activity and oxidative attack on Fe-S clusters that releases the protein-bound iron. At 10 mM H2O2, CL content increases by twofold, whereas PG+PE is depleted by 20%. Recent evidences show that ROS affect organization of rafts in mammalian cells under oxidative stress [20,65]. Our findings provide the scope of understanding the membrane-based oxidative stress signaling processes under multiple physiological conditions that enhance cytosolic H2O2. To cite some examples, eukaryotic immune-defense mechanism uses augmentation of cytosolic H2O2 against the invading microbes and plant cells upregulate H2O2 under the effect of transfecting Agrobacterium. Further investigation is required to reveal the effect of H2O2- induced toxicity on membrane-based mechanisms such as membrane biogenesis and membrane asymmetry and their role in oxidative stress signaling in different cells.
Acknowledgements
We thank Department of Science and Technology, Govt of Odisha, India for funding. H.G. Behuria thanks Department of Science and Technology, Govt of India for fellowship.
Conflict of Interest Statement
The authors of the present work declare no conflict of interest.
References
- Halliwell B, Gutteridge JMC (1984) Oxygen toxicity, oxygen radicals, transition metals and disease. J Biochem 219: 1-14.
- Imlay JA, Chin SM, Linn S (1988) Toxic DNA damage by hydrogen peroxide through the Fenton reaction in vivo and in vitro. Science 240: 640-642.
- Fenton HJH (1894) Oxidation of tartaric acid in presence of iron. J Chem Soc 65: 899-910.
- Haber F, Weiss JJ (1934) The catalytic decomposition of hydrogen peroxide by iron salts. Proc R Soc London Ser A 147: 332-351.
- Mello-Filho AEC, Meneghini R (1985) Protection of mammalian cells by phenanthroline from lethal and DNA damaging effects produced by active oxygen species. Biochim Biophys Acta 847: 82-89.
- Meneghini R (1988) Genotoxicity of active oxygen species in mammalian cells. Mutat Res 195: 215-230.
- Levin DE, Holistein M, Christman MF, Schwiers EA, Ames BN, et al. (1982) A new Salmonella tester strain (TA102) with AT base pairs at the site of mutation detects oxidative mutagens. Proc Natl Acad Sci USA 79: 7445-7449.
- McCormick JP, Fischer JR, Pachlatko JP, Eisenstark A (1976) Characterization of a cell-lethal product from the photooxidation of tryptophan: hydrogen peroxide. Science 191: 468-469.
- Gregory EM, Yost FJ, Fridovich I (1973) Super-oxide dismutases of Escherichia coli: intracellular localization and functions. J Bacteriol 115: 987-991.
- Imlay JA (2013) The molecular mechanisms and physiological consequences of oxidative stress: lessons from a model bacterium. Nat Rev Microbiol 11: 443-454.
- Gregory EM, Fridovich I (1973) Induction of superoxide dismutase by molecular oxygen. J Bacteriol 114: 543-548.
- Ames BN, Shigenaga MK, Hagen TM (1993) Oxidants, anti-oxidants and the degenerative diseases of aging. Proc Natl Acad Sci USA 90: 7915-7922.
- Imlay JA, Linn S (1986) Bimodal pattern of killing of DNA-repair-defective or anoxically grown Escherichia coli by hydrogen peroxide. J Bacteriol 166: 519-527.
- Ames GF (1968) Lipids of Salmonella typhimurium and Escherichia coli: structure and metabolism. J Bacteriol 95: 833-843.
- Schniederberend M, Zimmann P, Bogdanov M, Dowhan W, Altendorf K, et al. (2010) Influence of K+-dependent membrane lipid composition on the expression of the kdpFABC operon in Escherichia coli. Biochim Biophys Acta 1798: 32-48.
- Hiraoka S, Matsuzaki H, Shibuya I (1993) Active increase in cardiolipin synthesis in the stationary phase and its physiological significance in Escherichia coli. FEBS Lett 336: 221-224.
- Catucci L, Depalo N, Lattanzio VMT, Agostiano A, Corcelli A, et al. (2004) Neosynthesis of cardiolipin in Rhodobacter sphaeroides under osmotic stress. Biochemistry 43: 15066-15072.
- Heber S, Tropp BE (1991) Genetic regulation of cardiolipin synthase in Escherichia coli. Biochim Biophys Acta 1129: 1-12.
- Shibuya I (1992) Metabolic regulations and biological functions of phospholipids in Escherichia coli. Prog Lipid Res 31: 245-299.
- Morgan MJ, Kim Y, Liu Z (2007) Lipid rafts and oxidative stress–induced cell death. Antioxid Redox Signal 9: 1471-1484.
- Hoch FL (1992) Cardiolipins and biomembrane function. Biochim Biophys Acta 113: 71-133.
- Patil VA, Fox JL, Gohil VM, Winge DR, Greenberg ML, et al. (2013) Loss of cardiolipin leads to perturbation of mitochondrial and cellular iron homeostasis. J Biol Chem 288: 1696-1705.
- Lowry OH, Rosebrough NJ, Farr AL, Randall RJ (1951) Protein measurement with the Folin phenol reagent. J Biol Chem 193: 265-275.
- Bligh EG, Dyer WJ (1959) A rapid method for total lipid extraction and purification. Can. J Biochem Physiol 37: 911-917.
- Fiske C, Subarrow Y (1925) The colorimetric determination of phosphorous. J Biol Chem 66: 375-400.
- Howlett NG, Avery SV (1997) Induction of lipid peroxidation during heavy metal stress in Saccharomyces cerevisiae and influence of plasma membrane fatty acid unsaturation. Appl Env Microbiol 63: 2971-2976.
- Schneiter R, Daum G (2006) Analysis of yeast lipids. Methods Mol Biol 313: 75-84.
- Reimer J, Hoepken HH, Czerwinska H, Robinson SR, Dringen R, et al. (2004) Colorimetric ferrozine based assay for the quantitation of iron in cultured cells. Anal Biochem 331: 370-375.
- Beers RF, Sizer IWA (1952) Spectrophotometric method for measuring the breakdown of hydrogen peroxide by catalase. J Bio Chem 795: 133-140.
- Liochev SL (1996) The role of iron-sulfur clusters in in vivo hydroxyl radical production. Free Radic Res 25: 369-84.
- de Siervo, AJ (1969) Alterations in the phospholipid composition of Escherichia coli B during growth at different temperatures. J Bacterial 100: 1342-1349.
- Kanemasa Y, Yioshioka T, Hayashi H (1972) Alteration of the phospholipid composition of Staphylococcus aureus cultures in medium containing NaCl. Biochim Biophys Acta 280: 444-450.
- Rosas SB, Del Carmen Secco M, Ghittoni NE (1980) Effects of pesticides on the fatty cid and phospholipid composition of Escherichia coli. Appl Environ Microbiol 40: 231-234.
- Giorgio M, Trinei M, Migliaccio E, Pelicci PG (2007) Hydrogen peroxide: a metabolic by-product or a common mediator of ageing signals? Nature Reviews Mol Cell Biol 8: 722-728.
- González-Flecha B, Demple B (1995) Metabolic sources of hydrogen peroxide in aerobically growing Escherichia coli.J Biol Chem 270: 13681-13687.
- Weinstain R, Savariar EN, Felsen CN, Tsien RY (2014) In vivo targeting of hydrogen peroxide by activatable cell-penetrating peptides. J Am Chem Soc 136: 874−877.
- Houstis N, Rosen ED, Lander ES (2006) Reactive oxygen species have a causal role in multiple forms of insulin resistance. Nature 440: 944-948.
- Touyz RM, Schiffrin EL (2004) Reactive oxygen species in vascular biology: implications in hypertension. Histochem Cell Biol 122: 339-352.
- Cai H (2005) Hydrogen peroxide regulation of endothelial function: origins, mechanisms and consequences. Cardiovasc Res 68: 26-36.
- Barnham KJ, Masters CL, Bush AI (2004) Neurodegenerative diseases and oxidative stress. Nat Rev Drug Discov 3: 205-214.
- Reuter S, Gupta SC, Chaturvedi MM, Aggarwal BB (2010) Oxidative stress, inflammation and cancer: how are they linked? Free Radical Biol Med 49: 1603-1616.
- Harraz MM, Marden JJ, Zhou W, Zhang Y, Williams A, et al. (2008) SOD1 mutations disrupt redox-sensitive Rac regulation of NADPH oxidase in a familial ALS model. J Clin Invest 118: 659-670.
- Jang YC, Liu Y, Hayworth CR, Bhattacharya A, Lustgarten MS, et al. (2012) Dietary restriction attenuates age-associated muscle atrophy by lowering oxidative stress in mice even in complete absence of CuZnSOD. Aging Cell 11: 770-782.
- Muller FL, Song W, Liu Y, Chaudhuri A, Pieke-Dahl S, et al. (2006) Absence of CuZn superoxide dismutase leads to elevated oxidative stress and acceleration of age-dependent skeletal muscle atrophy. Free Radic Biol Med 40: 1993-2004.
- Wei Y, Sowers JR, Nistala R, Gong H, Uptergrove GM, et al. (2006) Angiotensin II-induced NADPH oxidase activation impairs insulin signaling in skeletal muscle cells. J Biol Chem 281: 35137-35146.
- Sullivan-Gunn MJ, Lewandowski PA (2013) Elevated hydrogen peroxide and decreased catalase and glutathione peroxidase protection are associated with aging sarcopenia. BMC Geriatr 13: 104-112.
- Fulle S, Protasi F, Di Tano G, Pietrangelo T, Beltramin A, et al. (2004) The contribution of reactive oxygen species to sarcopenia and muscle ageing. Exp Gerontol 39: 17-24.
- Baud O, Greene AE, Li J, Wang H, Volpe JJ, et al. (2004) Glutathione peroxidase–catalase cooperativity is required for resistance to hydrogen peroxide by mature rat oligodendrocytes. J Neurosci 24: 1531-1540.
- Morgulis S (1931) Studies on the inactivation of catalase iii destruction of catalase by hydrogen peroxide. J Biol Chem 92: 377-383.
- Andrews SC, Robinson AK, Rodriguez-Quinones H (2003) Bacterial iron homeostasis. FEMS Microbiol Rev 27: 215-237.
- Briat J, Ravet K, Arnaud N, Duc C, Boucherez J, et al. (2010) New insights into ferritin synthesis and function highlight a link between iron homeostasis and oxidative stress in plants. Ann Bot 105: 811-822.
- Pantopoulos K, Porwal SK, Tartakoff A, Devireddy L (2012) Mechanisms of mammalian iron homeostasis. Biochemistry 51: 5705-5724.
- Cairo G, Castrusini E, Minotti G, Bernefti-Zazzera A (1996) Superoxide and hydrogen peroxide-dependent inhibition of iron regulatory protein activity: a protective stratagem against oxidative injury. FASEB J 10: 1326-1335.
- Cornelis P, Wei Q, Andrews SC, Vinckx T (2011) Iron homeostasis and management of oxidative stress response in bacteria. Metallomics 3: 540-549.
- Ishikawa T, Mizunoe Y, Kawabata S, Takade A, Harada M, et al. (2003) The iron-binding protein Dps confers hydrogen peroxide stress resistance to Campylobacter jejuni. J Bacteriol185: 110-117.
- Tree JJ, Ulett GC, Ong CY, Trott DJ, McEwan AG, et al. (2008) Trade-off between iron uptake and protection against oxidative stress: deletion of cueO promotes uropathogenic Escherichia coli virulence in a mouse model of urinary tract infection. J Bacteriol 190: 6909-6912.
- Tsou C, Chiang-Ni C, Lin Y, Chuang W, Lin MT, et al. (2008) An iron-binding protein, Dpr, decreases hydrogen peroxide stress and protects Streptococcus pyogenes against multiple stresses. Infect Immune 76: 4038-4045.
- Yamamoto Y, Fukui K, Koujin N, Ohya H, Kimura K, et al. (2004) Regulation of the intracellular free iron pool by Dpr provides oxygen tolerance to Streptococcus mutans. J Bacteriol 186: 5997-6002.
- Djaman O, Outten FW, Imlay JA (2004) Repair of oxidized iron-sulfur clusters in Escherichia coli. J Biol Chem 279: 44590-44599.
- Lemire JA, Harrison JJ, Turner JR (2013) Antimicrobial activity of metals: mechanisms, molecular targets and applications. Nat Rev Microbiol11: 371-384.
- Minotti G, Auste SD (1987) The Requirement for iron (III) in the Initiation of Lipid peroxidation by iron (II) and hydrogen peroxide. J Biol Chem 262: 1098-1104.
- Brand A, Gil S, Seger R, Yavin E (2001) Lipid constituents in oligodendroglial cells alter susceptibility to H2O2-induced apoptotic cell death via ERK activation. J Neurochem 76: 910-918.
- de Kruijff B (1997) Lipid polymorphism and biomembrane function. Curr Opin Chem Biol 1: 64-69.
- Hazel JR, Williams EE (1990) The role of alterations in membrane lipid composition in enabling physiological adaptation of organisms to their physical environment. Prog Lipid Res 29: 167-227.
- Schlame M (2008) Cardiolipin synthesis for the assembly of bacterial and mitochondrial membranes. J. Lipid Res 49: 1607-1620.
- D’Autreaux B, Toledano MB (2007) ROS as signalling molecules: mechanisms that generate specificity in ROS homeostasis. Nat Rev Mol Cell Biol 8: 813-824.
- Sahu SK, Behuria HG, Gupta S, Dalua RB, Sahoo S, et al. (2016) Biochemical characterization of high mercury tolerance in a Pseudomonas Spp. isolated from industrial effluent. AJC Microb 4: 41-54.
- Sahu SK, Dalua RB, Sahoo S, Parida D, Ghosh S, et al. (2016) Cobalt-induced cytotoxicity in E. coli(DH5α) is mediated by modulation of cellular phospholipid composition. J adv Microbial 5: 215-223.
Open Access Journals
- Aquaculture & Veterinary Science
- Chemistry & Chemical Sciences
- Clinical Sciences
- Engineering
- General Science
- Genetics & Molecular Biology
- Health Care & Nursing
- Immunology & Microbiology
- Materials Science
- Mathematics & Physics
- Medical Sciences
- Neurology & Psychiatry
- Oncology & Cancer Science
- Pharmaceutical Sciences
