ISSN : 2321-2748
American Journal of Phytomedicine and Clinical Therapeutics
Assessment of the Weight Reducing Potentials of Ethanolic Seed Extract of Cola lepidota K Schum in High Fat Fed Female Albino Wistar Rats
Chukwuemeka O.G.1*; Okafor, P.N.1; Nwankpa,P.2; Ibeh, R.C.1; Ugwuezumba, P.C.3; Ekweogu, C. N.2; Izunwanne, D. I.3; Emengaha, F. C.2; Etteh,C. C.2; Ngwu, E. E.3; Oyeyemi, A. W.4
1Department of Biochemistry, Michael OkparaUniversity of Agriculture, Umudike, Abia State, Nigeria
2Department of Biochemistry, Imo State University, Owerri, Imo State, Nigeria
3Department of Medical Physiology, Imo State University, Owerri, Imo State, Nigeria
4Department of Physiology, Igbinedion University Okada, Edo State, Nigeria
- *Corresponding Author:
- Chukwuemeka OG
Department of Biochemistry
Michael Okpara University of Agriculture
Umudike, Abia State, Nigeria
Tel: +2347039448590
E-mail: wayataya@yahoo.com
Received Date: October 15, 2018; Accepted Date: November 30, 2018; Published Date: December 03, 2018
Citation: Chukwuemeka OG, Okafor PN, Nwankpa P, Ibeh RC, Ugwuezumba PC, Ekweogu CN, Izunwanne DI, Emengaha FC, Etteh CC, Ngwu EE, Oyeyemi AW (2018) Assessment of the Weight Reducing Potentials of Ethanolic Seed Extract of Cola lepidota K. Schum in High Fat Fed Female Albino Wistar Rats. Am J Phytomed Clin Ther Vol.6 No.3:14. doi: 10.21767/2321-2748.100350
Abstract
The present study was carried out to assess the weight reducing potentials of the ethanolic seed extract of Cola lepidota K. Schum in 54 female wistar albino rats (Rattus norvergicus) weighing 80-90 g at 6 weeks (42 days of age) using anthropometrical measurements. Nine (9) experimental groups involving the distribution of six (6) female rats in each group were carried out. The LD50 of the seed extract was 2525 mg/kg and percentage yield of 200 g of the ethanol seed extract was 0.25%. The anthropometrical measurements showed that abdominal circumference (AC) (cm), thoracic circumference (TC) (cm), and body length (BL) (cm) of rats in all the groups increased progressively (P ≤ 0.05) throughout the experimental period which lasted 80 days. After the 50th day of treatment percentage weight loss for groups 3, 4, 5, 7, 8, and 9 was 24.4%, 16.63%, 17.15%, 21.29%, 16.6% and 26.25% respectively while their mean BMI (g/cm2) was restored towards the end of the experiment while groups 2 and 6 attained significantly high mean body weights (g) at 441.33 ± 2.87 g and 359.13 ± 8.95 g respectively by the end of the experiment with their mean BMI remaining high at the end of the investigation. AC/TC ratio was not promising as an indicator to measure overweight/obesity predisposition in the rats rather BMI (g/cm2) was. Lee index (LI) on the other hand, seemed promising in cardiovascular investigation. Result showed that groups 2 and 6 had statistically same (P>0.05) but higher mean LI than the rest of the groups from the 55th day of treatment to the end of the experiment. The study reports a normal BMI range of 0.34 ± 0.00 to 0.44 ± 0.00 g/ cm2. Thus, BMI values above this range were considered indicators of overweight and obesity predisposition. The implications of these findings are discussed.
Keywords
Cola lepidota; Abdominal circumference; Thoracic circumference; Body weight; Body mass index; Abdominal circumference; Thoracic circumference ratio; Lee index; Ethanolic seed extract
Introduction
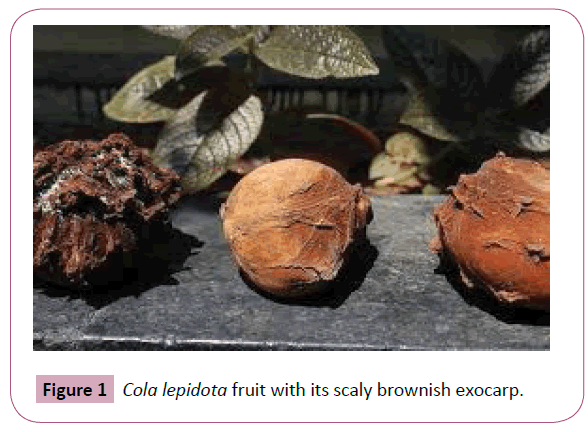
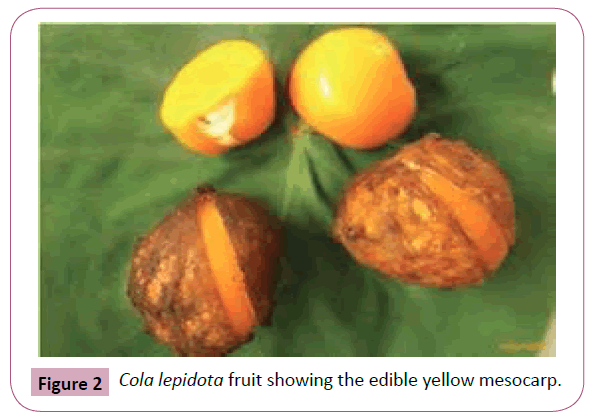
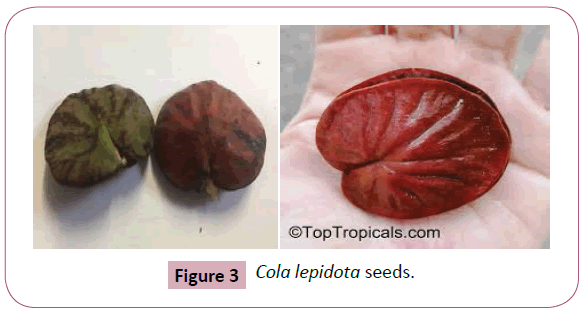
Medicinal plants are so called because they contain various biologically active components which are largely products of plant secondary metabolism usually referred as phytochemicals or natural products. These bioactive compounds can be used to treat chronic as well as infectious diseases [1]. Some research findings have revealed that the use of ethnopharmacological knowledge is one attractive way to reduce empiricism and enhance the probability of success in new drug finding efforts [2,3]. According to World Health Organization (WHO), more than 80% of the world’s population depends on traditional medicine for their primary healthcare needs [4]. Most plant materials contain fiber and the fiber content of fruits have been reported to possess certain blood cholesterol lowering action and aid in the prevention of large bowel disease reported that fruits are low in calorie and can as well help reduce one’s calories intake as part of a weight loss diet [5,6] and enlisted Cola lepidota as an under-utilized fruit. All these research findings point to the fact that plant constituents have therapeutic potentials. Cola lepidota is a member of the family of Sterculiaceae and belongs to a group called drupes [7]. The pod of Cola lepidota is yellowish and roundish and is also called Yellow Monkey Kola, while the white variety which is Cola parchycarpa has more cylindrical shape and is also called White Monkey Kola. Cola lepidota is cultivated throughout the tropical regions of the world. It is commonly found in Southern Nigeria between the months of June to November [8]. Cola lepidota fruits are highly nutritious and medicinal [7] and both Cola lepidota (having yellow pod), Cola parchycarpa (having white pod) and Cola lateritia (having red pod) all belong to the family of monkey kola [9]. Cola lepidota is mostly consumed fresh and it has a very short life span probably due to its high moisture content and its hard texture which limits its consumption particularly among the vulnerable group (i.e., children and aged) due to poor dentition. Cola lepidota is a selected specie for this study because of its traditional use in some parts of Abia State as a weight reducer and research findings have shown that it contains significantly higher phytochemical constituents than other species and it is more widely distributed [9-11]. Okudu reported that Cola lepidota juice contains significantly higher phytochemical constituents than Cola parchycarpa. Also Okudu were able to investigate the phytochemical constituents of the membranes and seeds of Cola lepidota and revealed that B-vitamins, particularly riboflavin and niacin were found in significant amount in Cola lepidota membrane and both C. lepidota and C. parchycarpa had substantial amounts of phytochemicals (particularly alkaloids, phenols, flavonoids and saponins. Essien detected from their phytochemical screening, alkaloids, saponins, terpenoids, carbohydrates, and flavonoids in the seeds and fruit pulp extracts of C. lepidota K. Schum and C. rostrata. No research has been conducted yet on Cola lepidota seed with respect to its weight reducing potentials in high fat fed female albino wistar rats. Therefore, the present study remains the foremost research to reveal the weight reducing potentials of the said seed in rats. Nonetheless, the high phytochemical values obtained in Cola lepidota seed makes it an important seed that needs to be fully exploited [9]. Some researchers have reported that C. lepidota is employed in Nigerian folk medicine as febrifuges, for pulmonary problems and cancer related ailments [12]. The leaf and stem bark extracts of C. lepidota have been studied [11] with respect to its antioxidant activity [10], anticancer [12] and acute toxicity [13- 15]. According to the problem of obesity may be initially due to uneven distribution across population, however, urbanization, change in lifestyle and dietary habit, change in structure and technology, more leisure time and sedentary activities as well as reduced body exercise may be largely contributory. Currently, more than 1 billion adults are overweight and at least 300 million of them are clinically obese [16]. WHO also reported that women are more likely to be obese than men in all WHO regions [16]. According to WHO, in Africa, Eastern Mediterranean and South East Asia, women had roughly double the obesity prevalence of men [17]. The data presented on the prevalence of overweight and obesity from the 2013 - 2014 National Health and Nutrition Examination Survey (NHANES) and National Centre for Health Statistics (NCHS) on US citizens showed that women were more obese (about 40%) than men (35%) while the National Institute of Diabetes and Digestive Kidney Diseases showed that women had extreme obesity (9.9%) than men (5.5%) [18]. An excerpt from Women’s Strength Training Anatomy by Frederic Delavier shows that one of the main morphological differences between men and women is the greater amount of fat that women carry [19]. This according to softens the outline of the muscles, more or less erases the osseous indicators, and rounds out the surfaces while creating characteristic folds and grooves. Frederic further revealed that fat in normal women represents between 18% and 20% of body weight, whereas in men it represents only 10% to 15% [19]. The reason for this difference, Frederic says, is that women at some point in their lives may nourish a foetus and then a baby from their own reserves, so women have to stock energy in the form of fat in anticipation of future pregnancies (and must stock even more energy during the last two trimesters of pregnancy) [19]. WHO reported that obesity has nearly tripled between 1975 and 2016 and that in 2016, more than 1.9 billion adults, 18 years and older, were overweight. Of these, over 600 million were obese [20]. Also, WHO reported that most of the world’s population lives in countries where overweight and obesity kill more people than underweight [20]. Worldwide, at least 2.8 million people die each year as a result of being overweight or obese, and an estimated 35.8 million (2.3%) of global Disability Adjusted Life Years (DALYs) are caused by overweight or obesity [17]. World Health Organization (WHO) also looked at overweight and obesity distribution in Nigerians as it relates gender as reported according to the 2010 WHO survey data on Nigeria, the prevalence of overweight was 26% and 37% in men and women, respectively, while the prevalence of obesity was 3% and 8.1% in men and women, respectively [21,22]. It was reported that in most countries within the European region where there is prevalence of obesity, the number of obese women surpasses the number of obese men, sometimes as much as 2–1. A study carried out in Jos, Nigeria revealed that the prevalence of overweight and obesity amongst the sampled adult Nigerians was 21.4% in males and 23.5% in females (Male: Female=1:1.3, P<0.05) [23]. The high burden of cardiovascular disease (CVD) in the developing countries is attributable to the increasing incidence of atherosclerotic diseases, perhaps due to urbanization and higher risk factor levels (such as obesity, diabetes, dyslipidemia, hypertension, etc [24]. With urbanization, changing lifestyles, diminished assess/availability of fresh vegetables as well as increased consumption of processed foods, the number of people with obesity tends to increase. Therefore, a critical management of traditional medicinal plant resources has become a matter of urgency [25]. For the sake of this investigation, standard drugs such as orlistat, simvastatin, and ascorbic acid (Vitamin C) will be used to monitor the weight reducing effects of the seed extract. The Cola lepidota fruit was identified at Forestry Department, Michael Okpara University of Agriculture Umudike, Abia State, Nigeria. The below are the pictures of Cola lepidota fruits and seeds. Figure 1 is the mature, intact Cola lepidota fruit. It shows the scaly exocarp that is usually hard but can be easily cut open with a knife. The fruit does not have a definite shape. Its shape comes from the shape and size of the seed inside it. The exocarp is usually brownish in colour and covered with tiny hairs. This portion of the exocarp must be removed to get to the edible yellowish mesocarp. Figure 1 shows two slightly torn scaly exocarps, revealing the edible yellow pulps as well as two yellow pulps completely devoid of the scaly exocarp. It is these yellow pulps that are often relished. Figure 1 three Cola lepidota seeds which are obliquely ovoid with two flattered surfaces and are usually rough with either reddishbrown or greenish colour. The seeds contain hairy spines within the interior of the opposing faces. These hairy spines could be the major reason why earlier people preferred consuming its closer specie, Cola nitida.
Materials and Methods
Procedures/Protocols
Collection of plant materials: Cola lepidota K. Schum fruits were purchased from a local market in Aba, Abia State, Nigeria and were identified in the Forestry Department of Michael Okpara University of Agriculture, Umudike by Mr. Ibe Ndukwe and the seed specimen stored in the Department’s herbarium.
Determination of percentage yield of the ethanolic seed extract of Cola Lepidota: The percentage yield of ethanolic extract of C. lepidota seeds was determined by comparing the weight of the initial dry powdered seed with that of the final concentrated seed extract and calculated using the formula:
Percentage yield=weight (g) of concentrated seed extract/ weight(g) of dry powdered seed × 100
Oral acute toxicity of ethanolic seed extract: The oral acute toxicity of the ethanolic seed extract was performed with the proposed [26] which involved four stages, with the outcome of the first stage determining the next step to take whether to terminate or proceed to the next stage.
Experimental animals: Fifty four (54) female albino wistar rats (Rattus norvergicus) weighing 80 - 90 g at 6 weeks (42 days) of age were used for this study. The animals were bought from laboratory animal facility of the Department of Biochemistry, University of Nigeria Nsukka and were housed under standard environmental conditions for a period of 7 days for the purpose of acclimatization before the experiment commenced. During acclimatization, the animals were fed standard rat chow and clean water ad libitum.
Nine (9) experimental groups involving the distribution of six (6) female rats in each group were carried out and animals were housed in an environmentally friendly animal house in the Department of Veterinary Medicine, Michael Okpara University of Agriculture Umudike (MOUAU) with a room temperature (approx. 25°C) in a 12 hour light and 12 hour dark cycle. The animal experiment was carried out in the Department of Veterinary Medicine, MOUAU, according to the University’s ethics on animal handling.
High Fat Diet (HFD) teed tormulation: HFD feed formulation was done according to the method [27].
Animal grouping and treatment
Group 1 (control): Rats in this group received exclusively, fresh 200 g of normal rat chow daily, throughout the experimental period of 80 days. Food and water consumption were measured daily at the same time (12 pm -1 pm) and the average result taken at 10 days intervals throughout the experimental period while the anthropometrical measurements taken in triplicates within 10 days intervals though out the experimental period according to the method [28].
Group 2 (exclusive hfd group) (negative control): Rats in this group received exclusively, fresh 200 g of HFD daily, throughout the experimental period of 80 days. Food and water consumption were measured daily at the same time (12 pm - 1 pm) and the average result taken at 10 days intervals throughout the experimental period while the anthropometrical measurements taken in triplicates within 10 days intervals throughout the experimental period according to the method [29].
Group 3 (hfd+extract): Rats in this group received exclusively, fresh 200 g of HFD daily without oral seed extract administration for only a period of 30 day in order to establish overweight to the rats. After this period, the rats continued on 200 g fresh daily HFD with a concomitant daily oral dose of 300 mg/kg seed extract throughout the remaining 50 days of the experimental period. Food and water consumption were measured daily at the same time (12 pm - 1 pm) and the average result taken at 10 days intervals throughout the experimental period while the anthropometrical measurements taken in triplicates within 10 days intervals throughout the experimental period according to the method.
Group 4 (hfd+orlistat): Rats in this group received exclusively, fresh 200 g of HFD daily without oral orlistat administration for only a period of 30 days in order to establish overweight to the rats. After this period, the rats continued on 200 g fresh daily HFD with a concomitant daily oral dose of 120 mg/kg orlistat throughout the remaining 50 days of the experimental period. Food and water consumption were measured daily at the same time (12 pm - 1 pm) and the average result taken at 10 days intervals throughout the experimental period while the anthropometrical measurements taken in triplicates within 10 days intervals throughout the experimental period according to the method.
Group 5 (hfd+simvastatin): Rats in this group received exclusively, fresh 200 g of HFD daily without oral simvastatin administration for only a period of 30 days in order to establish overweight to the rats. After this period, the rats continued on 200 g fresh daily HFD with a concomitant daily oral dose of 20 mg/kg simvastatin throughout the remaining 50 days of the experimental period. Food and water consumption were measured daily at the same time (12 pm – 1 pm) and the average result taken at 10 days intervals throughout the experimental period while the anthropometrical measurements taken in triplicates within 10 days intervals throughout the experimental period according to the method.
Group 6 (hfd+ascorbic acid (vitamin c): Rats in this group received exclusively, fresh 200 g of HFD daily without oral ascorbic acid administration for only a period of 30 days in order to establish overweight to the rats. After this period, the rats continued on 200 g fresh daily HFD with a concomitant daily oral dose of 300 mg/kg ascorbic acid throughout the remaining 50 days of the experimental period. Food and water consumption were measured daily at the same time (12 pm-1 pm) and the average result taken at 10 days intervals throughout the experimental period while the anthropometrical measurements taken in triplicates within 10 days intervals throughout the experimental period according to the method.
Group 7 (hfd+extract+orlistat): Rats in this group received exclusively, fresh 200 g of HFD daily without oral seed extract and orlistat combination dose administration for only a period of 30 days in order to establish overweight to the rats. After this period, the rats continued on a daily 200 g fresh HFD with a daily oral combination therapy of 300 mg/kg of seed extract and 120 mg/kg of orlistat throughout the remaining 50 days of the experimental period. Food and water consumption were measured daily at the same time (12 pm – 1 pm) and the average result taken at 10 days intervals throughout the experimental period while the anthropometrical measurements taken in triplicates within 10 days intervals throughout the experimental period according to the method.
Group 8 (hfd+extract+simvastatin): Rats in this group received exclusively, fresh 200 g of HFD daily without oral seed extract and simvastatin combination dose administration for only a period of 30 days in order to establish overweight to the rats. After this period, the rats continued on a daily 200 g fresh HFD with a daily oral combination therapy of 300 mg/kg of seed extract and 20 mg/kg of simvastatin throughout the remaining 50 days of the experimental period. Food and water consumption were measured daily at the same time (12 pm – 1 pm) and the average result taken at 10 days intervals throughout the experimental period while the anthropometrical measurements taken in triplicates within 10 days intervals throughout the experimental period according to the method.
Group 9 (hfd+extract+ascorbic acid): Rats in this group received exclusively, fresh 200 g of HFD daily without oral seed extract and ascorbic acid combination dose administration for only a period of 30 days in order to establish overweight to the rats. After this period, the rats continued on a daily 200 g fresh HFD with a daily oral combination therapy of 300 mg/kg of seed extract and 300 mg/kg of ascorbic acid throughout the remaining 50 days of the experimental period. Food and water consumption were measured daily at the same time (12 pm - 1 pm) and the average result taken at 10 days intervals throughout the experimental period while the anthropometrical measurements taken in triplicates within 10 days intervals throughout the experimental period according to the method.
Anthropometrical parameters: Abdominal Circumference (AC) (cm), Thoracic Circumference (TC) (cm), Body Length (BL) (cm), Body weight (BW) (g), AC/TC ratio and Body mass index (BMI) (g/cm2) were measured according to the method [29] while Lee index (LI) (3 g/cm) was measured according to Bernardis. The above anthropometric measurements were determined in all rats in triplicates within ten days intervals. The measurements were carried out by first anaesthetizing the rats using ethyl ether inhalation.
Statistical analysis
Statistical analyses were processed using Statistical Program of Social Sciences (SPSS) for windows version 23.0. Values of the measured parameters were expressed as mean value ± standard error of mean (SEM) and the differences between groups were determined using one-way analysis of variance (ANOVA) and the variant mean was separated by least significant difference (LSD) of the different groups and significance was considered at P value ≤ 0.05.
Results and Discussion
Results
Percentage yield of ethanolic seed extract of C. lepidota: Percentage yield=weight of concentrated seed extract/weight of dry powdered seed × 100
Therefore, % yield=0.5 g/200 g × 100=0.25%
Median Lethal Dose (LD50) for acute oral toxicity of ethanolic seed extract of C. lepidota: LD50=M0+M1/2
Where M0=highest dose of test substance that gave no mortality; M1=lowest dose of test substance that gave no mortality.
Therefore, LD50=50 mg/kg+5000 mg/kg/2=2525 mg/kg
Anthropometrics
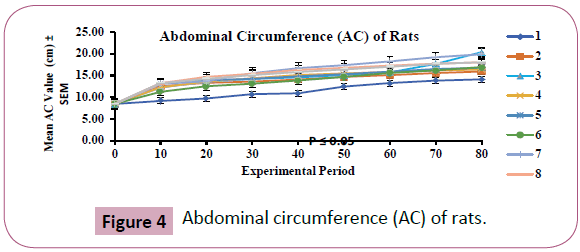
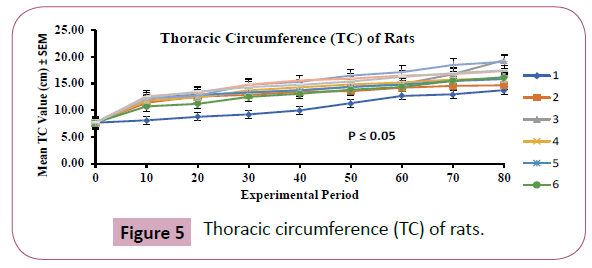
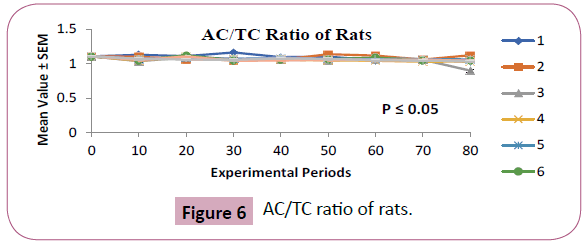
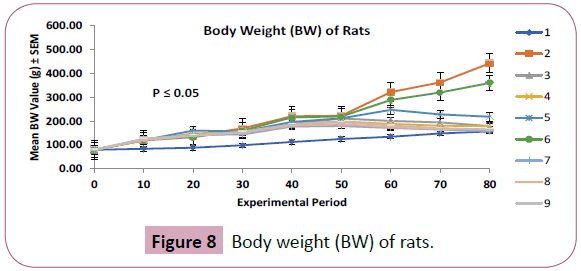
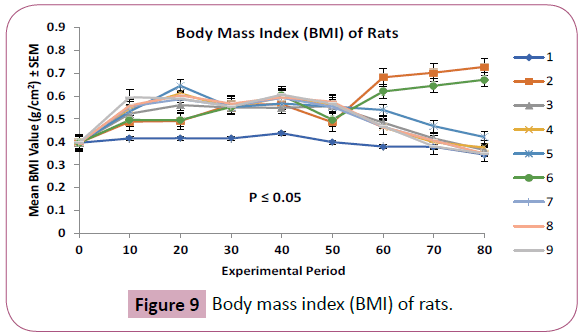
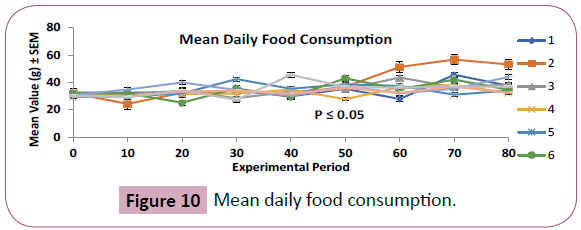
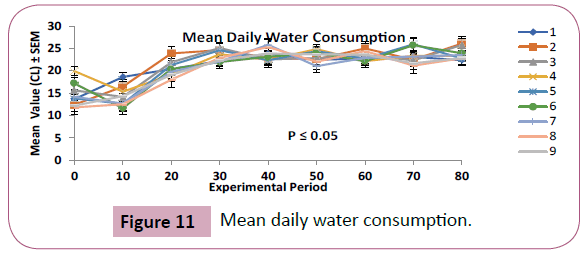
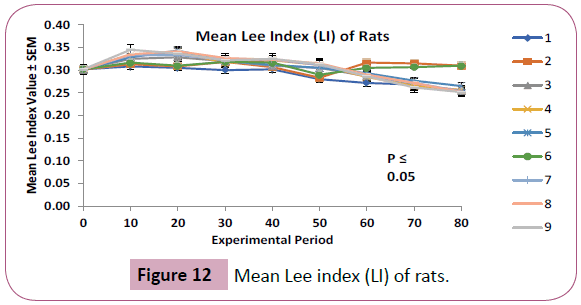
Figure 2 shows the graphical representation of the mean abdominal circumference (AC) values in centimeter (cm) ± standard error of mean (SEM) of the rats during the experimental period that lasted for eighty (80) days. The rats were divided into nine (9) groups (i.e., groups 1 to 9) as highlighted in the graphical legend above. Each group comprised six (6) female rats. Figure 2 shows that there were progressive increase in the AC of all the groups from the initial day of treatment to the final day, suggesting the influence of feeding, growth and age. Significance was at P ≤ 0.05 while non-significance was at P>0.05. Results were obtained in triplicates. Figure 2 shows the graphical representation of the mean thoracic circumference (TC) values in centimeter (cm) ± standard error of mean (SEM) of the rats during the experimental period that lasted for eighty (80) days. The rats were divided into nine (9) groups (i.e., groups 1 to 9) as highlighted in the graphical legend above. Each group comprised six (6) female rats. Figure 1 shows that the thoracic circumference of the rats increased progressively throughout the experimental period, suggesting that feeding and growth as well as age were the impacting factors. Figure 2 shows the graph of the mean AC/TC ratio values of the groups. The rats were divided into nine (9) groups as highlighted in the legend and each group contained six (6) rats. Figure 2 however, shows that AC/TC ratio was not promising as an accurate indicator for overweight/obesity predisposition investigation in the rats as there were no statistical differences between group 2 and group 1 at some points during the course of the experiment. Figure 2 shows the graphical representation of the mean body length (BL) values in centimeter (cm) ± standard error of mean (SEM) of the rats during the experimental period that lasted for eighty (80) days. The rats were divided into nine (9) groups (i.e., groups 1 to 9) as highlighted in the graphical legend above. Each group comprised six (6) female rats. Figure 2 shows that there were progressive increase in body length of all the groups during the experimental period and this is suggesting that feeding, growth and age are the influencing factors. Figure 2 shows the graphical representation of the mean body weight (BW) values in gram (g) ± standard error of mean (SEM) of the rats during the experimental period that lasted for eighty (80) days. The rats were divided into nine (9) groups (i.e., groups 1 to 9) as highlighted in the graphical legend above. Each group comprised six (6) female rats. Figure 2 shows that ethanolic seed extract of Cola lepidota has weight reducing activities since groups 3, 7, 8, and 9 as well as groups 4 and 5 had reduced weights after the 50th day of treatment whereas groups 2 and 6 maintained a consistent weight gain during the course of the experiment. Figure 2 shows the graphical representation of the mean body mass index (BMI) values in g/cm2 ± standard error of mean (SEM) of the rats during the experimental period that lasted for eighty (80) days. The rats were divided into nine (9) groups (i.e., groups 1 to 9) as highlighted in the graphical legend above. Each group comprised six (6) female rats. Figure 3 shows that the ethanolic seed extract of Cola lepidota has an ant obesity activities since the mean BMI of groups 3, 7, 8, and 9 as well as groups 4 and 5 were restored to normal BMI after the 50th day of treatment when compared with group 1 while groups 2 and 6 maintained high BMI values at the end of the experiment. Figure 3 shows the graphical representation of the mean daily food consumption values in g ± SEM of the rats during the experimental period that lasted for eighty (80) days. The rats were divided into nine (9) groups (i.e., groups 1 to 9) as highlighted in the graphical legend above. Each group comprised six (6) female rats. Figure 4 shows that there were no consistency in the quantity of food consumed daily by each group except for group 2 that consumed more than the rest of the groups from the 60th day of feeding to the end of the experiment, suggesting that the serum lipid condition of this group could have reached a hyper lipidemic state from the 60th day of treatment thus, triggering enormous free radical production which in turn trigger decreased leptin sensitivity in the hypothalamus of the rats, hence more food consumption at these periods. Figure 5 shows the graphical representation of the mean daily water consumption values in centiliter (cl) ± SEM of the rats during the experimental period that lasted for eighty (80) days. The rats were divided into nine (9) groups (i.e., groups 1 to 9) as highlighted in the graphical legend above. Each group comprised six (6) female rats. Figure 6 shows that there was no consistency in the quantity of water consumed in a day by each group indicating that all the groups drank water ad libitum and neither feeding nor extract/drug treatment influenced their water consumption. Figure 7 shows the graphical representation of the mean lee index (LI) values in cube root of body weight divided by body length ± SEM of the rats during the experimental period that lasted for eighty (80) days. The rats were divided into nine (9) groups (i.e., groups 1 to 9) as highlighted in the graphical legend above. Each group comprised six (6) female rats. Figure 7 shows that groups 2 and 6 had higher mean Lee index values than the rest of the groups from the 50th day of treatment and data obtained showed that groups 2 and 6 were statistically same (P>0.05). This suggests that groups 2 and 6 may have been more predisposed to a cardiovascular condition within the experimental period due to the HFD that was formulated with unrefined palm kernel oil (PKO). The rest of the groups were statistically same (P>0.05) with group 1.
Discussion
The oral acute toxicity assay which was obtained from the median lethal dose (LD50) showed that the seed extract was not toxic to the rats as there were no signs of toxicity such as fatigue, falling hairs, distress, convulsion, restlessness, numbness, etc, and no deaths were recorded as shown in Table 1. The LD50 of the Cola lepidota seed extract is 2525 mg/kg, thus the LD50 was greater than 2000 mg/kg. The percentage yield of 200 g of the ethanolic seed extract is 0.25%. Data obtained from anthropometrical measurements showed that the abdominal circumference (AC) (cm), thoracic circumference (TC) (cm), and body length (BL) (cm) of rats in all the groups increased progressively (P ≤ 0.05) throughout the experimental period that lasted 80 days as can be seen in Figures 4-7 respectively. This progressive increase is suggestive of the influence of feeding, growth and age. Figure 6 revealed that AC/TC ratio was not promising as an accurate indicator in the assessment of overweight/obesity predisposition in the rats since there were no statistical differences between groups 1 and 2 at the 10th, 20th, 40th, 50th and 70th day of treatment. There were significant differences (P ≤ 0.05) in the body weights (BW) of the rats in all groups when compared with that of group 1 (negative control) as shown in Figure 8. All groups had significant increase in weight from initial day of treatment to the 50th day of treatment when decrease in weight began in groups 3 (200.67 ± 2.59 g, 194.43 ± 2.34 g, and 179.17 ± 0.32 g at 60th, 70th and 80th day of treatment respectively), 4 (188.35 ± 1.10 g, 180.6 ± 0.73 g, and 178.87 ± 3.06 g at 60th, 70th, and 80th day of treatment respectively), 7 (171.28 ± 2.50 g, 164.53 ± 1.68 g, and 158.20 ± 2.10 g at 60th, 70th, and 80th day of treatment respectively), 8 (174.52 ± 1.76 g, 166.70 ± 2.95 g, and 164.77 ± 0.92 g at 60th, 70th, and 80th day of treatment respectively), and 9 (181.48 ± 2.08 g, 170.43 ± 0.49 g, and 165.27 ± 1.58 g at 60th, 70th, and 80th day of treatment respectively) while decrease in weight for group 5 started after the 60th day of treatment (i.e., 228.03 ± 1.14 g at 70th day of treatment and 218.32 ± 0.34 g at 80th day of treatment). Groups 2 (positive control) and 6 maintained the highest increase in body weight after the 50th day of treatment (i.e., 321.23 ± 3.90 g, 361.6 ± 4.12 g, and 441.33 ± 2.87 g at 60th, 70th, and 80th day of treatment respectively for group 2 while 288.42 ± 6.20 g, 319.6 ± 4.82 g, and 359.13 ± 8.95 g at 60th, 70th, and 80th day of treatment respectively were for group 6). For group 2, the observed body weight gain is indicative of the impact of the exclusive high fat diet intake that resulted in high energy stores in form of fats with limited utilization probably in form of exercise, considering the fact that the rats had limited space to play and exercise. Several studies, have reported the importance of exercise in weight reduction or obesity prevention [30]. It was reported that physical exercise significantly reduced fat deposits and Lee index in hypothalamic monosodium glutamate (MSG) – induced obesity [31] while Jacqueline reported that voluntary exercise improves metabolic profile in high fat fed glucocorticoid-treated rats. A study reported that moderate exercise restores pancreatic beta cell function and autonomic nervous system activity in obese rat induced by high fat diet. The increased weight observed in group 6 after the 50th day of treatment showed that ascorbic acid (vitamin C) is not a weight reducing agent. Groups 3, 4, 7, 8, and 9 attained their highest weights at the 50th day of treatment with the following mean values 211.20 ± 1.37 g, 198.57 ± 4.08 g, 179.33 ± 2.60 g, 187.33 ± 1.31 g, and 195.58 ± 1.29 g respectively while they had respective weight decrease after the 50th day of treatment. Group 5 on the other hand, attained its highest weight at the 60th day of treatment at 246.93 ± 6.53 g. Nevertheless, groups 2 and 6 attained their highest weight values of 441.33 ± 2.87 g and 359.13 ± 8.95 g respectively at the end of the experiment. The consistency in weight reduction for groups 3, 4, 7, 8, and 9 after the 50th day of treatment and group 5 after the 60th day of treatment as shown both in Figure 8 suggests that the extract, orlistat, and simvastatin possess weight reducing qualities. Notwithstanding, the mechanism of actions of orlistat and simvastatin are known to a large extent, that of the extract is yet to be explored and elucidated. However, the qualitative phytochemical analysis conducted on the ethanolic seed extract revealed the presence of some important phytochemicals like flavonoids, saponins, steroids, PUFAs, tannins, alkaloids, phenols, and terpenoids. Thus, the weight reduction may be as a result of the hypolipidemic effect of C. lepidota seed which could be modulated by the flavonoid content as flavonoids have been variously implicated in the reduction of lipid profile by inhibiting hepatic HMG-CoA reductase [32,33]. On the otherhand reported that C. lepidota seed extract may also inhibit cholesterol absorption from the intestine due to the formation of complexes with compounds such as glycosides and saponins [34]. while another study revealed that decrease the total cholesterol and triacylglycerols of rats [35]. Two studies have suggested that the underlying mechanism of lipid lowering effect of C. lepidota could be by inhibition of lipid absorption due to the presence of saponins in Cola lepidota [36,37]. While another suggested that the mechanism of lipid lowering effect of Cola lepidota could be as a result of inhibition of cholesterol esterase, activation of fatty acid synthase, acetyl-CoA carboxylase and production of triacylglycerol precursors such as acetyl-CoA and glycerol phosphate [38]. Throughout the experimental period, the total weight lost in group 3 as calculated from the statistical data in appendix 15 was 32.03 ± 1.05 g out of 131.08 ± 6.72 g gained which is equivalent to 24.4% weight loss while that of groups 4, 5, 7, 8, and 9 were 19.7 ± 1.02 g out of 118.45 ± 4.06 g gained; 28.61 ± 0.34 g out of 166.81 ± 6.51 g gained; 21.13 ± 1.34 g out of 99.21 ± 2.58 g gained; 17.8 ± 0.94 g out of 107.21 ± 1.29 g gained and 30.31 ± 4.27 g out of 115.46 ± 0.27 g gained respectively. The percentage weight loss for groups 4, 5, 7, 8, and 9 were 16.63%, 17.15%, 21.29%, 16.6%, and 26.25% respectively. The percentage weight loss for these groups is tabulated in Table 2. Data obtained reveal that daily combination therapies with the ethanolic seed extract and orlistat (group 7) as well as extract and ascorbic acid (group 9) yielded more percentage weight reduction than treatment with single daily doses of either orlistat or ascorbic acid as can be seen in Table 3. Though, the combination of seed extract and simvastatin did not yield greater percentage weight reduction as compared to a daily single dose of simvastatin. Thus, the extract did not show any synergistic weight reducing effect with simvastatin in group 8. Nevertheless, since there were no observed weight reductions in group 6, it seems that the weight reduction observed in group 9 could be attributed majorly on the weight reducing capacity of the seed extract. Presently, most antiobesity drugs such as amphetamine, rimonabant, and sibutramine had all lost their licences due to adverse effects which include among others, psychiatric disorders, and myocardial infarction or stroke [39]. Thus, orlistat (Xenical) stands as the only available form of prescribed obesity medication which acts on the gastrointestinal system and works by reducing fat absorption in the gut which is eliminated in bowel movements [40]. Research has it that orlistat prevents approximately 30% of dietary fat from being absorbed [41]. Higher doses however, do not produce more potent effects [42]. Orlistat is an inhibitor of lipase enzymes in the intestine [43]. Thus, preventing the hydrolysis of dietary triacylglycerols into monoacylglycerols and fatty acids [44]. Therefore, absorption of dietary fat is reduced [43]. Furthermore, orlistat is preferred to other withdrawn anti obesity drugs because of its safety for cardiovascular events and positive effects on diabetic control [39]. Simvastatin on the other hand, functions as an inhibitor of HMG-CoA reductase, thus, preventing de novo cholesterol biosynthesis and subsequently reducing lipid profile. Reports by Everyday Health show that simvastatin increases the number of low-density lipoprotein cholesterol (LDL-C) receptors in the liver, so that more blood LDL-C can be processed in the liver [45]. The body mass index (BMI) (g/cm2) of the rats were observed and data in Figure 9 show that the BMI of groups 3 (0.48 ± 0.01 g/cm2, 0.41 ± 0.01 g/ cm2, and 0.36 ± 0.00 g/cm2 at 60th, 70th and 80th day of treatment respectively), 4 (0.46 ± 0.00 g/cm2, 0.40 ± 0.00 g/cm2, and 0.38 ± 0.01 g/cm2 at 60th, 70th and 80th day of treatment respectively), 7 (0.46 ± 0.01 g/cm2, 0.41 ± 0.01 g/cm2, and 0.35 ± 0.01 g/cm2 at 60th, 70th and 80th day of treatment respectively), 8 (0.46 ± 0.01 g/ cm2, 0.41 ± 0.00 g/cm2, and 0.35 ± 0.01 g/cm2 at 60th, 70th, and 80th day of treatment), and 9 (0.47 ± 0.01 g/cm2, 0.38 ± 0.00 g/ cm2, and 0.35 ± 0.01 g/cm2 at 60th, 70th, and 80th day of treatment respectively) were restored to normal BMI after the 50th day of treatment as compared to the group 1 whose BMI ranged from 0.34 ± 0.00 g/cm2 to 0.44 ± 0.00 g/cm2 while group 5 had restored BMI after the 60th day of treatment (i.e., 0.47 ± 0.00 g/cm2 and 0.42 ± 0.01 g/cm2 at 70th and 80th day of treatment respectively),. On the other hand, groups 3, 4, 5, 7, 8, and 9 attained their highest BMI values at the 50th day of treatment at 0.56 ± 0.01 g/ cm2, 0.56 ± 0.01 g/cm2, 0.55 ± 0.03 g/cm2, 0.50 ± 0.01 g/cm2, 0.55 ± 0.01 g/cm2, 0.58 ± 0.02 g/cm2, and 0.57 ± 0.01 g/cm2 respectively) while BMI increased consistently in groups 2 and 6 during the cost of the experiment and was highest at the 80th day of treatment (i.e., 0.73 ± 0.01 g/cm2 and 0.67 ± 0.01 g/cm2 respectively). Thus, taking the BMI of group 1 as a yard-stick for assessing normal BMI of the rats, it means that the normal BMI values for the female albino wistar rats in this study falls within the ranges of 0.34 ± 0.00 to 0.44 ± 0.00 g/cm2 i.e., BMI>0.34 ± 0.00 ≤ 0.44 ± 0.00 g/cm2. Therefore, BMI value above 0.44 ± 0.00 g/cm2 is considered an indicator of overweight/obesity predisposition in the study. Group 2 (positive control) and 6 recorded the highest BMI values, hence, remained overweight or predisposed to being obese. However a study reported that normal BMI for adult male rats ranged between the values observed at 60 and 90 days of age (0.45 ± 0.02 to 0.68 ± 0.05 g/ cm2). Conversely, the present study reveals that the normal BMI for adult female rats ranged between the values observed at 82 and 122 days of age (0.34 ± 0.00 to 0.44 ± 0.00 g/cm2). Another study reported that normal BMI for female rats range between 0.4504 to 0.5044 g/cm2 [46]. Anthropometrical method of obesity determination in rats is gradually gaining interests in recent times especially when compared to that of leptin hormone investigation. This is because under certain physiological conditions such as the presence of enough leptin hormone concentrations in the system, leptin hormone assessment as a biomarker for obesity may present deluding results especially when employed on females. Evidence has shown that leptin hormone (LH) is more effective in the male gender than the female gender when considering BMI [47]. Women have greater leptin concentrations than men [48] and this appears to be the reason why the effects of leptin on weight loss and other physiological parameters appear to be more pronounced during states of relative leptin deficiency [49-51] and largely ineffective in states of leptin excess [52]. The mean daily food consumption as revealed in Figure 10 shows no consistency with respect to increased or decreased consumption. However, group 2 that fed exclusively on HFD throughout the experimental period consumed more than the rest of the groups with 51.34 ± 1.57 g, 56.79 ± 0.72 g and 53.16 ± 1.38 g at 60th, 70th and 80th day of treatment respectively, as can be seen in appendix. This suggests that the serum lipid condition of the group 2 rats could have reached a hyper lipidaemic state from the 60th day of treatment to the end of the experiment, thus triggering enormous free radical production which in turn trigger decreased leptin sensitivity in the hypothalamus, hence more food consumption. It has been observed that individuals with higher percentage body fat exhibit a higher circulating concentration of leptin than normal weight individuals and that these individuals show resistance to leptin, similar to resistance of insulin in type 2 diabetes, with the elevated levels failing to control hunger and modulate their weight [53]. Evidence shows that rats consume more of their calories from higher fat foods [54]. A study reported that there is decreased leptin sensitivity in obesity, resulting in an inability to detect satiety despite high energy stores and high levels of leptin [55]. The inconsistency of the amount of daily food consumed with respect to increased or decreased consumption in the rest of the groups proves that the rats fed ad libitum. The mean daily water consumption as presented in Figure 11 and appendix showed no consistency with respect to increased or decreased consumption and this indicates that the rats drank water ad libitum and that neither feeding nor extract/drug treatment influenced their water consumption. The Lee index result obtained and presented in Figure 12 showed that groups 2 and 6 were statistically the same (P>0.05) and had higher mean Lee index values than the rest of the groups from the 60th day of treatment to the end of the experiment. On the other hand, groups 3, 4, 5, 7, 8, and 9 were statistically the same (P>0.05) as seen in appendix. This suggests that groups 2 and 6 may have been more predisposed to cardiovascular events than the rest of the groups due to the HFD that was formulated with unrefined palm kernel oil (PKO), a highly saturated oil [56].
| Group 1 (mg/kg) | Signs of Toxicity | Group 2 (mg/kg) | Signs of Toxicity | Group 3 (mg/g) | Signs of oxicity | Group 4 (mg/g) | Signs of oxicity | |
|---|---|---|---|---|---|---|---|---|
| Stage 1 | 50 | None | 200 | None | 400 | None | 800 | None |
| Stage 2 | 1000 | None | 1500 | None | 2000 | None | ||
| Stage 3 | 3000 | None | 4000 | None | 5000 | None | ||
| Stage 4 | 5000 | None | 5000 | None |
Table 1: Doses and outcome of oral acute toxicity assay.
| Dates | Days | Rat ages (days) | Groups | |||||||||
|---|---|---|---|---|---|---|---|---|---|---|---|---|
| 1 | 2 | 3 | 4 | 5 | 6 | 7 | 8 | 9 | ||||
| 2/11/17 | 0 | 42 | + | + | + | + | + | + | + | + | + | |
| 12/11/17 | 10 | 52 | + | + | + | + | + | + | + | + | + | |
| 22/11/17 | 20 | 62 | + | + | + | + | + | + | + | + | + | |
| 2/12/17 | 30 | 72 | + | + | + | + | - | + | + | + | + | |
| 12/12/17 | 40 | 82 | + | + | + | + | + | + | + | + | + | |
| 22/12/17 | 50 | 92 | + | + | + | + | + | + | + | + | + | |
| 1/1/18 | 60 | 102 | + | + | - | - | + | + | - | - | - | |
| 11/1/18 | 70 | 112 | + | + | - | - | - | + | - | - | - | |
| 21/1/18 | 80 | 122 | + | + | - | - | - | + | - | - | - | |
Table 2: Weight Gained (+) or Lost (-) During the Experimental Period.
| Groups | % Weight loss |
|---|---|
| Group 3 (HFD+Extract) | 24.4 |
| Group 4 (HFD+Orlistat) | 16.63 |
| Groups 5 (HFD+Simvastatin) | 17.15 |
| Group 7 (HFD+Extract+Orlistat) | 21.29 |
| Group 8 (HFD+Extract+Simvastatin) | 16.60 |
| Group 9 (HFD+Extract+Vitamin C) | 26.25 |
Table 3: Groups and % Weight Loss.
Conclusion
Results showed favorable extract-drug interactions which resulted in synergistically amplified biological effects. Plant products have long been a thriving source for new drug discovery, and this find use among the most common complementary and alternative medicine systems [57]. Diets high in fat tend to promote overweight and obesity; therefore, inhibiting digestion and absorption of dietary fats become a logical remedy to treat obesity. The anthropometrical parameters reveal that the ethanolic seed extract of Cola lepidota possesses weight reducing activities on the high fat fed albino Wistar rats.
Recommendation
There is a great deal of differences in reports pertaining normal BMI value for laboratory rats. According to a study a normal BMI range of 0.45 ± 0.02 to 0.68 ± 0.05 g/cm2 for male albino rats [28]. While another study showed a normal BMI range of 0.4504 to 0.5044 g/cm2 for female albino rats [46]. The present study reports a normal BMI range of 0.34 ± 0.00 to 0.44 ± 0.00 g/cm2 for female albino rats. There are fewer reports on BMI ranges for laboratory rats. Therefore, further researches need to be conducted so as to drive a consensus within biological research oriented scientific bodies on what should be the generally acceptable normal BMI range for laboratory albino rats so that it becomes a proper yard-stick when dealing with weight-related investigations in laboratory rats. BMI seemed promising as an indicator of increased body weight/obesity in rats and should be considered in future studies when dealing with weight related cases in rats.
References
- Duraipandiyan V, Ayyanar M, Ignacimuthu S (2006) Antimicrobial activity of some ethnomedicinal plants used by Paliyar tribe from Tamil Nadu India. BMC Complementary Altern Med 6: 35-41.
- Patwardhan B (2005) Ethnopharmacology and drug discovery. Journal of Ethnopharmacology 100: 50-52.
- Cordell GA, Colvard MD (2005) Some thoughts on the future of ethnopharmacology. J Ethno Pharmacol 100: 5-14.
- World Health Organization (1992) Quality Control Methods for medicinal plant materials. Geneva, Switzerland.
- Williams JY, Popovski S, Rea SM (2009) A vaccine against Rumen Methanogens can alter the composition of Archaeal population. J Appl Environ Microbiol 75: 1860-1866.
- Obong HN, Okudu HO, Asumugha VU (2016) Nutrient and phytochemical compositions of two varieties of monkey kola (Cola parchycarpa, Cola lepidota). An underutilized fruit. 10th International Food Data Conference (IFDC): Joining nutrition, agriculture and food safety through food composition. J Food Chem 193: 154-159.
- Pamplona RGD (2010) Production and proximate analysis of jam (food spread) prepared from Cola parchy carpa. JHER 13: 152-158.
- Ogbu JU, Essien BA, Kadurumba CH (2007) Nutritional value of wild Cola spp. (monkey kola) fruits of southern Nigeria. Nig J Hort Sci 12: 113 -117.
- Okudu HO, Ene OHN, Asumugha VU (2015) The chemical and sensory properties of juice developed from two varieties of monkey kola (Cola parchycarpa, Cola lepidota). Afri J Food Sci Technol 6: 149-155.
- Oghenerobo VI, Falodun A (2013) Antioxidant activities of the leaf extract and fractions of Cola lepidota K. Schum (Sterculiaceae). Nig J Biotech 25: 31-36.
- Essien EE, Peter NS, Akpan SM (2015) Chemical Composition and Antioxidant Property of Two Species of Monkey Kola (Cola rostrata and Cola lepidota K. Schum) Extracts. Euro J Med Plants 7: 31-37.
- Engel N, Opermann C, Falodun A (2011) Proliferative effects of five traditional Nigerian medicinal plant extracts on human breast and bone cancer cell lines. J Ethnopharmacol 137: 1003-1010.
- Imieje V, Igbe I, Falodun A (2013) Phytochemical screening, proximate analysis and acute toxicity studies of leaves of Cola lepidota K. Schum (Sterculiaceae). J Pharma Allied Sci 10: 1684-1689.
- Imieje V, Erharuyi O, Engel N (2014) Antiprotective and apoptotic activities of ola lepidota against estrogen receptor positive breast cancer cells. Scientia Africana 13: 1-8.
- Fournier K, McManus A, Doyle P (2010) The causes of obesity. The University of Vermont, USA 16: 1-19.
- WHO (2013) Cardiovascular diseases (CVDs). Geneva World Health Organization. Fact Sheet No. 317.
- WHO (2014) Obesity: Global Health Observatory (GHO).
- Overweight and Obesity Statistics (2017) National institute of diabetes and digestive and kidney diseases.
- Frederic D (2003) Women’s Strength Training Anatomy.
- WHO (2018) Obesity and Overweight.
- Vander MMT (2008) Obesity in women: A life cycle of medical risk. Menopause Update 11: 10-14.
- Ono T, Guthold R, Strong K (2012) World Health Organization (WHO). Global Comparable Estimates: Global Infobase Data for Saving Lives.
- Peupet FH, Zoakah AL, Chuhwak EK (2002) Prevalence of overweight and obesity among urban Nigeria adults in Jos. Highland Med Res J 1: 13-16.
- Murray CJZ, Lopez AD (1996) The Global Burden of Disease: A Comprehensive Assessment of Mortality and Disability from Diseases, Injuries, and Risk factors in 1990 and Projected to 2020. Boston Mass Harvard School of Public Health.
- Zschocke S, Rabe T, Taylor JL (2000) Plant part substitution-a way to conserve endangered medicinal plants. J Ethno Pharmacol 71: 281-292.
- Chinedu E, Arome D, Ameh FS (2013) A new method for determining acute toxicity in animal models. Toxicol Int 20: 224-226.
- Nna UV, Essien NM, Bassey SC (2014) Comparative effect of chronic consumption of some edible vegetable oils on lipid profile and some haematological parameters in rats. Annals of Biological Research 5: 16-21.
- Novelli EL, Diniz YS, Galhardi CM (2007) Anthropometrical parameters and markers of obesity in rats. Lab Anim 41: 111-119.
- Bernardis LL (1970) Prediction of carcass fat, water and lean body mass from Lee’s nutritive ratio in rats with hypothalamic obesity. Experimentia 26: 789-790.
- Gomes JR, Freitas JR, Grassiolli S (2016) Effects of physical exercise on the intestinal mucosa of rats submitted to a hypothalamic obesity condition. Journal of Gastrointestinal Biology 299: 1389-1396.
- Jacqueline L, Emily CD, Erwan L (2015) Voluntary exercise improves metabolic profile in high fat fed glucocorticoid-treated rats. Journal of Applied Physiology 118: 1331-1343.
- Gomez RM, Tofolo LP, Rinaldi W (2013) Moderate exercise restores pancreatic beta cell function and autonomic nervous system activity in obese rats induced by high fat diet. Cell Physiol Biochem 32: 310-321.
- Jung M, Park M, Lee HC (2006) Antidiabetic agents from medicinal plants. Curr Med Chem 13: 1203-1208.
- Enechi OC, Ozougwu VEO (2014) Effects of ethanol extract of Mucuna prueiena leaves on the lipid profile and serum electrolytes of rats. Journal of Pharmacy and Biological Sciences 9: 18-23.
- Miyake Y, Yamamoto K, Tsujihara N (1998) Protective effects of lemon flavonoids on oxidative stress in diabetic rats. Lipids 33: 689-695.
- Ram A, Lauri P, Gupta R (1997) Hypocholesteromic effects of Terminalia arjuna tree bark. J Ethnopharmacol 55: 165-169.
- Ahmed OM, Monain AA, Yazid IA (2010) Antihyperglycemic, antihyperlipidaemic and antioxidant effects and the probable mechanism of action of Ruta graveoleus infusion and Rutin in nicotinamide-streptozotocin induced diabetic rats. Diabetol Croat 39: 15-35.
- Sharmila BG, Kumar G, Pandian MR (2007) Cholesterol lowering activity of aqueous fruit extract of Trichosanthea dioica Roxb (L.) in normal and ST2 diabetic rats. J Clin Diagn Res 1: 561-569.
- Jun GK, Cheol YP (2012) Antiobesity Drugs: A Review about their Effects and Safety. Diabetes Metab J 36: 13-25.
- Hollywood A, Ogden J (2011) Taking Orlistat: Predicting weight loss over 6 months. Journal of Obesity 2011: 7.
- Physicians’ Desk Reference (2006) Thomson PDR -527-5.
- US Orlistat Label (PDF) (2015) FDA.
- Franson K, Rossner R (2000) Fat intake and food choices during weight reduction with diet, behavioral modification and a lipase inhibitor. Journal of Internal Medicine 247: 607-614.
- Yun W (2010) Possible anti-obesity therapeutics from nature A review. Phytochemistry 71: 1625-1641.
- Everyday Health media LLC (2014) 12-02.
- Engelbregt MJ, Weissenbruch MM, Snijders C (2001) Body mass index, body composition, and leptin at onset of puberty in male and female rats after intrauterine growth retardation and after early postnatal food restriction. Pediatr Res 50: 478.
- Rabiu AM, Wale H, Garba K (2017) Body mass index of male and female Wistar rats following administration of leptin hormone, after a dietary rigime. Annals of Bioanthropology 5: 22-26.
- Mantzoros CS, Moschos SJ (1998) Leptin: In search of role(s) in human physiology and pathophysiology. Clin Endocrinol 49: 551-567.
- Mulligan K, Khatami H, Schwarz JM (2009) The effects of recombinant human leptin on visceral fat, dyslipidemia, and insulin resistance in patients with human immunodeficiency virus-associated lipoatrophy and hypoleptinemia. J Clin Endocrinol Metab 94: 1137-1144.
- Brinkoetter M, Magkos F, Vamvini M (2011) Leptin treatment reduces body fat but does not affect lean body mass or the myostatin-follistatin-activin axis in lean hypoleptinemic women. Am J Physiol Endocrinol Metab 301: 99-104.
- Mantzoros CS, Magkos F, Brinkoetter M (2011) Leptin in human physiology and pathophysiology. Am J Physiol Endocrinol Metab 301: 567-584.
- Considine RV, Sinha MK, Heiman ML (1996) Serum immunoreactiveleptin concentrations in normal-weight and obese humans. N Engl J Med 334: 292-295.
- Kasper JM, Johnson SB, Hommel JD (2014) Fat Preference: A novel model of eating behavior in rats. Journal of Visualized Experiments 88: 51575.
- Pan H, Guo J, Su Z (2014) Advances in understanding the interrelations between leptin resistance and obesity. Physiology and Behavior 130: 157-169.
- Chow CK (2007) Fatty acids in foods and their health implications. 3rd edn. CRC Press.
- Bhutani KK, Gohil VM (2010) Natural products drug discovery research in India: Status and appraisal. Indian J Exp Biol 48: 199-207.
- Najla GS, Nazamid S, Amiz I (2012) Plants’ metabolites as potential antiobesity agents. The Scientific World Journal 2012: 1-8.

Open Access Journals
- Aquaculture & Veterinary Science
- Chemistry & Chemical Sciences
- Clinical Sciences
- Engineering
- General Science
- Genetics & Molecular Biology
- Health Care & Nursing
- Immunology & Microbiology
- Materials Science
- Mathematics & Physics
- Medical Sciences
- Neurology & Psychiatry
- Oncology & Cancer Science
- Pharmaceutical Sciences
