ISSN : 0976-8505
Der Chemica Sinica
Application of Green Chemistry in Chemical Derivatization of Docosanol for Analytical Method Development and Validation in Bulk and Pharmaceutical Formulation by RP-HPLC and UV/Vis-Spectrophotometry including AUC
Ansari Shoaib Ahmed Ayaz Ahmed, Vrushali Patil, Mangesh Ghodke and Pritam Jain*
R.C. Patel Institute of Pharmaceutical Education and Research, Shirpur-425405, Dist. Dhule (M.S) India
Abstract
A simple, rapid, sensitive, robust, RP-HPLC and UV/Vis-Spectrophotometric scheme including AUC (UV-AUC) analytical protocol was developed and validated for the analysis of Docosanol in loose and in cream formulation. Development of RP-HPLC method was achieved on a LC- Hypersil BDS C18 column (100 mm x 4.6 mm; 3 μl) by gradient mode at ambient temperature, employing a mobile phase methanol and (0.01%, v/v) ammonia in ratio of (70:30, v/v), keeping pH at 7.5 at a flow rate of 0.8 mL/min and recognition at 243 nm. UV-AUC method was customized with an aid of a double beam UV- Spectrophotometer (UV-2450, Shimadzu), employing chloroform as a solvent. Area Under Curve (AUC) is measured in the wavelength ranges between 240-245 nm taking maximum absorbance (λ max) at 243 nm. The drug Docosanol is chemically modified into a chromophoric derivative prior to development of analytical methods by applying principles of green chemistry. The reaction is performed under microwave so as to reduce reaction time and to improve yield of the product. The method succeeded over the validation parameters.
Keywords
Docosanol, Monodocosyl phthalate, Chemical derivatization, RP-HPLC, UV/Vis-Spectrophotometry
Introduction
The IUPAC defines Docosanol (DOC) as docosan-1-ol (Figure 1). Docosanol is a saturated 22-carbon aliphatic alcohol with antiviral activity. Docosanol has a distinct mechanism of action and inhibits fusion between the plasma membrane and the herpes simplex virus envelope [1], thereby preventing viral entry into cells and subsequent viral activity and replication [2-5]. Docosanol is applied on infected skin surface in the management of persistent herpes simplex labialis episodes and relieves associated pain and may help heal sores faster [6]. DOC is available in market as a 10% Docosanol cream with a brand name ABREVA. ABREVA holds the only OTC drug accepted by the FDA to abridge the healing time and extent of indications [7]. Extensive literature survey reveals that there is no significant method is reported for analytical method development and validation of Docosanol, hence our ultimate focus is to flourish a modest, accurate and precise method for routine analysis of Docosanol and validation for the same.
The structural formula of Docosanol possesses no chromophore and hence it does not absorb any radiation in the range of UV spectrum and it cannot be analyzed through UV and PDA detector which are generally used in most of HPLC systems. For the sake of visualization through UV or PDA detector, a structural modification is mandatory so as to have some kinda group of atoms that can respond to UV light. In current research, the drug Docosanol is first converted into a chemical derivative which possesses a chromophore that can respond to UV radiation. The chemical derivatization is accomplished by reacting Docosanol with phthalic anhydride under microwave assisted reaction following the ideologies of green chemistry. Then the derivative Monodocosyl Phthalate (MDP) (Figure 2) is used for making stock solution and further dilutions to perform all the parameters for analytical method development and method validation. The synthesized derivative is confirmed on the basis of its physicochemical parameters and spectral data. The focus of the experimentation is to develop simple, accurate and precise UV-AUC, RP-HPLC method for the estimation of Docosanol in bulk material and pharmaceuticals. Further, developed approaches were validated conferring to the ICH guidelines, Q2 (R1) [8].
Experimental
Drug and reagents
Docosanol was gifted form Macleod Pharmaceuticals, Mumbai. Phthalic anhydride, n-Hexane (AR Grade), Methanol (HPLC Grade), Chloroform (AR Grade), Ammonia (NH3), were purchased from Merck Ltd., India. Double distilled water was consumed all over the analysis.
Equipment and experimental conditions
Infrared spectroscopy with KBr pellets was performed on a IR prestige-21 FTIR-8400S spectrophotometer (Shimadzu corporation, Japan), in the range of wavenumber 4000-400 cm−1. 1H and 13C NMR spectra were recorded in deuterated chloroform on a Bruker AVANCE-400 spectrometer with tetramethylsilane (TMS) as internal reference. Spectrophotometric analysis was performed on a double beam UV/Vis- Spectrophotometer (UV-2450, Shimadzu, Japan) coupled to computer, bearing spectra manager software UV Probe 2.21 with 1 cm quartz cells. The experimental conditions for spectrophotometric method are given in Table 1. RP-HPLC analysis was performed with an aid of UFLC-LC 20 AD (Shimadzu Corporation, Japan) bearing of LC-20 AD binary solvent delivery system (pumps), SPD-M20A diode array detector and CTO-10 AS vp; column oven, a rheodyne injector with 20 μl loop and a Hamilton syringe (100 μl). Separations for the sake of quantification were achieved on a LC- BDS HYPERSIL C18 column (100 mmx4.6 mm, 3 μl). Data compilation and assessments for final conclusion were performed with LC-solution (Shimadzu Corporation, Japan). The experimental conditions for HPLC method are given in Table 2. All weighing operations for the present analysis were done consuming SHIMADZU AUX-120 analytical balance to gain great sensitivity. Ultrasonication of samples for rendering the liquids free from dissolved gasses were held on Ultrasonicator, ENERTECH Electronics Pvt. Ltd., India.
| HPLC system | UFLC- LC 20 AD (Shimadzu Corporation, Japan) |
|---|---|
| Detector | SPIV M 20 A (Diode array detector) |
| Column | LC-Hypersil BDS C18 |
| Dimensions | (100 mm x 4.6 mm, 3 µm) |
| Mobile-phase | Methanol: (0.01% v/v) Ammonia, pH=7.5, (70:30 v/v) |
| Mode | Binary gradient |
| Flow rate | 0.8 mL/min |
| Temperature | Ambient temperature |
| Detection wavelength | 243 nm |
| Injection volume | 20 mL |
Table 1: Experimental conditions for HPLC method
| Instrument | UV 2450 (Shimadzu Corporation, Japan) |
|---|---|
| Solvent | Chloroform |
| Max. wavelength | 243 nm |
| Wavelength range for AUC | 240-245 nm |
Table 2: Experimental conditions for UV/Vis-Spectroscopic method
Preparation of in-house cream formulation
As the cream formulation was not available in Indian market; cream containing 10% of synthetic derivative of Docosanol (Monodocosyl Phthalate MDP) was prepared in-house, employing benzyl alcohol as preservative, light mineral oil, propylene glycol, and magnesium stearate and purified water as cream base. Prepared cream was used as pharmaceutical formulation for further analysis.
General procedure for synthesis of Monodocosyl Phthalate
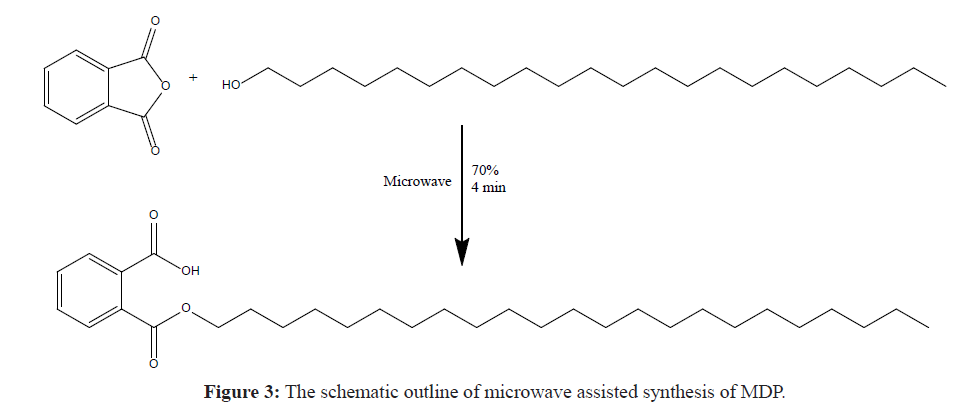
The Monodocosyl Phthalate was synthesised by the conventional method as per the procedure reported by Yan et al. [9], but this method is very time consuming because it requires 15 hours’ reflux. To overcome this problem, a novel green chemistry approach is designed by means of microwave assisted synthesis. The schematic outline for the microwave assisted reaction is given in Figure 3.
Chemical derivatization by microwave assisted synthesis
Ortho phthalic anhydride (2.27 g) was mixed with equimolar amount of Docosanol (5 g) and ground well to a fine homogeneous powder and transferred to a cleaned Erlenmeyer flask. Then the blend was reacted with an aid of microwave at 70% power for 4 minutes. The solid product obtained is then extracted with n-hexane and filtered through Whatman™ 1001-320 Grade 1 Qualitative Filter Paper (Pore Size: 11 μm) and the organic layer is distilled off to get crystals of Monodocosyl Phthalate (MDP). The reaction is censored by TLC and the structure of the product is confirmed on the basis of its spectral data.
Preparation of stock standard and study of calibration curve
Stock solution of MDP was prepared with a concentration of 100 μg/mL in chloroform. Determination of linearity involved analysis of six working solutions having concentrations 10 μ/mL, 20 μ/mL, 30 μ/mL, 40 μ/mL, 50 μ/mL and 60 μ/mL for UV/Vis-Spectrophotometry and 2 μ/mL, 4 μ/mL, 6 μ/mL, 8 μ/mL, 10 μ/mL and 12 μ/mL for RP-HPLC respectively; obtained by serial dilution of stock standard solution with chloroform. Resulted peak areas and concentrations were subjected to regression analysis to establish a relationship as calibration curve.
Preparation of sample solution
The sample solution was prepared from in-house cream formulation. The quantity of cream comparable to 10 mg Monodocosyl Phthalate was shifted into 100 mL volumetric flask containing 25 mL of chloroform, after ultrasonication for 20 min; volume was completed up to the mark to catch the strength of 100 mg/mL. The subsequent solution was filtered through a 0.45 μm filter (Millifilter, Milford, MA, USA). From filtrate, apt volumes of solution were transferred using micropipettes into 10 mL volumetric flasks and the volume was made up to the mark with chloroform to obtain the net strength of 10 mg/mL. Resulting solutions were subjected to proposed method for further analysis.
Chromatographic conditions
Spectrophotometric conditions
Method Validation
The optimized method was validated as to ensure it for linearity, accuracy, precision, LOD, LOQ and robustness as per recommendations of International Conference on Harmonisation (ICH) guidelines (International Conference on Harmonisation, 2005) [8].
Accuracy
Accuracy of the method was evaluated by confounding the drug standard in predetermined cream solution at concentration levels of 80%, 100% and 120% and determined as percent recovery studies.
Precision
The precision for an analytical method elucidates evidence on the random errors. It epitomizes the intimacy of agreement between a chain of measurements obtained from multiple sampling of the same homogenous sample under optimized conditions. It is alienated into repeatability (intra-day precision) and halfway precision (inter-day precision). Intra-day and inter-day precisions for present RP-HPLC protocol were ascertained by analysing, three different aliquots 4 μg/ mL, 6 μg/mL and 8 μg/mL; and 20 μg/mL, 30 μg/mL, 40 μg/mL for UV/Vis-Spectrophotometry, using three repetitive measurements at each target concentration level.
Limit of detection (LOD) and limit of quantification (LOQ)
The determination of LOD and LOQ was constructed on the average standard deviations of the responses and slopes of fabricated calibration curves (n=3) as described by ICH guidelines Q2 (RI). Hence sensitivity of the designed method was evaluated in terms of LOD and LOQ using formulae; LOD 3.3x ASD/S and LOQ 10x ASD/S; where, 'ASD' is the average standard deviation and 'S' is the slope of corresponding calibration curve. LOD and LOQ were estimated at lower range of calibration curve in between 2 μg/mL and 4 μg/mL at concentrations of 2 μg/mL, 2.5 μg/ mL, 3.0 μg/mL, 3.5 μg/mL, and 4.0 μg/mL; for HPLC and for UV/Vis-spectrophotometry it is calculated in the range of calibration curve in between 10 μg/mL and 20 μg/mL at a concentration of 10 μg/mL, 12 μg/mL,14 μg/mL, 16 μg/ mL,18 μg/mL, and 20 μg/mL.
Robustness
Robustness of the RP-HPLC method was verified by applying minor and deliberate vicissitudes in the experimental parameters, for example:
i. Column temperature: ±5°C
ii. Flow rate: ±0.2 mL/min
iii. Wavelength: ±2 nm
iv. Mobile phase composition, organic composition ±5%
Vicissitude was made to evaluate its consequence on the designed scheme. Obtained data for each case was evaluated by calculating % RSD.
Results and Discussion
Chemical derivatization by microwave assisted synthesis
The proposed structures of final compounds were confirmed by the data obtained from IR, 1H NMR, 13C NMR, Mass and elemental analysis.
IR (KBr, υmax in cm-1): 2916 (carboxylic acid OH stretch), 1724 (C=O of ester),1473(C=C aromatic),1605 (C-C of aromatic), 1473 (CH2 bend), 1473 (CH3 bend); 1H NMR (CDCl3, 400 MHz) δ ppm: 0.89 (s,3H, -CH3 of alkyl), 1.26- 1.29 (s, -CH2 of alkyl),4.42 (p, -CH2 of alkyl), 7.46 -7.81 (m, 4H, Ar-H), 13.7 (s, 1H, -OH); 13C NMR (100MHz CDCl3, ppm): 170,168, 167,132, 131,1130,129,128,77, 76, 66, 65, 63, 32,31,29,28,25, MS m/z: 475.8 (M+1).
Optimization of chromatographic conditions
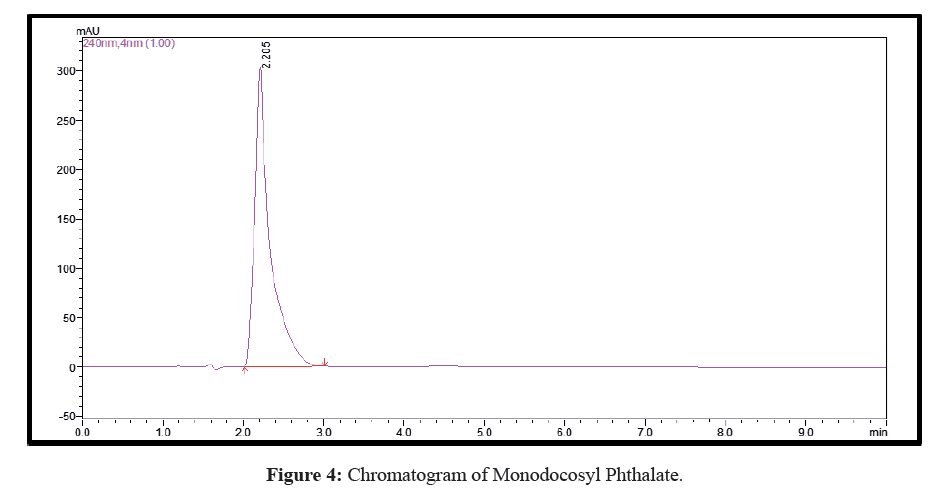
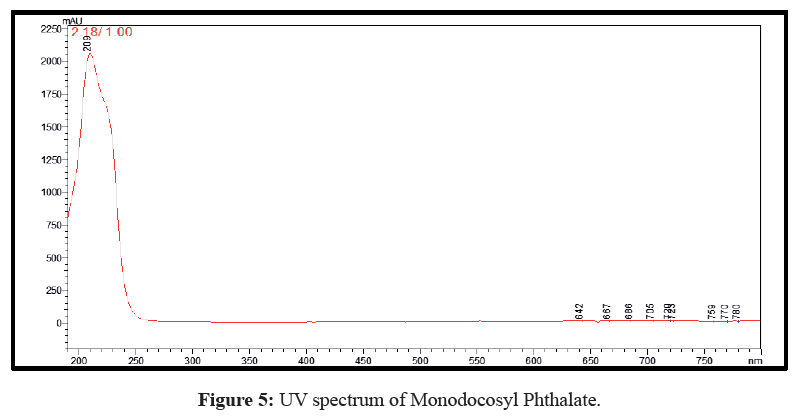
Plenty of eluents were tested with a view to achieve simple, rapid and economical separation between the synthetic derivative and unreacted materials. The optimal eluent blend was found to be methanol, 0.01% (v/v) ammonia solution, pH=7.5 (70:30 v/v) and the run time was 05 min. Both the mobile phase and sample aliquots were filtered through a 0.45 μm membrane filter and degassed for 15 min in ultrasonicator prior to analysis. Chromatographic studies were performed at ambient temperature. The optimized flow rate was 0.8 mL/min with an injection volume 20 μL followed by detection and quantification at wavelength of 243 nm. The chromatogram is shown in Figure 4 while the UV spectrum is shown in Figure 5.
Linearity study
Determination of linearity and establishment of calibration curve involved plotting graph between peak areas obtained versus concentrations for both UV-AUC and HPLC method. Linear relationship was obtained for the concentration range of 2-12 μg/mL with a slope of 672078; intercept 32668 and correlation coefficient 0.9987. The regression equation obtained during determination of linearity was, y=672078x-32668 for HPLC analysis. For the UV-AUC method, linear relationship was obtained for the concentration range of 10-60 μg/mL with a slope 0.0049, intercept 0.0088 and correlation coefficient 0.9989. The regression equation obtained during determination of linearity was, y=0.0049x+0.0088.
Method validation
Accuracy
Accuracy of the developed methods were evaluated in terms of percent recovery studies at three different levels 80%, 100% and 120%; percentage of drug recovered, when known amount of standard drug was added to pre-analysed samples and subjected to proposed HPLC method was 99.17% (% RSD) 0.20), 98.83% (% RSD) 0.63) and 99.15% (% RSD) 0.09), respectively with mean percent recovery of 99.05%, and for UV/Vis-Spectrophotometric method it was found to be 100.72% (% RSD) 0.45), 99.80% (% RSD) 0.98) and 100.59% (% RSD) 0.18), respectively with a mean recovery of 100.37%.
Precision
Intra-day and inter-day precisions were professed consuming six alike quantities in mark concentration level. The precision of designed scheme was evaluated in terms of % RSD. Results for the intra-day and inter-day precision studies for RP-HPLC are configured in Table 3 while for UV/Vis-Spectrophotometric method it is given in Table 4.
| Concentration (µg/mL) | Amount found in µg mL [n=9] ± SD | RSD (%) | |
|---|---|---|---|
| Intra-day precision | 4 | 3.9960 ± 5253.6 | 0.198 |
| 6 | 5.9697 ± 7880.5 | 0.198 | |
| 8 | 7.9434 ± 10507.3 | 0.198 | |
| Inter-day precision | 4 | 3.9892 ± 13630.3 | 0.5146 |
| 6 | 5.9768 ± 20445.5 | 0.5131 | |
| 8 | 7.9299 ± 27260.6 | 0.5146 |
Table 3: Results from precision for HPLC method
| Concentration (µg/mL) | Amount found in µg mL [n=9] ± SD | RSD (%) | |
|---|---|---|---|
| Intra-day precision | 20 | 19.8627 ± 0.089 | 0.45 |
| 30 | 30.0587 ± 0.155 | 0.4 | |
| 40 | 40.0979 ± 0.148 | 0.22 | |
| Inter-day precision | 20 | 19.9607 ± 0.089 | 0.45 |
| 30 | 30.0587 ± 0.122 | 0.4 | |
| 40 | 39.6907 ± 0.089 | 0.22 |
Table 4: Results from precision for UV/Vi-Spectrophotometric method
Limit of detection (LOD) and limit of quantification (LOQ)
The LOD and LOQ was originated from the standard deviations of the responses and slopes of constructed calibration curves (n=3) as described by ICH guidelines Q2 (RI). The LOD and LOQ values found were 0.077834 μg and 0.23586 μg, respectively for HPLC and 0.0833 μg and 0.2524 μg respectively for UV/Vis-spectrophotometric method.
Robustness
Robustness for the current designed scheme was tested by evaluating the influence of minor modifications in chromatographic conditions on system suitability parameters, as stated in section 3.6. The results of robustness testing for designed scheme display that a minor change of method conditions, such as the composition of the mobile phase, temperature, flow rate, and wavelength, is robust within the acceptable limits. The results are tabulated in Table 5. In all modifications, pretty good separation of MDP was achieved, and it was observed that the percent of recovery was within acceptable limits and the % RSD is within limit of not more than 2.0%. The tailing factors and extent of theoretical plates for the peak obtained fall within acceptable limits as well.
| Parameters | Conditions | %RSD of standard peak area |
|---|---|---|
| Column temperature | 20oC 25oC (Normal) 30oC |
1.46 1.52 1.55 |
| Wavelength | 241 nm 243nm (Normal) 245 nm |
1.46 1.51 1.55 |
| Mobile phase composition | -5% Methanol Normal +5% Methanol |
1.46 1.51 1.55 |
| Flow rate | 0.6 mL/min 0.8 mL/min (Normal) 1 mL/min |
1.47 1.51 1.55 |
Table 5: Results from robustness for HPLC method
Assay of in-house Monodocosyl Phthalate cream formulation
Assay of in-house Monodocosyl Phthalate cream formulation containing 10% of Monodocosyl Phthalate along with excipients was performed at a concentration of 6 μg/mL for RP-HPLC method and 40 μg/mL for UV-AUC method. Percent drug content for Monodocosyl Phthalate in in-house cream formulation was found to be 99.94%+0.54 and 99.96%+0.56 for HPLC and UV-AUC method respectively.
Conclusion
A simple and rapid RP-HPLC method and UV/Vis-Spectrophotometric method including AUC were developed and validated successfully for the analysis of Docosanol in bulk and in in-house cream formulation. The method is accomplished by chemical derivatization of Docosanol by microwave assisted synthesis following the principles of green chemistry. The main advantage of microwave assisted reaction is shorter time requirement for derivatization with a pretty good yield of the product.
The main silent feature of the method is the use of simplest mobile phase, optimum flow rate, low system pressure, and lower column length with good resolution of analyte in short run time.
Acknowledgments
Authors are thankful to Dr. S.J. Surana, Principal, R. C. Patel Institute of Pharmaceutical Education and Research, Shirpur-425405 (M.S.), India for providing necessary facilities to carry out the research work and Dr. S. B. Ganorkar for his valuable suggestions throughout the research work and Dr. H.S. Mahajan during formulation of in-house cream formulation of Docosanol (Monodocosyl Phthalate).
References
- Katz DH, Marcelletti JF, Khalil MH, Pope LE, Katz LR (1991). Antiviral activity of 1-docosanol, an inhibitor of lipid-enveloped viruses including herpes simplex. Proc Natl Acad Sci 88: 10825-10829.
- Shugar D (1972) Virus-cell interactions and viral antimetabolites. Proceedings of the Seventh Meeting of Federation of European Biochemical Societies, Varna, Bulgaria, September 1971. In Virus-cell interactions and viral antimetabolites. Proceedings of the Seventh Meeting of Federation of European Biochemical Societies, Varna, Bulgaria.
- Carter, W.A. (2018). Selective inhibitors of viral functions: 0. CRC Press.
- Abel R, Kaufman HE, Sugar J (1975). Intravenous adenine arabinoside against herpes simplex keratouveitis in humans. American Journal of Ophthalmology 79: 659-664
- Snipes W, Person S, Keller G, Taylor W, Keith A (1977) Inactivation of lipid-containing viruses by long-chain alcohols. Antimicrob Agents Chemother 11: 98-104.
- ncit.nci.nih.gov/ncitbrowser/ConceptReport.jsp?dictionary=NCI_Thesaurus&ns=NCI_Thesaurus&code=C47498
- www.centerwatch.com/drug-information/fda-approved-drugs/drug/627/abreva-docosanol
- Guideline IH (2005). Validation of analytical procedures: Text and methodology Q2 (R1). In International conference on harmonization, Geneva, Switzerland pp: 11-12.
- Yan B, Xu B (2005). Spectroscopic study on the photo physical properties of lanthanide complexes with long chain mono-docosyl phthalate. J Fluoresc 15: 619-626.

Open Access Journals
- Aquaculture & Veterinary Science
- Chemistry & Chemical Sciences
- Clinical Sciences
- Engineering
- General Science
- Genetics & Molecular Biology
- Health Care & Nursing
- Immunology & Microbiology
- Materials Science
- Mathematics & Physics
- Medical Sciences
- Neurology & Psychiatry
- Oncology & Cancer Science
- Pharmaceutical Sciences


