Analysis of Chlamydia trachomatis L2 Inclusion Membrane Proteins on the Background of the Host Cell Proteome
Svend Birkelund1, Lau Sennels2, Gunna Christiansen3* and Allan Stensballe1
1Department of Health Science and Technology, Aalborg University, Aalborg V., Denmark
2ProteoScale, Incuba Science Park, Aarhus C, Denmark
3Department of Biomedicine, Aarhus University, Aarhus C, Denmark
- *Corresponding Author:
- Gunna Christiansen
Department of Biomedicine
Aarhus University, Aarhus C, Denmark
Tel: +45 8715 0000
E-mail: gunna@loke.dk
Received Date: October 24, 2017 Accepted Date: October 27, 2017 Published Date: November 12, 2017
Citation: Birkelund S, Sennels L, Christiansen G, Stensballe A. Analysis of Chlamydia trachomatis L2 Inclusion Membrane Proteins on the Background of the Host Cell Proteome. J Biomed Sci App 2017, Vol.1 No.1:5.
Copyright: ©2017 Birkelund S, et al. This is an open-access article distributed under the terms of the Creative Commons Attribution License, which permits unrestricted use, distribution, and reproduction in any medium, provided the original author and source are credited.
Abstract
The obligate intracellular bacterial pathogen, Chlamydia trachomatis, is the leading cause of sexually transmitted infections. Due to its obligate intracellular life, it has been difficult to unravel the molecular mechanisms involved in its biphasic developmental cycle and the establishment of the intracellular inclusion in which multiplication of chlamydiae is taking place. Using ultra high pressure liquid chromatography and tandem mass spectrometry of trypsin-cleaved proteins from whole cell lysates of C. trachomatis L2 infected HeLa cells; we determined and quantified the protein content. We unambiguously identified a total of 57,147 HeLa cell peptides, representing 5956 proteins, and 3807 chlamydial peptides representing 526 proteins, or 59% of the open reading frames in C. trachomatis L2 genome.
We also searched for known secreted inclusion membrane proteins (Inc). A total of 19 Inc proteins were identified and 14 of these could be quantified having an altered expression level when samples from 20 and 43 hours post infection were compared. IncG, CT288, CT223, IncE, CT147 and CT728 were the most up-regulated Inc proteins illustrating the usefulness of this method. Furthermore, CT642 and CT846 were detected.
Keywords
Inclusion membrane protein; Inc; Chlamydia trachomatis; Proteomics
Introduction
Chlamydia trachomatis is a human pathogen causing sexual transmitted diseases and trachoma. C. trachomatis serovars L1-L3 cause lymphogranuloma venereum, an invasive form that results in lymphadenitis of regional lymph nodes. C. trachomatis serovars A-K only grows within epithelial cells, serovars A-C cause trachoma and serovars D-K are sexual transmitted infections. C. trachomatis is an obligate intracellular bacterium with a unique biphasic developmental cycle, in which the elementary body (EB) (300 nm) induces its own uptake by the host cell into a phagosome. Chlamydia prevent the fusion of the phagosome with lysosomes [1]. EB transform to reticulate bodies (RB) (1000 nm) and an inclusion is formed inside the host cell cytoplasm. RB divides and after 24-48 hours transform to EB, the cell bursts and the EB can infect new cells. Both EB and RB secrete effector proteins across the inclusion membrane by the type III secretion system (T3S) whereby proteins can be translocated from the chlamydial cytoplasm to the host cell cytoplasm. The chlamydial inclusion membrane is modified by chlamydial inclusion membrane proteins (Inc), which are secreted via T3S, and they subsequently interact with the inclusion membrane from the cytoplasmic side [2-4]. By searching the C. trachomatis L2 genome for Inc proteins having a characteristic hydrophobic bilobic domain of at least 50 amino acids with a strong hydrophobicity index, Bannantine et al. [5] identified 46 candidate Inc proteins. When predicted proteins in C. trachomatis serovar D genome were inspected for presence of the bilobic hydrophobic signature 59 proteins were found [6,7], and all Inc genes are transcribed [8]. The predicted Inc proteins can be divided into 3 types; type I where the hydrophobic stretch is in the N-terminal end; type II with the hydrophobic stretch is in the C-terminal part; and type III where two or more hydrophobic stretches are present. Type I is the most common type. Proteins with this motif are rarely found outside the order Chlamydiales [9] and Inc proteins encoded from a specific genome do not share primary protein sequence similarities.
The high number of Inc proteins of which at least 21 have been shown to be present in the inclusion membrane [3] suggests that they play a central role in the unique biology of the chlamydial inclusion formation. However, identification of expressed Inc proteins is difficult due to their type III secretion into the inclusion membrane. By combining ultrahigh pressure liquid chromatography (UHPLC) and a mass spectrometer with a dynamic range of 105 and sub-ppm mass-accuracy, Wiśniewski et al., [10] identified 7,093 HeLa cell proteins using LC coupled with tandem mass spectrometry (MS/MS). On the background of this number of HeLa cell proteins we speculated whether we would be able to identify additional Inc proteins by analyzing the entire protein content of infected host cells by LC-MS/MS. We therefore characterized expression of Inc proteins in C. trachomatis L2 infected HeLa cells 24 and 43 hours post infection (hpi). Using this strategy we identified expression but not localization of 19 Inc proteins of which six previously were described as hypothetical [3].
Materials and Methods
Cell cultivation and infection
HeLa 229 cells and C. trachomatis L2/434/Bu were obtained from American type culture collection (Rockville, MD, USA). Semiconfluent monolayers of HeLa cells (75 cm2) cultivated without cycloheximide at 37°C and 5% CO2 were infected with C. trachomatis L2, for 30 minutes with the infectious dose of one inclusion forming unit (IFU)/cell and then incubated for either 23 hrs and 30 min or 42 hrs and 30 minutes in RPMI-1640 medium containing 10% FCS and 1 μg/ml gentamicin [11]. Uninfected HeLa cells were cultivated similarly as controls. Medium was also changed on uninfected HeLa cells.
Sample preparation and trypsin digestion
Cell monolayers were washed 3 times in PBS, and the cells were solubilized in 5% sodium deoxycholate (SDC), 50 mM triethylammonium bicarbonate (TEAB) and phosphatase inhibitors. The samples were heated to 90°C for 5 minutes. The protein content of the samples was estimated, by SDS-PAGE, and 100 μg sample was prepared for MS. For sample preparation an optimized filter-aided sample preparation was used [12,13]. Ten kDa spinfilters (YM10; Millipore, Sigma- Aldrich, St. Louis, MO, USA) was used for buffer exchange and reaction vessel. The samples were reduced with 12 mM Tris(2- carboxyethyl)phosphine hydrochloride, alkylated with 40 mM iodoacetamide and digested with 0.4 μg sequencing grade modified trypsin (Promega, Fitchburg, Wisconsin, USA). All reactions were performed in 0.5% SDC and 50 mM TEAB. After digestion, formic acid was added to 0.5% and SDC was removed with ethyl acetate extraction. Samples were dried down and re-suspended in 2% acetonitrile and 1% formic acid.
Mass Spectrometry (MS)
MS was performed according to Bennike et al., [14]. The protein solution was analyzed on an automated LCelectrospray ionization (ESI) MS/MS system using an Ultimate 3000 UPLC system with a nanopump module. The system was coupled with an emitter for nanospray ionization to a Thermo- Electron QExactive mass spectrometer (Thermo Scientific, Waltham, USA). Triplicate runs of 10 μg of each sample was loaded onto the C18 reversed phase column (Dionex; Acclaim PepMap100 C18, 5 μm precolumn and 50 cm Acclaim Pepmap RSLC, 75 μm ID main column, Thermo Scientific) and eluted with a linear gradient of 96% solvent A (1% formic acid) and 4% solvent B (acetonitrile) [14], increasing solvent B to 35% on a 240 min ramp gradient. The MS was used in a data dependent mode, selecting the 12 precursor-ions with the highest intensity for higher energy collisional dissociation (HCD) fragmentation. Resulting raw files were used for protein identification and label free protein quantification using Thermo Proteome Discoverer v.1.4.0.288, Progenesis QI for Proteomics v.2.0.5387 (Waters Inc. Milford, MA, USA) and MaxQuant LFQ v.1.5.0.25 [15]. The resulting spectra were searched against the Uniprot Homo sapiens reference proteome with isoforms (92348 sequences) and the C. trachomatis L2 protein (888 sequences) database. Furthermore, Mascot (Matrix Science, v. 2.3.02) search against a C. trachomatis L2 Uniprot database was used. Database search parameters includes in silico cleaved with trypsin, carmamidomethyl (C) as fixed modification and oxidation (M) as variable modificaiton. The mass accuracy was 2-10 ppm depending on the search algorithm. The label free quantification (LFQ) algorithm was activated in MaxQuant and processed in Peresus 1.5.0.15. Standard settings include a peptide and protein false discovery rate of 1% as well as at least two peptides for protein quantification. Reversed sequences as decoys and contaminant sequences have been added automatically by MaxQuant. Quantitative values were the averages of MaxQuant LFQ values from at least 2 values per condition. P-values were calculated by a two-tailed, heteroscedastic t-test at FDR 0.05 and S0=1. PCA included triplicate technical replicates and imputation of missing values from normal distribution.
Genes and gene coverrage by tandem mass spectra were visualized using the VESPA program [16].
The mass spectrometry proteomics data have been deposited to the ProteomeXchange Consortium via the PRIDE partner repository with the dataset identificer PXD001457 [17].
Immunofluorescence microscopy
HeLa cells, cultivated on cover slips, were infected with C. trachomatis L2 (0.5 IFU/cell). To one cover slip cycloheximide (1 μg/ml) was added to the medium, while the other cover slip was cultivated without. After 43 hours post infection (hpi) the cells were fixed with formaldehyde and permeabilized with 0.2% Triton-X100. The infected cells were incubated with the primary antibody specific for MOMP (MAb32.3) followed by incubation with FITC-conjugated goat –anti-rabbit secondary antibody (Jackson ImmunoResearch Laboratories, West Grove, PA, USA) and 1 μg/ml ToPro-3 [18]. Images were obtained using a Leica SP5 confocal microscope equipped with a HC PL APO 100x/1.47 objective (Leica Microsystems. Wetzlar, Germany).
Results
Cultivation of C. trachomatis L2 in HeLa cells
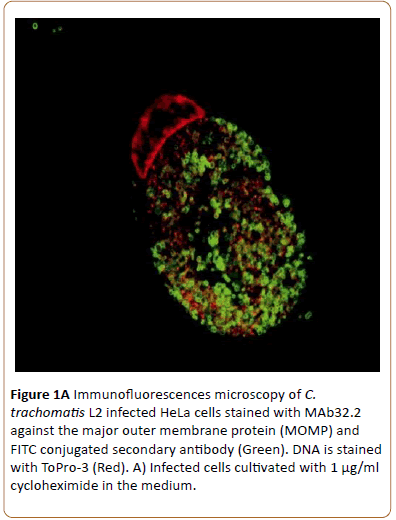
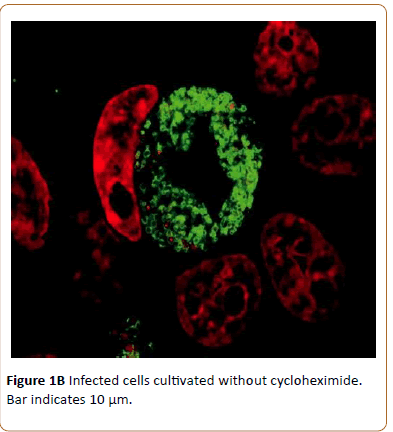
Monolayers of semi-confluent HeLa cells were infected with C. trachomatis L2 and cultivated with or without addition of cycloheximide that otherwise would have influenced the HeLa cell protein synthesis and its response to the C. trachomatis infection. The chlamydial growth was visualized by laser confocal microscopy. Inclusions seen after 43 hpi were not noticeably different whether (A) or not (B) cycloheximide had been added to the medium during growth as indicated by the presence of large inclusions (Figure 1A).
Figure 1a: Immunofluorescences microscopy of C. trachomatis L2 infected HeLa cells stained with MAb32.2 against the major outer membrane protein (MOMP) and FITC conjugated secondary antibody (Green). DNA is stained with ToPro-3 (Red). A) Infected cells cultivated with 1 μg/ml cycloheximide in the medium.
This indicates good chlamydial growth as well as HeLa cell growth as indicated by increasing number of nuclei of uninfected cells (Figure 1B).
Figure 1b: Infected cells cultivated without cycloheximide. Bar indicates 10 μm.
When cultivated without cycloheximide and thus it is possible to analyze expression of both chlamydial and HeLa cell proteins.
Identification of proteins by UPLC-MS/MS of HeLa cells infected with C. trachomatis L2
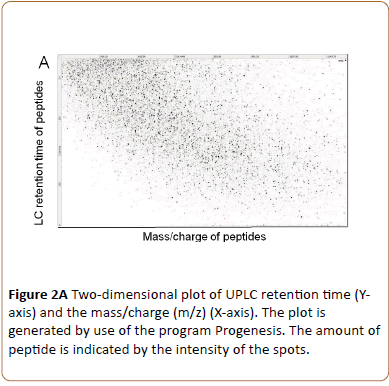
Triplicate technical replicates of four biological samples consisting of uninfected HeLa cell peptides (24 and 43 hrs) and HeLa cell monolayers infected with C. trachomatis L2 and cultivated without cycloheximide for 24 and 43 hpi were lysed in NaDOC and heated to 90°C for inactivation of enzyme activity. After trypsin digestion the peptides were separated and sequenced using UPLC-MS/MS. During this procedure four characteristic measurements were obtained for each peptide: the retention time; the accurate precursor ion mass; its ion intensity; and a list of the generated fragments [19]. By reversed-phase using UPLC the peptides are separated according to their hydrophobicity at pH 1. When peptides elute from the column the peptides are ionized by nanoelectrospray and the mass-to-charge ratio of the peptide (precursor ion) is determined (MS1), followed by fragmentation by collision and mass analysis of the resulting fragments (MS2). Plotting m/z (MS1) of each peptide against their retention time an excellent separation of peptides was obtained as exemplified by the 43 hpi C. trachomatis L2 infected HeLa cell sample (Figure 2A).
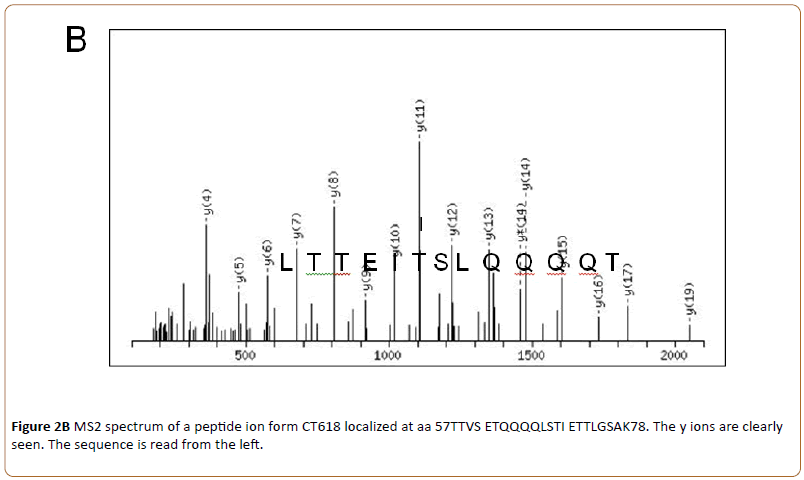
By higher energy collision-induced dissociation (HCD, MS2) the fragmentation pattern was obtained and data obtained by MS1 and MS2 were analyzed by MaxQuant. An example is shown in (Figure 2B).
Where the sequence (13 amino acids) obtained by HCD of one of the identified CT288 peptides is shown.
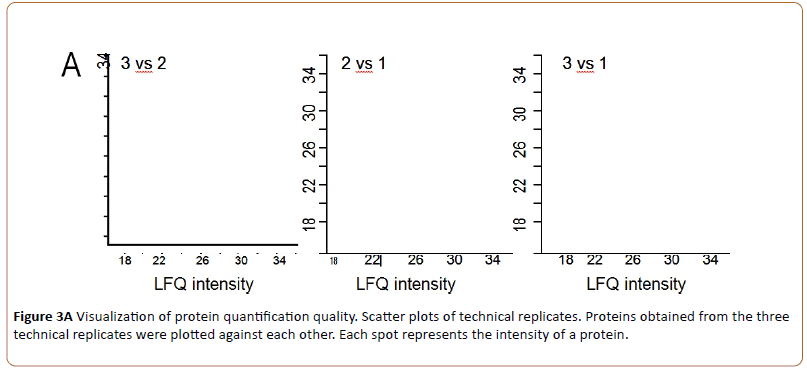
The 24 hrs MS2 spectra of uninfected HeLa cell peptides were used to search the HeLa cell proteome database to uniquely identify the proteins. Combining the extracted ion chromatogram (XIC) of MS1 and MS2 spectra a label free relative quantification of each protein was obtained. Validation of the LC-MS/MS results was done by plotting the intensities of proteins from each of the technical replicates against each other (scatterplot, MaxQuant, Figure 3A).
As seen three plots are similar, and the higher the intensity of the proteins the more precise is the localization to a 45- degree theoretical line.
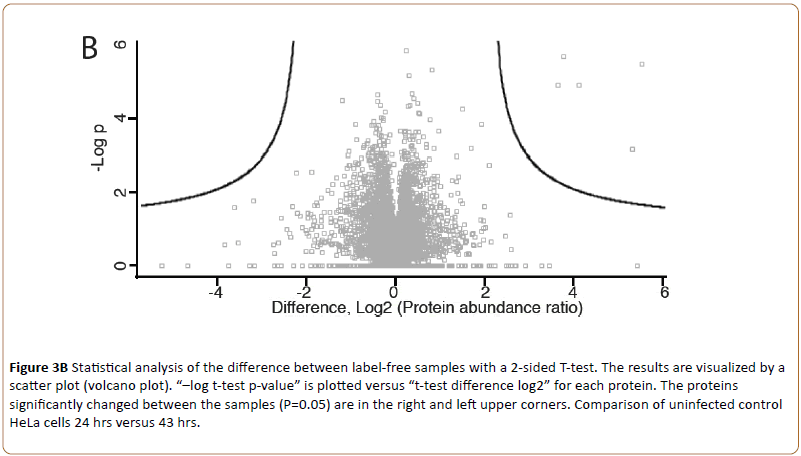
Triplicate technical replicates of two biological samples of uninfected HeLa cell peptides (24 and 43 hrs) visualized by the volcano plot (MaxQuant, Figure 3B).
Figure 3b: Statistical analysis of the difference between label-free samples with a 2-sided T-test. The results are visualized by a scatter plot (volcano plot). “–log t-test p-value” is plotted versus “t-test difference log2” for each protein. The proteins significantly changed between the samples (P=0.05) are in the right and left upper corners. Comparison of uninfected control HeLa cells 24 hrs versus 43 hrs.
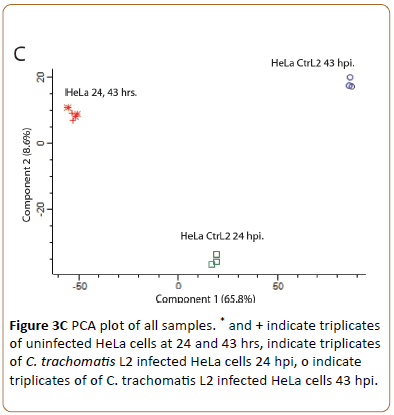
Showed the intensity of identified proteins. Only few outliers (upper left) indicated presence of contaminating keratin. To visualize the repeatability of all sample sets Principal Component Analysis (PCA) was used (Figure 3C).
The loadings plot of the unsupervised feature selection for PCA computed in Peresus (MaxQuant) represents the relationship between the original MS fragment based protein ID variables and the relationships between all variables in the space of the first two simple components. The technical triplicates of the control HeLa cells at 24 hpi and 43 hpi have similar heavy loadings for principal component 1 and 2 (* and +) but differ from for loadings of infection at time points 24 hpi and 43 hpi (o). We conclude that the technically repeatability is very high and the HeLa controls differ from each time point of infection.
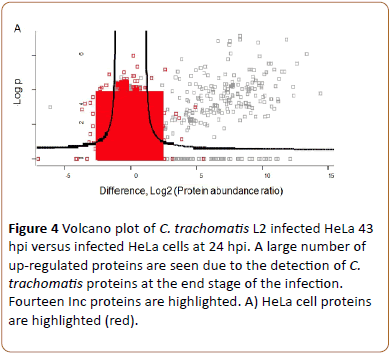
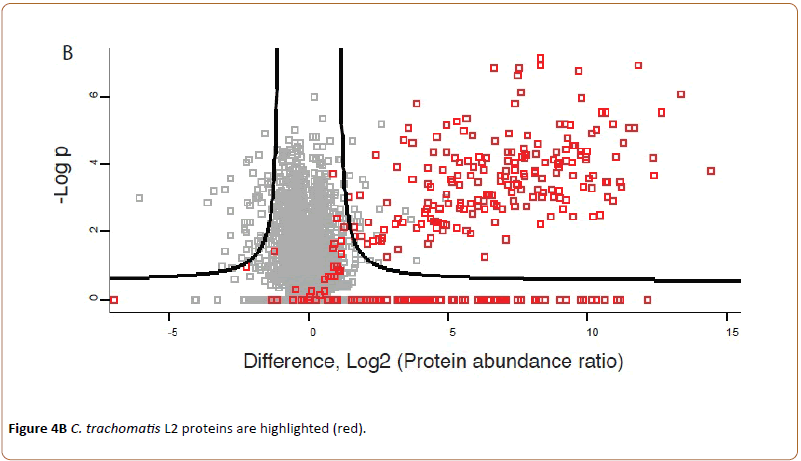
When HeLa cell monolayers infected with C. trachomatis L2 and cultivated without cycloheximide for 24 and 43 hpi were processed and analyzed similar to the un-infected cells, both chlamydial and HeLa cell proteins were present in the sample. The proteins were identified by database search of the MS/MS spectra. In total 57,147 peptides (representing 5956 HeLa cell proteins) and 3807 chlamydial peptides (representing 526 proteins, 59% of the predicted total proteome) were identified. Highlighting HeLa cell proteins it is seen that there are both up-regulated and down-regulated HeLa cell proteins (red, right and left, Figure 4A).
Figure 4a: Volcano plot of C. trachomatis L2 infected HeLa 43 hpi versus infected HeLa cells at 24 hpi. A large number of up-regulated proteins are seen due to the detection of C. trachomatis proteins at the end stage of the infection. Fourteen Inc proteins are highlighted. A) HeLa cell proteins are highlighted (red).
Highlighting C. trachomatis L2 proteins a new group of proteins became visible at the upper right corner of the volcano plot (Figure 4B).
Indicating that 203 chlamydial proteins are seen to be upregulated in the infected cells at 43 hpi compared to cells infected for 24 hpi.
The false discovery rate was set to 1% in MaxQuant. To analyze the specificity of the protein identification by MS/MS data from uninfected HeLa cells was searched against the chlamydial proteome database. Thereby four peptides from four different Chlamydia proteins were found and thus chlamydial and HeLa cell proteins could be uniquely separated.
Identification and genomic localization of Inc proteins
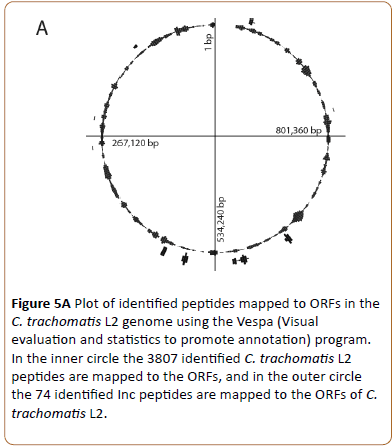
The 3807 identified chlamydial peptides were mapped to the translated chlamydial genome and positioned at the site of their genes (Figure 5A, inner circle, representing 526 chlamydial proteins).
Figure 5a: Plot of identified peptides mapped to ORFs in the C. trachomatis L2 genome using the Vespa (Visual evaluation and statistics to promote annotation) program. In the inner circle the 3807 identified C. trachomatis L2 peptides are mapped to the ORFs, and in the outer circle the 74 identified Inc peptides are mapped to the ORFs of C. trachomatis L2.
Based on the findings by Lutter et al. [6] we identified and mapped 19 of the 51 Inc proteins (Figure 5A, outer circle). Some of the Inc proteins are localized in clusters while others are localized as separate proteins.
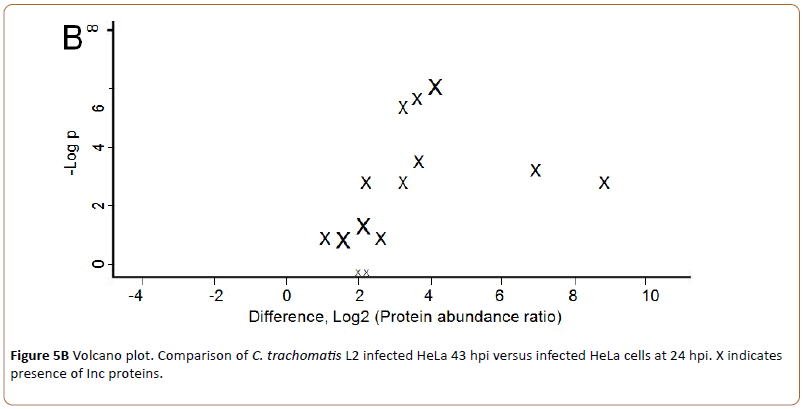
In Figure 5B “X” in the right part of the volcano plot indicates the fourteen quantifiable Inc proteins up-regulated 43 hpi. A list of the identified Inc proteins is shown in Table 1.
Figure 5b: Volcano plot. Comparison of C. trachomatis L2 infected HeLa 43 hpi versus infected HeLa cells at 24 hpi. X indicates presence of Inc proteins.
| C. trachomatis L2 Bu Accession number | C. trachomatis D homolog | Inc name | Intensity 43 hrs. | Size Da | Peptidesa | IMFb | Function |
|---|---|---|---|---|---|---|---|
| CTL0371 | CT116 | IncE | 186.010.000 | 13,594 | 1 (3) | [2,3,7] | Sort nexins (SNX1, 2, 5, 5)[30] |
| CTL0373 | CT118 | IncG | 445.673.333 | 17,540 | 3 (3) | [2,3] | 14-3-3[28] |
| CTL0374 | CT119 | IncA | 17.791.333 | 27,489 | 3 (14) | [2,3] | endocytic SNARE[24] |
| CTL0402 | CT147 | 151.793.333 | 162,274 | 14 (73) | [3,7,8] | ||
| CTL0466 | CT214 | 122.817.333 | 59,775 | 7 (20) | |||
| CTL0476 | CT223 | 284.840.000 | 29,591 | 5 (15) | [3,5,7] | endocytic SNARE[24] | |
| CTL0478 | CT226 | 18.601.000 | 18,263 | 1 (6) | [7,31] | ||
| CTL0480 | CT228 | 31.787.000 | 20,777 | 5 (10) | [3] | ||
| CTL0481 | CT229 | 18.933.333 | 23,534 | 2 (7) | [3,5,7,29] | Rab4[29] | |
| CTL0481 | CT233 | IncC | 10.336.333 | 18,512 | 1 (4) | [3,5,7] | |
| CTL0540 | CT288 | 462.793.333 | 63,512 | 13 (24) | [3,5,7] | ||
| CTL0619 | CT365 | 52.865.333 | 61,073 | 1 (17) | |||
| CTL0709 | CT449 | Not quantifiable | 12,114 | 1 (4) | [7] b | ||
|
CTL0880 |
CT616 |
|
13.569.667 |
49,922 |
1 (24) |
|
|
|
CTL0882 |
CT618 |
|
281.433.333 |
27,913 |
6 (10) |
[5] |
|
|
CTL0010 |
CT642 |
|
11.875.667 |
32,122 |
3 (12) |
|
|
|
CTL0097 |
CT728 |
|
147.273.333 |
27,919 |
3 (11) |
|
|
|
CTL0184 |
CT813 |
|
Not quantifiable |
29,429 |
1 (14) |
[5,26] |
endocytic SNARE[24] |
|
CTL0218 |
CT846 |
|
4.423.000 |
26,890 |
1 (9) |
|
|
Table 1: Data on identified Inc proteins. Intensity: normalized values for LFQ intensity; a) Number of possible tryptic peptides with a size of 750-3000 Da present in the protein, in brackets number of different peptides with MS2. b) Localization of the Inc protein to the inclusion membrane determined by antibodies and IMF
The experimentally obtained number of different MS2 Inc peptides are listed and compared to the theoretical number of tryptic peptides (brackets). The Inc proteins unambigously identified in our study by proteomics of chlamydial infected HeLa cells are: CT116, CT118 and CT119 (IncE, IncG and IncA, respectively), CT147, CT223, CT226, CT228, CT229, CT233 (IncC), CT288, CT618, and CT813, all of which were shown by Li et al. (2008) to be present in the inclusion membrane. We also identified CT365, CT449, CT214, CT728 which by Li et al., [3] were characterized as “undefined” or undetected, because antibodies generated to each of these proteins by immunofluorescence staining did not bind to chlamydial infected cell cultures; and CT616 which was identified by proteomics of purified EB and RB [20].
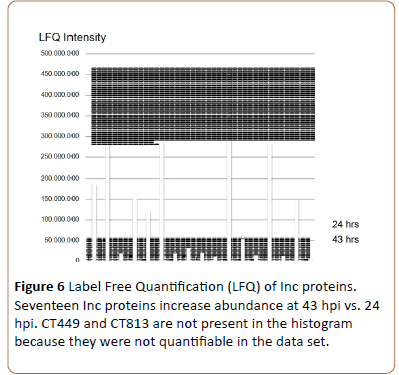
By label-free quantification (LFQ) of the detected Inc proteins in the 24 and 43 hpi cultures (MaxQuant, [15]) it is seen that CT642, CT846 (this study) and CT616 [20] are expressed with low abundance and can only be observed at 43 hpi. CT449 and CT813 were detected but could not be quantified. The previously undefined Inc proteins CT365, CT449, CT214 and CT728 [3] are variously expressed (Figure 6) While most of the known Inc proteins are expressed to a higher degree at 43 hpi. Of the highly expressed Inc proteins, IncG and CT288 show the highest intensities. The higher abundance of Inc proteins at 43 hpi compared to 24 hpi indicates the growth of the chlamydiae, however, comparison of the intensity of the different Inc proteins is not absolute.
Discussion
In the present study the use of shotgun proteomics on unfractionated C. trachomatis L2 infected HeLa cells to resolve and detect the presence of a specific group of chlamydial proteins within a complex mixture of the human proteome was proven to be feasible. The use of UHPLC-MS/MS showed a high sensitivity and specificity in determination of more than 60,000 trypsin-cleaved peptides. Interestingly, searching the eukaryotic peptides identified from the sample of uninfected HeLa cells against the chlamydial database showed that only four eukaryotic peptides theoretically could match chlamydial peptides, and thus there is virtually no overlap of the theoretical peptides in each proteome. Therefore, a massive background of eukaryotic peptides is not problematic for discriminating chlamydia-specific peptides. Advantages of this method compared to electrophoretic gel based proteomic strategies [11,21] are that smaller sample amounts (10 μg protein) is required; that no pre-analysis fractionation steps are involved; and that no chemical or metabolic labeling procedure is needed. Therefore, the risk of degradation or modification of proteins during sample preparation is minimized, and acquisition time is reduced significantly. Another advantage is that the LC-MS/MS method can identify peptides from proteins independent of their isoelectric point. Due to the high sensitivity and specificity of the identified proteins demonstrated in the present study this method has the potential to be used in further studies on chlamydial-host cell interactions. Drawbacks are that it is not possible to determine the localization of specific proteins within the cells.
We also demonstrate that it is possible to identify expressed Inc proteins on a background of both HeLa cell and chlamydial proteins. By infecting HeLa cells with C. trachomatis L2 for 43 hpi we could identify 5956 HeLa cell proteins and 526 chlamydial proteins. Chlamydial Inc proteins are defined as proteins with a bilobed hydrophobic domain of at least 50 amino acids. Some but not all of the Inc proteins have been shown to localize to the inclusion membrane. They are of interest because they are synthesized by chlamydiae and injected into the host cell cytosol by T3S and inserted into the inclusion membrane from the cytoplasmic side where they can interact with host cell proteins. They are involved in the change in cellular vesicle trafficking preventing fusion of chlamydial containing endosomes with lysosomes and at the same time in promoting fusion of the chlamydial containing endosomes by homotypic fusion, favoring inclusion formation [22]. Over 50 potential Inc genes are found in the C. trachomatis genome [3,5], and so far less than half of the gene products have been identified at the protein level even though all genes are transcribed [8].
We identified 19 Inc proteins; 13 were known to be expressed and six were previously described as hypothetical [3,7]. Similarly, Li et al. [3] identified by immunofluorescence microscopy several of the Inc proteins to be localized to the inclusion membrane using Inc-specific antibodies generated to each of the proteins. Some of the antibodies to Inc proteins uniformly stained the inclusion membrane while others showed intense staining at points of contact with RB, and still others were localized in discrete micro domains [4]. To determine the localization of Inc proteins Weber et al. [7] used a recombinant technique expressing the individual Inc proteins with a C-terminal tag for detection. Using this strategy they showed that CT449 was localized to the inclusion membrane. In the present study we confirmed its presence in C. trachomatis L2 infected HeLa cells. In the study by Li et al., [3] seven Inc proteins were found by immunofluorescence microscopy using specific antibodies to be located within the chlamydial inclusion. None of these proteins were identified by our proteomic approach even though they all were transcribed [8]. A reason for this may be that the Inc proteins found within the inclusion could be partially degraded, and thus would not be detected by LC-MS/MS.
The function of some Inc proteins has been determined. By immunofluorescence microscopy antibodies to C. trachomatis IncA, localized this protein to the inclusion membrane and a clinical isolate lacking IncA has been shown to form nonfusogenic inclusions [23]. IncA interacts with soluble Nethylmaleimide- sensitive factor (NSF) attachment protein receptors (SNARE), responsible for membrane fusion in eukaryotic cells. IncA is predicted to form multimeric structures and thereby facilitate inclusion formation, and expression of the C-terminal domain of IncA in eukaryotic cells showed formation of inclusion like structures [24]. IncA mimic the structure of SNAREs facilitating the interaction between SNAREs and IncA [24,25]. The SNARE-like motif is also present in the Inc proteins CT223 and CT813 [24], and both CT223 and CT813 are localized to the inclusion membrane [3,5,26] indicating that these proteins may contribute to SNARE recruitment [24].
Further, Derré et al., [27] showed that IncD is the specific binding partner for the ceramide transfer protein (CERT), which is recruited to the Chlamydia inclusion at its contact site with the endoplasmic reticulum. IncG that is phosphorylated in the eukaryote cell was shown to interact with 14-3-3β a phosphoserine-binding adaptor protein central in regulation of many signaling pathways [28]. Functions have also been assigned to CT229 and to IncE. CT229 was shown to interact with Rab4A and recruit it to the inclusion membrane, and thereby it may regulate the intracellular trafficking of the inclusion [29]. IncE was shown to interact with a subset of sorting nexins (SNX1, 2, 5 and 6)[30] which are of importance for inclusion morphology. The identified interactions between Inc proteins and host cell molecules demonstrate the important role of these proteins in establishing and supporting the intracellular growth of chlamydiae.
The use of shotgun proteomics on unfractionated C. trachomatis L2 infected HeLa cells facilitates detecting the presence and variation of HeLa cell proteins during the development of the chlamydial inclusion. Further exploring this approach may generate valuable information on the global chlamydial-host cell interactions.
Acknowledgements
This study was supported by The Lundbeck Foundation, The Obel Family Foundation, Fonden til Lægevidenskabens Fremme, Svend Andersen Fonden, The John & Birthe Meyer Foundation, Beckett-fonden, Danish Rheumatism Association and Herta Christensens fond. The Danish National Mass Spectrometry Platform for Functional Proteomics (PRO-MS) is acknowledged for grants to the analytical platform enabling parts of this study.
References
- Eissenberg LG, Wyrick PB, Davis CH, Rumpp JW (1983) Chlamydia psittaci elementary body envelopes: Ingestion and inhibition of phagolysosome fusion. Infect Immun 40: 741-751.
- Scidmore Carlson MA, Shaw EI, Dooley CA, Fischer ER, Hackstadt T (1999) Identification and characterization of a Chlamydia trachomatis early operon encoding four novel inclusion membrane proteins. Mol Microbiol 33: 753-765.
- Li Z, Chen C, Chen D, Wu Y, Zhong Y, et al. (2008) Characterization of fifty putative inclusion membrane proteins encoded in the Chlamydia trachomatis genome. Infect Immun 76: 2746-2757.
- Mital J, Miller NJ, Dorward DW, Dooley CA, Hackstadt T (2013) Role for Chlamydial Inclusion Membrane Proteins in Inclusion Membrane Structure and Biogenesis. PLoS One 8: e63426.
- Bannantine JP, Griffiths RS, Viratyosin W, Brown WJ, Rockey DD (2000) A secondary structure motif predictive of protein localization to the chlamydial inclusion membrane. Cell Microbiol 2: 35-47.
- Lutter EI, Martens C, Hackstadt T (2012) Evolution and conservation of predicted inclusion membrane proteins in chlamydiae. Comp Funct Genomics 2012: 362104.
- Weber MM, Bauler LD, Lam J, Hackstadt T (2015) Expression and localization of predicted inclusion membrane proteins in Chlamydia trachomatis. Infect. Immun 83: 4710-4718.
- Belland RJ, Zhong G, Crane DD, Hogan D, Sturdevant D, et al. (2003) Genomic transcriptional profiling of the developmental cycle of Chlamydia trachomatis. Proc Natl Acad Sci USA 100: 8478-8483.
- Toh H, Miura K, Shirai M, Hattori M (2003) In silico inference of inclusion membrane protein family in obligate intracellular parasites chlamydiae. DNA Res 10: 9-17.
- Wisniewski JR, Zougman A, Nagaraj N, Mann M, Wi JR (2009) Universal sample preparation method for proteome analysis. Nat Methods 6: 377-362.
- Shaw AC, Gevaert K, Demol H, Hoorelbeke B, Vandekerckhove J, et al. (2002) Comparative proteome analysis of Chlamydia trachomatis serovar A, D and L2. Proteomics 2: 164-186.
- Bennike TB, Barnaby O, Steen H, Stensballe A (2015) Characterization of the porcine synovial fluid proteome and a comparison to the plasma proteome. Data Br 5: 241-247.
- León IR, Schwämmle V, Jensen ON, Sprenger RR (2013) Quantitative Assessment of In-solution Digestion Efficiency Identifies Optimal Protocols for Unbiased Protein Analysis. Mol Cell Proteomics 12: 2992-3005.
- Bennike T, Lauridsen KB, Olesen MK, Andersen V, Birkelund S, et al. (2014) Optimizing the Identification of Citrullinated Peptides by Mass Spectrometry: Utilizing the Inability of Trypsin to Cleave after Citrullinated Amino Acids. J Proteomics Bioinform 6: 288-295.
- Cox J, Hein MY, Luber CA, Paron I, Nagaraj N (2014) Mann M. Accurate proteome-wide label-free quantification by delayed normalization and maximal peptide ratio extraction, termed MaxLFQ. Mol Cell Proteomics 13: 2513-2526.
- Peterson ES, Ann McCue L, Schrimpe Rutledge AC, Jensen JL, Walker H, et al. (2012) VESPA: software to facilitate genomic annotation of prokaryotic organisms through integration of proteomic and transcriptomic data. BMC Genomics 13: 131.
- Vizcaino J, Deutsch EW, Wang R, Vizcaino JA, Deutsch EW, et al. (2014) ProteomeXchange provides globally coordinated proteomics data submission and dissemination. Nat Biotech 32: 223-226.
- Shaw AC, Vandahl BB, Larsen MR, Roepstorff P, Gevaert K, et al. (2002) Characterization of a secreted Chlamydia protease. Cell Microbiol 4: 411-424.
- Meissner F, Mann M (2014) Quantitative shotgun proteomics: considerations for a high-quality workflow in immunology. Nat Immunol 15: 112-117.
- Saka HA, Thompson JW, Chen YS, Kumar Y, Dubois LG, et al. (2011) Quantitative proteomics reveals metabolic and pathogenic properties of Chlamydia trachomatis developmental forms. Mol Microbiol 82: 1185-1203.
- Skipp P, Robinson J, Connor CD (2005) Clarke IN. Shotgun proteomic analysis of Chlamydia trachomatis. Proteomics 5: 1558-1573.
- Hackstadt T, Scidmore Carlson MA, Shaw EI, Fischer ER (1999) The Chlamydia trachomatis IncA protein is required for homotypic vesicle fusion. Cell Microbiol 1: 119-130.
- Suchland RJ, Jeffrey BM, Xia M, Bhatia A, Chu HG, et al. (2008) Identification of concomitant infection with Chlamydia trachomatis IncA-negative mutant and wild-type strains by genomic, transcriptional, and biological characterizations. Infect Immun 76: 5438-5446.
- Delevoye C, Nilges M, Dehoux P, Paumet F, Perrinet S, et al. (2008) SNARE protein mimicry by an intracellular bacterium. PLoS 4: e1000022.
- Delevoye C, Nilges M, Dautry VA, Subtil A (2004) Conservation of the biochemical properties of IncA from Chlamydia trachomatis and Chlamydia caviae: oligomerization of IncA mediates interaction between facing membranes. J Biol Chem 279: 46896-46906.
- Chen C, Chen D, Sharma J, Cheng W, Zhong Y, et al. (2006) The hypothetical protein CT813 is localized in the Chlamydia trachomatis inclusion membrane and is immunogenic in women urogenital infected with C. trachomatis. Infect Immun 74: 4826-4840.
- Derre I, Swiss R, Agaisse H (2011) The lipid transfer protein CERT interacts with the Chlamydia inclusion protein IncD and participates to ER-Chlamydia inclusion membrane contact sites. PLoS Pathog 7: e1002092.
- Scidmore MA, Hackstadt T (2001) Mammalian 14-3-3beta associates with the Chlamydia trachomatis inclusion membrane via its interaction with IncG. Mol Microbiol 39: 1638-1650.
- Rzomp KA, Moorhead AR, Scidmore MA (2006) The GTPase Rab4 interacts with Chlamydia trachomatis inclusion membrane protein CT229. Infect. Immun 74: 5362-5373.
- Elwell C, Averette A, Frando A, Rosenberg O, Engel J (2014) Chlamydia trachomatis IncE Interacts with the Sorting Nexins to Regulate Inclusion Morphology. In: Schachter J, Byrne GI, Chernesky MA, Clarke IN, Darville T, Hook III HW, et al., editors. Proc. Thirteen. Int. Symp. Hum. Chlamydial Infect. San Francisco: International Chlamydia Symposium; p: 145–8.
- Sharma J, Zhong Y, Dong F, Jeanna M, Wang G, et al. (2006) Profiling of Human Antibody Responses to Chlamydia trachomatis Urogenital Tract Infection Using Micro plates Arrayed with 156 Chlamydial Fusion Proteins Profiling of Human Antibody Responses to Chlamydia trachomatis Urogenital Tract Infection Using Micropl. Infect Immun 74: 1490-1499.
Open Access Journals
- Aquaculture & Veterinary Science
- Chemistry & Chemical Sciences
- Clinical Sciences
- Engineering
- General Science
- Genetics & Molecular Biology
- Health Care & Nursing
- Immunology & Microbiology
- Materials Science
- Mathematics & Physics
- Medical Sciences
- Neurology & Psychiatry
- Oncology & Cancer Science
- Pharmaceutical Sciences
