Accurate Identification of BIK Binding Sites at the MDA-MB-231 Cell Genome by Human Tiling Arrays
Ruiz Esparza-Garrido R1*, Ayala K1, Torres-López J2, Rodríguez-Corona JMópez J2 and Velázquez-Flore MÁ1
1Functional Genomics Laboratory, Medical Research Unit in Human Genetics of the Pediatric Hospital "Silvestre Frenk Freund", National Medical Center Siglo XXI, Mexican Institute of Social Security (IMSS), Mexico City, Mexico
2Unit of Medical Research on Infectious Diseases, UMAE of Pediatrics, National Medical Center Siglo XXI, The Mexican Institute of Social Security (IMSS), Mexico City, Mexico
- *Corresponding Author:
- Dr. Miguel Ángel Velázquez Flores
Functional Genomics Laboratory
Medical Research Unit in Human Genetics of the Pediatric Hospital "Silvestre Frenk Freund"
National Medical Center Siglo XXI
Mexican Institute of Social Security (IMSS)
06720 Mexico City, Mexico
Tel: (+5255) 5627-69-00 ext. 22409
E-mail: dr.velazquez.imss@gmail.com
Received Date: January 23, 2018; Accepted Date: February 12, 2018; Published Date: February 19, 2018
Citation: Miguel VF, REG R, Karen AC, Javier TL, Juan RC (2018) Accurate Identification of BIK Binding Sites at the MDA-MB-231 Cell Genome by Human Tiling Arrays. Cancer Biol Ther Oncol. Vol.2 No.1:2
Abstract
Background:
BIK (BCL2-Interacting Killer (Apoptosis-Inducing)) is a multifaceted protein which has gained importance in the study of cancer, particularly in breast cancer. It was recently demonstrated its involvement in controlling the autophagy of the MDA-MB-231 autophagy-dependent cell line, as well as its location in the nucleus of these cells; however, the physiological meaning of this is unknown. Then, the objective of this work was to demonstrate the physical interaction of BIK with the MDA-MB-231 genome.
Methods and Findings:
We demonstrated BIK-DNA interactions by chip on chip. Tiling array analysis shows the interaction of BIK with coding and non-coding regions, mainly in chromosomes 1, 3, 6, and 22. PROMOTER 2.0 and GPMiner analyses demonstrated the interaction of BIK with promoters of specific genes, which, according to KEGG, are mainly involved in the control of metabolism, genetic information processing, signal transduction, cell growth and death, and drug resistance, among others. Importantly, BIK interference altered gene and microRNA expression.
Conclusion:
Our results showed, for the first time, the interaction of BIK with DNA, specifically with the MDA-MB-231 cells genome, which strongly suggests its involvement in the control of transcriptional expression of both coding and non-coding regions.
Keywords
BIK; MDA-MB-231 cells; Chip on chip; MicroRNA; Long non coding RNA
Introduction
BIK is a well characterized pro-apoptotic protein that has recently been associated with breast cancer (BC) malignancy [1]. Additionally, the presence of BIK was demonstrated at the nuclear level of the MDA-MB-231 (M231) cells and its translocation to the cytosol after oxidative stress [2]. Nuclear localization of other “BH3-only” proteins has already been demonstrated and this is associated witH the regulation of the DNA damage response and cell cycle, as well as the transcriptional repression of different genes [3,4]. For example, BNIP3 (BCL2-adenovirus E1B 19kDa Interacting Protein) binds to AIF1 (Apoptosis-inducing factor1) and DR5 (Death-receptor) promoters to transcriptionally repress their expression, which confers apoptosis resistance [5].
In addition to these, other Bcl-2 family members, such as Bcl-2 (B-Cell CLL/Lymphoma 2) and BAX (BCL2-associated X protein), have been detected inside the cell nucleus. Bcl-2 inhibits transcription activation and enzymes involved in DNA doublestrand break (DSB) repair and V(D)J recombination [6] and, based on this, it has been proposed that nuclear Bcl-2 increases genetic instability [7]. Although the expression of BAX (BCL2-associated x protein) has also beendetected at the nuclear level of diverse human cancer lines [8-10], including BC cells [11], its function has not been elucidated.
Based on the above, the nuclear localization of BIK strongly suggests its involvement in gene regulation. In fact, we demonstrated, by CHIP-chip, the interaction of BIK with coding and non-coding regions of the M231 cells genome. BIK interference induced expression changes of specific genes and microRNAs (miRNAs) with which BIK interacted.
Methods
Cell culture
Breast cancer M231cells (American Type Culture Collection (ATCC)) were grown and maintained in DMEM-F12 medium (GIBCO, Life Technologies) with 5% CO2 (37°C). Cross-linking assays for CHIP-chip analysis were performed with 1% formaldehyde, incubating the cells for 10 min at room temperature (25°C); the reaction was stopped with 1.25 M glycine (5 min).
Chromatin extraction
Chip on chip assay was performed in M231cells (1x10⁶ cells) following diverse methodologies [12-14] and performing certain modifications. Once the cells were fixed, culture medium was discarded and cells were detached from plaques with 0.5% Trypsin, 0.2% EDTA, and incubated at 37°C for 10 min; the reaction was stopped with 3ml of culture medium. Later, cells were washed with PBS 1X, and cells were transferred to tubes and centrifuged at 800xg, (10min) at 25°C. The resultant supernatant (S1) was discarded and the pellet (P1) was resuspended in PBS 1X, and centrifuged (800xg) for 5 min at 25°C. The S2 was discarded and P2 was resuspended in PBS 1X with 1mM phenylmethanesulfonylfluoride (PMSF); the PMSF excess was eliminated by centrifuging the sample (800xg, 5 min at 25°C). The S3 was discarded again and the P3 was incubated for 10 min at 4°C with 900μl of CHIP Lysis buffer; the sample was gently mixed and centrifuged at 1,000xg for 5 min (4°C) to pellet the nuclear fraction (Nf). The S4 was stored as the cytoplasmic fraction (Cf) and it was used as negative control in the immunoprecipitation assay. The M231 chromatin was obtained by resuspending the Nf in 200μL of CHIP Nuclear lysis buffer and by incubating for 10 min at 4°C. Chromatin and its associated proteins were quantified by spectrophotometry, and the genomic material was visualized in 1% agarose gels (Supplementary Figure 1A). Protein concentration in the Cf and in the Nf was determined by the Bradford protein assay.
BIK immunoprecipitation
Chromatin restriction: An optimal immunoprecipitation was achieved when chromatin was fragmented: 200-1000 bp in length. Then, chromatin was restricted with 8 U of the micrococcal nuclease (MNase) by incubating for 10 min at 37°C. The reaction (40μl) was stopped by adding 0.25 mM EGTA, and the reaction specificity was assessed by incubating the chromatin under the same conditions described above, but without the MNase. Chromatin restriction was corroborated in 3% agarose gels (Supplementary Figure 1B).
Chromatin pre-clearing: Nonspecific sites were blocked by incubating for 2hr at 4°C the chromatin (500ng) and its associated proteins (193 μg) with 10 μl of sepharose beads coupled to A and G proteins (Santa Cruz, Biotechnology; sc-3000). All systems, Negative control 1 (Cf), Negative control 2 (without anti-BIK), and Sample (chromatin-proteins and anti-BIK), were incubated under these conditions. Thereafter, samples were centrifuged at 14,000xg for 3 min at 4°C, and supernatants (S1; clean sample) were transferred to new tubes; only the “Sample” system was incubated with 4μg anti-BIK (Abcam Cat# ab52182, RRID:AB_867854). The Elution buffer was added to all the systems and samples were incubated during 12-15 hr at 4°C. Then, 20 μl of sepharose beads were added to each sample and they were incubated 2 hr at 4°C. After that time, the systems were centrifuged at 14,000xg for 3 min at 4°C; the resultant supernatant (S2; “Unbound”) correspond to the chromatin that did not establish interactions with BIK. Pellets P2 were washed once with of the following buffers: 2X Low Salt Wash Buffer; 2X High Salt Wash Buffer; and 1X LiCl Wash Buffer. Each wash was stopped by centrifugation at 14,000xg for 3 min (25°C).
Western blotting: To detect the BIK protein after its immunoprecipitation, the resultant pellet (P2;250 μg of total proteins) were boiled for 7 min in 2-Mercaptoethanol and loaded in 20% polyacrylamide gels. Proteins were transferred to polyvinyl difluoride (PVDF) membranes (BIO-RAD, S.A., Hercules CA, USA) and incubated for 12-15 hr at 4°C with the anti-BIK. To avoid unspecific signal, for the same antibody was used for immunoprecipitation and for western blotting, BIK was visualized by incubating the membrane (1hr at 25°C) with protein A, HRP conjugated (dilution: 1:20,000; 18-160, EMD Millipore).
Cross-linking reversion: Dissociation of the complex bead anti-BIK-BIK-Chromatin was performed by incubating P2 with the Reversion buffer during 10 min at 65°C. Samples were centrifuged at 14,000xg for 3 min at 25°C, and the supernatants (S1a) were transferred to new tubes and stored at 4°C. Pellets (P3) were incubated under the same conditions described above and supernatants (S1b) were mixed with S1a. Reversion was completed by incubating the samples for 12-15 hr at 65°C.
Human Tiling Array 2.0: Chromatin, which immunoprecipitated with BIK, was amplified by means of the WGA Kit (Sigma-Aldrich Co. LLC.) (Supplementary Figure 1C). After that, chromatin was purified following the phenol-chloroform-isoamyl alcohol method and it was fragmented (Supplementary Figure 1D), amplified, fragmented, stained, and hybridized, into the Human Tiling array 2.0, following the manufacturer´s instructions (Affymetrix, Inc. Santa Clara California, USA).
CisGenome analysis
To start the Cisgenome analysis, seven bpmap and CEL ﬠles were imported into CisGenome, using the import module for Affymetrix CEL + bpmap. To guarantee more reliable results, CEL data file were normalized to remove background bias, using a normalization factor, for the Affymetrix tiling array data set; p-values were estimated under binomial distribution (Supplementary Table 1).
Peak calling: For peak calling, identiï¬ÂÂcation of regions that have been enriched with signals, CisGenome uses an approach of strand-speciï¬ÂÂc tags to reï¬ÂÂne peak boundaries and ﬠlter out low-quality predictions [15-17]. It uses a negative binomial test for one-condition analysis to help identify peaks among background signals. After normalization of the input data, peak detection was done using “Peak detection” on the Tiling array option for normalized tiling array data set. As a result of this analysis, CisGenome generated a COD ﬠle, which is a tabdelimited text ﬠle that contains the peak associations and their genomic regions. This ﬠle also stores important information such as: peak rank, chromosome, peak start, peak end, peak strand, peak length, maxM/P = maximal TileMap-MA statistic or maximal HMM posterior probability of all the probes within the peak, probe (genomic coordinate) where the maxM/P is obtained [18-21] (Supplementary Tables 1-3).
Integrative genomics viewer (IGV)
The Integrative Genomics Viewer (IGV) [22] is a widely-used viewer that efficiently allows the exploration for integrated genomic data sets, for array-based and next generation sequencing data. In order to visualize the coordinates of peaks detected along the whole human genome, we loaded, in the IGV tool, two lists of peak coordinates in the BED format; the first list corresponded to coding regions and the second one to non-coding regions. Data were visualized using the hg18 genome assembly as reference, previously downloaded directly from IGV servers. Using this approach, a general perspective of the peaks could be assessed along the whole human genome.
Promoter 2.0 prediction server and GPMiner
Promoter prediction was performed with Promoter 2.0 Prediction Server [23] and GPMiner [24]. Promoter 2.0 predicts transcription start sites of vertebrate Pol II promoters in DNA sequences; we focused only on the sequences with high probability (>200) (Supplementary Table 4). Meanwhile, GPMiner is an integrated system for identifying promoter regions and annotating regulatory features, such as transcription factor binding sites, CpG islands, tandem repeats, the TATA box, the CCAAT box, the GC box, overrepresented oligonucleotides, DNA stability, and GC-content. This method has an 80% predictive sensitivity and specificity and incorporates the support vector machine (SVM) with nucleotide composition, over-represented hexamer nucleotides, and DNA stability. Even more, the input sequence can also be analyzed for homogeneity in experimental mammalian promoter sequences.
qPCR
RNA extraction was carried out following the TRIZOL® method and qPCR was performed with the following conditions: Holding: 50°C (2 min) and 95°C (2 min), Forty Cycles: 95°C (15 secs), and the TM°C (1 min), followed by the Melt curve. BIK primers (TM=60°C): forward 5´-ACCTGGACCCTATGGAGGAC-3´; reverse 5´-GTTTCATGGACGGTTTCACC-3´. TTL1 primers (TM=64.6 °C): forward 5´-GAGAGGATGGGTCCAAGTGA-3´; reverse 5´-AGGAGCTGGAGAAAGAAGGG-3´. SBF1 primers (TM=65.05 °C): forward 5´-GTGCCCCTAAGACTGTGGAC-3´; reverse 5´-AGGCTCACGAGAAAGATGCC-3´. MiRNA amplification and BIK interference were performed as previously described [25].
Results
BIK immunoprecipitation
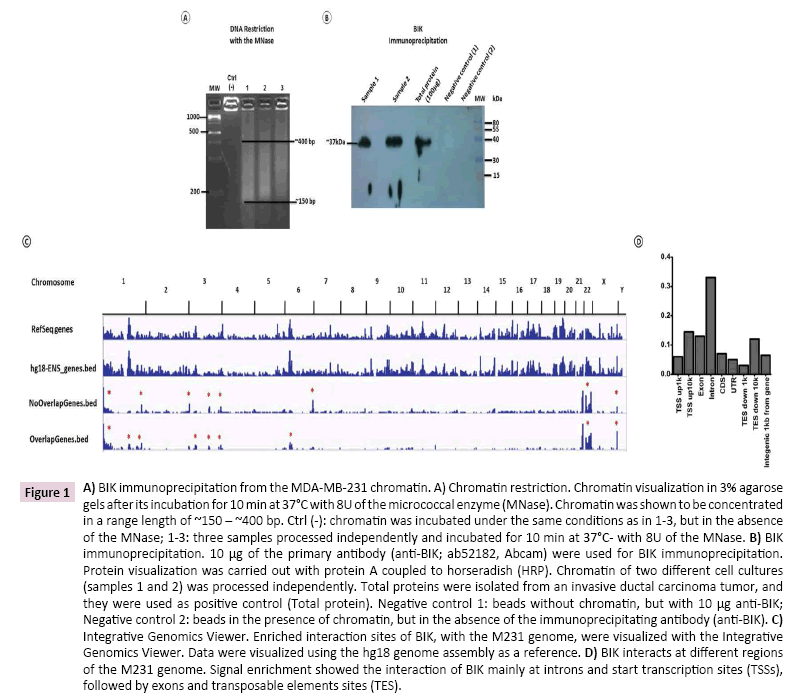
For best immunoprecipitation results, M231 chromatin was restricted with the MNase. In our experimental conditions, DNA was shown to be concentrated between ~150 bp and ~400 bp (Figure 1A), and BIK immunoprecipitation, from this DNA sample, showed a single band of ~37 kDa, as previously reported [26] (Figure 1B).
Figure 1: A) BIK immunoprecipitation from the MDA-MB-231 chromatin. A) Chromatin restriction. Chromatin visualization in 3% agarose gels after its incubation for 10 min at 37°C with 8U of the micrococcal enzyme (MNase). Chromatin was shown to be concentrated in a range length of ~150 – ~400 bp. Ctrl (-): chromatin was incubated under the same conditions as in 1-3, but in the absence of the MNase; 1-3: three samples processed independently and incubated for 10 min at 37°C- with 8U of the MNase. B) BIK immunoprecipitation. 10 μg of the primary antibody (anti-BIK; ab52182, Abcam) were used for BIK immunoprecipitation. Protein visualization was carried out with protein A coupled to horseradish (HRP). Chromatin of two different cell cultures (samples 1 and 2) was processed independently. Total proteins were isolated from an invasive ductal carcinoma tumor, and they were used as positive control (Total protein). Negative control 1: beads without chromatin, but with 10 μg anti-BIK; Negative control 2: beads in the presence of chromatin, but in the absence of the immunoprecipitating antibody (anti-BIK). C) Integrative Genomics Viewer. Enriched interaction sites of BIK, with the M231 genome, were visualized with the Integrative Genomics Viewer. Data were visualized using the hg18 genome assembly as a reference. D) BIK interacts at different regions of the M231 genome. Signal enrichment showed the interaction of BIK mainly at introns and start transcription sites (TSSs), followed by exons and transposable elements sites (TES).
Human tiling array
Data analysis with CisGenome showed 29,361 and 6,889 enriched coding and non-defined regions, respectively. For each ‘Ensembl Transcript identiï¬ÂÂer’, the R-bioconductor package Biomart was used to identify the description for each transcript (Ensembl Transcript ID) and the corresponding gene id (Ensembl Gene ID). In total, 8,205 coordinates were fully annotated with transcript ID (Supplementary Table 2) and 7,036 with gene ID (Supplementary Table 3). Specific signal was enriched on chromosomes1, 3, 6, and 22 (Figure 1C) and the putative BIK binding sites were mainly located in introns, followed by transcription start sites (TSS), exons, and transposable element sites (TES) (Figure 1D).
BIK interacts at putative promoters
In order to make even more rigorous the prediction of BIK interacting at promoter sites, we analyzed the 7,028 regions, with gene ID, by means of the Promoter 2.0 Prediction Server (Department of Systems Biology, Technical University of Denmark) and GPMiner [24]. This analysis showed eighty-three sites with a high probability of being promoter regions, which, according to GPMiner, they are annotated transcriptional start sites that correspond to binding sites for well-characterized transcription factors (Supplementary Table 4).
Potential BIK binding sites
GPMiner is a database that incorporates three well-known transcriptional start site (TSS) tools and orthologous conserved features for promoter prediction. According to this database, consensus sequences with the highest z-score (>200) and occurrence were chosen (Supplementary Table 5). KEGG Orthology of these genes indicates their participation in controlling many cellular processes by acting on different signaling pathways.
ChiP-qPCR validation
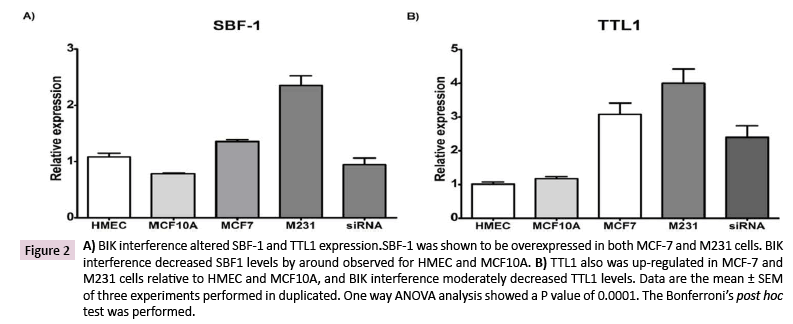
BIK expression was attenuated, with a specific siRNA, and we tested the SBF1 and TTL1 gene expressions by qPCR. SBF-1 was overexpressed in both MCF-7 (25 ± 3.0% vs. HMEC and 73 ± 4% vs. MCF10A) and M231 (117 ± 16% vs. HMEC and199 ± 22% vs. MCF10A) compared to HMEC or MCF10A cells. BIK interference reestablished the SBF-1 expression similar to that observed for HMEC (87 ± 11%) and MCF-10A (120 ± 15% vs. 100%) (Figure 2A). Similarly, TTL1 expression was overexpressed in MCF-7 (305± 33% vs. HMEC and 244 ± 29% vs. MCF-10A) and M231 (396 ± 42% vs. HMEC and 341± 36% vs. MCF10A) cells relative to HMEC or MCF10A. BIK interference decreased TTL1 levels, but they were still higher than those for HMEC or MCF-10A (Figure 2B).
Figure 2: A) BIK interference altered SBF-1 and TTL1 expression.SBF-1 was shown to be overexpressed in both MCF-7 and M231 cells. BIK interference decreased SBF1 levels by around observed for HMEC and MCF10A. B) TTL1 also was up-regulated in MCF-7 and M231 cells relative to HMEC and MCF10A, and BIK interference moderately decreased TTL1 levels. Data are the mean ± SEM of three experiments performed in duplicated. One way ANOVA analysis showed a P value of 0.0001. The Bonferroni’s post hoc test was performed.
BIK binds at miRNA sites
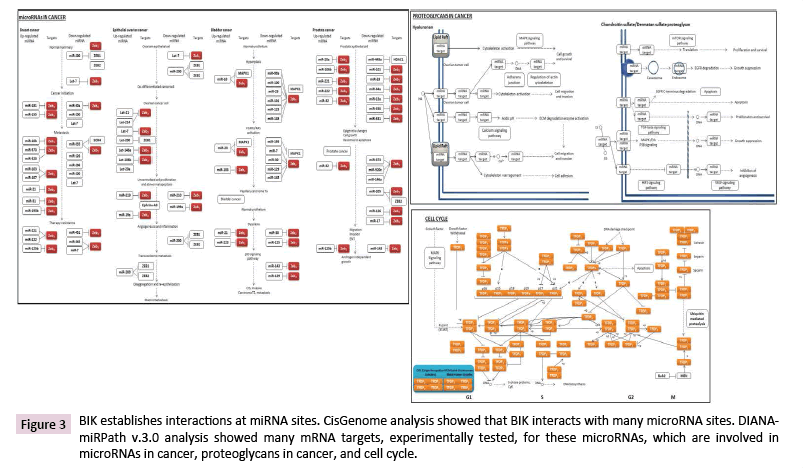
The array analysis showed BIK binding on the loci where many miRNAs are located (Table 1). DIANA-miRPath analysis, with the TarBase tool, indicated the involvement of the mRNA targets of these miRNAs, mainly in the regulation of microRNAs in cancer, proteoglycans in cancer, and cell cycle (Figure 3). Based on this analysis, we noticed that many miRNAs are involved in tumorigenesis, malignancy, and therapy resistance of different cancer types, including breast cancer.
Table 1 BIK binds at microRNA sites.
| MicroRNA | Chromosome | DIANA-miRPath v.3 analysis(# of genes regulated by these miRNAs) |
|---|---|---|
| miR-200a-3p/5p | 670/175 | |
| miR-34a-3p/5p | 1 | 405/4307 |
| miR-200b-3p/5p | 1 | 728/52 |
| miR-137 | 1 | 341 |
| miR-1302 | 1 | 36 |
| miR-1471 | 2 | 0 |
| miR-570-3p/5p | 2 | 95/0 |
| miR-563 | 3 | 0 |
| miR-135a-3p/5p | 3 | 30/167 |
| miR-1224-3p/5p | 3 | 141/244 |
| miR-572 | 3 | 7 |
| miR-1251-3p/5p | 4 | 0/0 |
| miR-143-3p/5p | 4 | 693/110 |
| miR-583 | 5 | 65 |
| miR-1302 | 5 | 36 |
| miR-146a-3p/5p | 5 | 108/473 |
| miR-30a-3p/5p | 6 | 896/1722 |
| miR-1268a | 6 | 27 |
| miR-183-3p/5p | 7 | 269/913 |
| miR-548f-3p | 7 | 0 |
| miR-29a-3p/5p | 7 | 1278/578 |
| miR-124-3p/5p | 8 | 1962/70 |
| miR-548h-3p/5p | 8 | 143/203 |
| miR-873-3p/5p | 9 | 197/662 |
| miR-202-3p/5p | 10 | 63/131 |
| miR-100-3p/5p | 11 | 123/590 |
| miR-708-3p/5p | 11 | 86/393 |
| miR-1261 | 11 | 0 |
| miR-203a-3p/5p | 12 | 0/0 |
| miR-1269a | 14 | 43 |
| miR-495-3p/5p | 14 | 0/0 |
| miR-656-3p/5p | 14 | 0/0 |
| miR-1247-3p/5p | 14 | 0/11 |
| miR-9-3p | 15 | 522 |
| miR-1275 | 15 | 100 |
| miR-10a-3p/5p | 17 | 431/696 |
| miR-187-3p/5p | 18 | 67/87 |
| miR-516b-3p/5p | 19 | 0/75 |
| miR-155-3p/5p | 21 | 21/1247 |
| miR-130b-3p/5p | 22 | 1070/711 |
| miR-let-7b-3p/5p | 22 | 298/2427 |
| miR-106a-3p/5p | 22 | 22/1199 |
| miR-301b-3p/5p | X | 0/0 |
| miR-325 | X | 13 |
| miR-503-3p/5p | X | 0/0 |
| mir-718 | X | 0 |
| miR-424-3p/5p | X | 213/2050 |
Figure 3: BIK establishes interactions at miRNA sites. CisGenome analysis showed that BIK interacts with many microRNA sites. DIANAmiRPath v.3.0 analysis showed many mRNA targets, experimentally tested, for these microRNAs, which are involved in microRNAs in cancer, proteoglycans in cancer, and cell cycle.
qPCR for miR 100
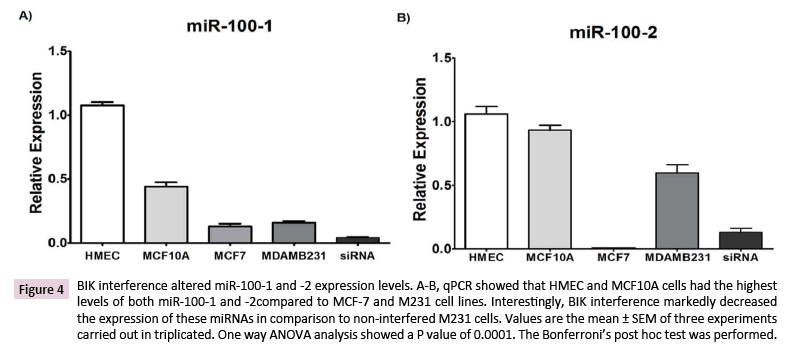
Our data analysis revealed the interaction of BIK with the miR- 100 locus. Then, the expression of this miRNA was tested by qPCR. HMEC cells showed the highest expression levels for both miR-100-5p and -3p, followed by the MCF-10A (miR-100-5p: 2.5 ± 0.27-fold decrease; miR-100-3p: no significant change), MCF- 7 (miR-100-5p: 11 ± 2-fold decrease; miR-100-3p: 262 ± 26-fold decrease), and M231 (miR-100-5p: 7 ± 0.8-fold decrease; miR- 100-3p: 0.42 ± 0.19-fold decrease) cells. A fairly noticeable change was observed for miR-100-3p in M231cells (148 ± 5-fold increase) when compared to MCF-7 cells. BIK interference decreased by ~75% the expression of both miRNAs when compared to the noninterfered M231 cells (Figures 4A and 4B).
Figure 4: BIK interference altered miR-100-1 and -2 expression levels. A-B, qPCR showed that HMEC and MCF10A cells had the highest levels of both miR-100-1 and -2compared to MCF-7 and M231 cell lines. Interestingly, BIK interference markedly decreased the expression of these miRNAs in comparison to non-interfered M231 cells. Values are the mean ± SEM of three experiments carried out in triplicated. One way ANOVA analysis showed a P value of 0.0001. The Bonferroni’s post hoc test was performed.
DIANA-mirPath analysis
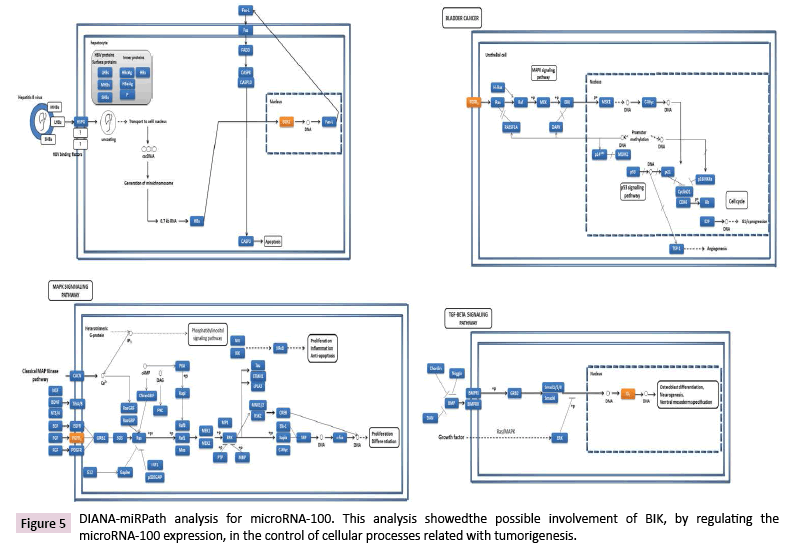
Experimentally validated mRNA targets for miR-100-1-5p were involved in controlling different cellular processes (Figure 5); however, to date there is not experimentally validated mRNA targets for the miR-100-3p, but its predicted targets were involved in cell differentiation, proliferation, and growth, as well as in the inhibition of apoptosis, survival, and insensitivity to antigrowth signals.
BIK binds at long non-coding RNA sites
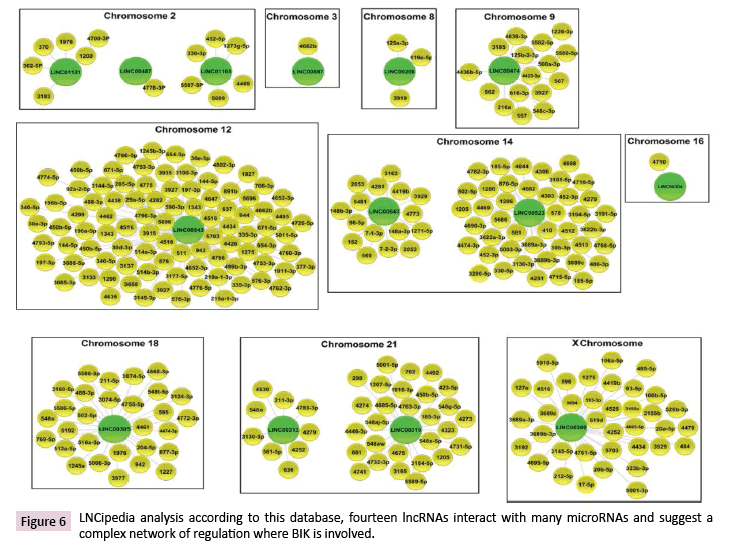
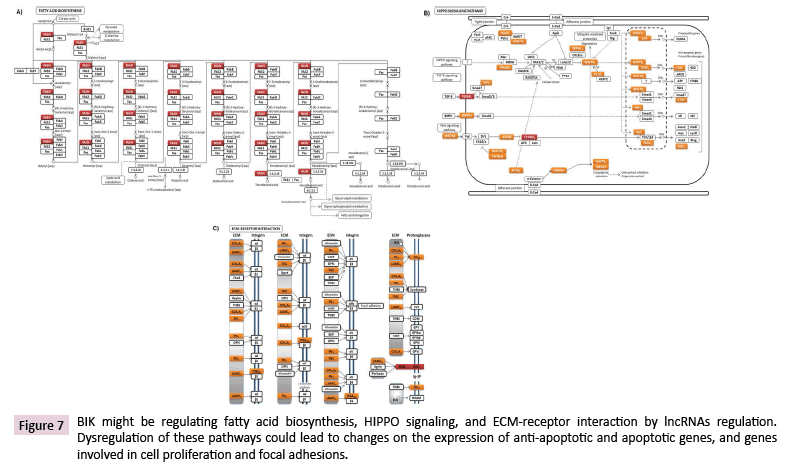
LncRNAs are highly potent gene expression regulators, which can act at different subcellular levels [27]. Data Tiling array analysis showed the genomic association of BIK at loci where thirty-seven lncRNAs are located (Supplementary Table 6). According to the LNCipedia database [28], fourteen of these lncRNAs might establish interactions with three hundred and fifty miRNAs (Figure 6), which suggests a complex regulation network where BIK is involved. DIANA-miRPath v3.0 showed the involvement of these miRNAs in mainly controlling fatty acid biosynthesis, the hippo signaling, ECM-receptor interactions, and prion diseases (Figure 7, Supplementary Table 7). Interestingly, hippo signaling controls the expression of both anti-apoptotic and apoptotic genes, as well as proliferation genes, and involves genes that regulate tight and adherens junctions.
Figure 7: BIK might be regulating fatty acid biosynthesis, HIPPO signaling, and ECM-receptor interaction by lncRNAs regulation. Dysregulation of these pathways could lead to changes on the expression of anti-apoptotic and apoptotic genes, and genes involved in cell proliferation and focal adhesions.
Discussion
In this study, we demonstrated, for the first time, the association of BIK with coding and non-coding regions of the genome of the M231 cells. Importantly, BIK was shown to interact with the promoter regions of several genes where many transcription factors act, as well as with non-coding regions, including the miRNA and lncRNA loci. BIK interference with siRNA modified specific gene expression and miR-100-5p and -3p levels, which indicated the involvement of BIK in gene regulation. Additionally, data mining strongly suggests the control of migration and invasion of the M231 cells by BIK.
BIK binding at putative promoters
Our data showed the interaction of BIK at different levels of the M231 genome, which included coding and non-coding elements. Genes that might be regulated by BIK at the promoter level have been involved in cancer, specifically BC. For example, SBF-1, a pseudophosphatase, is involved in breast cancer dissemination, maintenance of Hox gene expression, cell growth, and differentiation, as well as in oncogenic transformation [29-32]. Although there is no evidence indicating the involvement of TTL1 in cancer, the TTL12 and TTL4 family members were overexpressed during prostate cancer progression and in pancreatic ductal adenocarcinomas (PDAC) cells, respectively [33,34]. Something interesting was the fact that BIK interacted with its own gene; this might indicate a feedback loop where BIK protein levels control BIK gene transcription.
miR-100
Evidence indicates that both miR-100-5p and -3p are downregulated in different types of cancer and this is associated with malignancy [35-40]. Similarly, BC tissues and BC cell lines exhibit lower miR-100-5p expression levels than either non-neoplastic tissues or non-tumorigenic cells, respectively. Something interesting was the fact that this miRNA was shown to be downexpressed in metastatic tumors and in invasive BC cell lines when compared to their counterpart; however, our results, and those reported by Jiang et al. did not revealed expression changes of this miRNA between M231 and MCF-7 cells. Despite this, functional studies showed that expression changes of miR- 100-5p had opposite effects on these BC cells. For example, the induction of the expression of this miRNA inhibited migration and invasion of the M231 cells, but it had the opposite effect on MCF-7 cells. After BIK interference, our data showed a dramatic down-expression of this miRNA in M231 cells, which according to the above, this might be increasing or at least maintaining the migration and invasion of M231.
LncRNAs
BIK interacted with different lncRNA loci in the M231 genome, but there is only available data for one of these lncRNAs, lnc- TTC34-3. This lncRNA was 314-fold down-regulated in clear cell renal cell carcinoma; computational predictions showed that lnc-TTC34-3, among others,establishes interactions with proteins involved in splicing, transport, location, and RNA processing, as well as transcription and translation [41]. Although there is not experimental information about the remaining lncRNAs, predictions suggest the involvement of some of them as “sponges”. This type of lncRNAs is involved in the control of miRNAs disposal into the cytoplasm to control the cellular response [42,43]. Therefore, these lncRNAs, and in turn their associated miRNAs, might be involved in the regulation of M231 cell apoptosis, proliferation, and cell adhesion.
Conclusion
Our data indicated, for the first time, the physical interaction of BIK with coding and non-coding regions of the human genome, particularly with that of the M231 cells. Expression changes of transcripts, after BIK interference, strongly suggest BIK involvement in the control of gene and non-coding RNAs transcription.
Acknowledgments
This article is in memory of Dr. Diego Arenas Aranda. Dr. Miguel Ángel Velázquez Flores and Dr. Javier Torres were respectively supported by grants FIS/IMSS/PROT/G17/1673 and FIS/IMSS/ PROT/PRIO/13/027 from the Instituto Mexicano del Seguro Social (IMSS). Dr. Javier Torres was also supported by El Consejo Nacional de Ciencia y Tecnología-Fronteras de la Ciencia (clave 773). Special thanks to SINTAGMA TRANSLATIONS for English language correction.
Conflict of Interest Statement
The authors declare that they have no conflict of interest.
Ethical Approval
Approval was not required.
References
- Pandya V, Glubrecht D, Vos L, Hanson J, Damaraju S, et al. (2016) The pro-apoptotic paradox: the BH3-only protein Bcl-2 interacting killer (BIK) is prognostic for unfavorable outcomes in breast cancer. Oncotarget 7: 33272-33285.
- Trejo Vargas A, Hernández Mercado E, Ordonez-Razo RM, Lazzarini R, Arenas Aranda DJ, et al. (2015) BIK subcellular localization in response to oxidative stress induced by chemotherapy, in two different breast cancer cell lines and a Non-tumorigenic epithelial cell line. J Appl Toxicol 35:1262-1270.
- Burton TR, Henson ES, Azad MB, Brown M, Eisenstat DD, et al. (2013) BNIP3 acts as transcriptional repressor of death receptor-5 expression and prevents TRAIL-induced cell death in gliomas. Cell Death 4:e587.
- Burton TR,Eisenstat DD,Gibson SB (2009) BNIP3 (Bcl-2 19 kDa interacting protein) acts as transcriptional repressor of apoptosis-inducing factor expression preventing cell death in human malignant gliomas. J Neurosci 29:4189-4199.
- Zinkel SS, Hurov KE, Gross A (2007) Bid plays a role in the DNA damage response. Cell 130:9-10.
- Massaad CA, Portier BP, Taglialatela G (2004)Inhibition of transcription factor activity by nuclear compartment-associated Bcl-2. J Biol Chem 279: 54470-54478.
- Wang Q, Gao F, May WS, Zhang Y, Flagg T,et al. (2004) Bcl2 negatively regulates DNA double-strand-break repair through a nonhomologous end-joining pathway. J Biol Chem 279: 54470-54478.
- Ho YS, Lee HM, Chang CR, Lin JK (1999) Induction of Bax protein and degradation of lamin A during p53-dependent apoptosis induced by chemotherapeutic agents in human cancer cell lines. Biochem Pharmacol 57:143-154.
- Mandal M, Adam L, Mendelsohn J, Kumar R (1998) Nuclear targeting of Bax during apoptosis in human colorectal cancer cells. Oncogene 17: 999-1007.
- Nishita M, Inoue S, Tsuda M, Tateda C, Miyashita T (1998) Nuclear translocation and increased expression of Bax and disturbance in cell cycle progression without prominent apoptosis induced by hyperthermia. Exp Cell Res 244:357-66.
- Hoetelmans R, van Slooten HJ, Keijzer R, Erkeland S, van de Velde CJ, et al. (2000) Bcl-2 and Bax proteins are present in interphase nuclei of mammalian cells. Cell Death Differ 7:384-392.
- Jung K, Wang P, Gupta N, Wu F, Ye X, et al. (2014) Profiling gene promoter occupancy of Sox2 in two phenotypically distinct breast cancer cell subsets using chromatin immunoprecipitation and genome-wide promoter microarrays. Breast Cancer Res 16: 470.
- Hatzis P, van der Flier LG, van Driel MA, Guryev V, Nielsen F, et al. (2008) Genome-wide pattern of TCF7L2/TCF4 chromatin occupancy in colorectal cancer cells. Mol Cell Biol 28: 2732-2744.
- Ezhkova E, Tansey WP (2006) Chromatin immunoprecipitation to study protein-DNA interactions in budding yeast. Methods Mol Biol 313:225-244.
- Ji H, Jiang H, Ma W, Johnson DS, Myers RM, et al. (2016) An integrated software system for analyzing ChIP-chip and ChIP-seq data. Nat Biotechnol 26:1293-1300.
- Ji H, Vokes SA, Wong WH (2006) A comparative analysis of genome-wide chromatin immunoprecipitation data for mammalian transcription factors. Nucleic Acids Res 34:e146.
- Ji H, Wong WH (2005) TileMap: create chromosomal map of tiling array hybridizations. Bioinformatics 21: 3629-3636.
- Noble WS (2009) How does multiple testing correction work? Nat Biotechnol 27: 1135-1137.
- https://bedtools.readthedocs.io/en/latest/
- Kent WJ, Sugnet CW, Furey TS, Roskin KM, Pringle TH, et al.(2002)The human genome browser at UCSC. Genome Res 12:996-1006.
- Durinck S, Spellman P, Birney E, Huber W (2009) Mapping identifiers for the integration of genomic datasets with the R/Bioconductor package biomaRt. Nat Protoc 4:1184–1191.
- Thorvaldsdóttir H, Robinson JT, Mesirov JP (2013) Integrative Genomics Viewer (IGV): High-performance genomics data visualization and exploration. Brief Bioinform 14:178-192.
- Knudsen S (1999) Promoter2.0: for the recognition of PolII promoter sequences. Bioinformatics 15:356-361.
- Lee TY, Chang WC, Hsu JB, Chang TH, Shien DM (2012) GPMiner: an integrated system for mining combinatorial cis-regulatory elements in mammalian gene group. BMC Genomics 1:S3.
- Ruiz Esparza-Garrido R, Rodríguez-Corona JM, López-Aguilar JE, Rodríguez-Florido MA, Velázquez-Wong AC, et al.(2017) Differentially expressed long non-coding rnas were predicted to be involved in the control of signaling pathways in pediatric astrocytoma. Mol Neurobiol 8: 6598-6608.
- Ruiz Esparza-Garrido R, Torres-Márquez ME, Viedma-Rodríguez R, Velázquez-Wong AC,Salamanca F,et al. (2016) Breastcancercell line MDA-MB-231 miRNAprofileexpressionafter BIK interference: BIK involvement in autophagy. TumourBiol 37:6749-6759.
- Bartonicek N, Maag JL, Dinger ME (2016) Long noncoding RNAs in cancer: mechanisms of action and technological advancements. Mol Cancer 15:43.
- Volders PJ, Helsens K, Wang X, Menten B, Martens L, et al. (2013) LNCipedia: a database for annotated human lncRNA transcript sequences and structures. Nuleic Acids Res 41: D246-251.
- Seoane S, Montero JC, Ocaña A, Pandiella A (2016) Breast cancer dissemination promoted by a neuregulin-collagenase 3 signalling node. Oncogene 35:2756-2765.
- Petruk S, Sedkov Y, Smith S, Tillib S, Kraevski V, et al.(2001) Trithorax and dCBP acting in a complex to maintain expression of a homeotic gene. Science 294:1331-1334.
- Zuber J, Tchernitsa OI, Hinzmann B, Schmitz AC, Grips M, et al. (2000) A genome wide survey of RAS transformation targets. Nat Genetics 24:144-152.
- Cui X, De Vivo I, Slany R, Miyamoto A, Firestein R, et al. (1998) Association of SET domain and myotubularin-related proteins modulates growth control. Nat Genet 18:331-337.
- Wasylyk C, Zambrano A, Zhao C, Brants J, Abecassis J, et al. (2010) Tubulin tyrosine ligase like 12 links to prostate cancer through tubulin posttranslational modification and chromosome ploidy. Int Cancer 127: 2542-2553.
- Kashiwaya K, Nakagawa H, Hosokawa M, Mochizuki Y, Ueda K, et al. (2010) Involvement of the tubulin tyrosine ligase-like family member 4 polyglutamylase in PELP1 polyglutamylation and chromatin remodeling in pancreatic cancer cells. Cancer Res 70: 4024-4033.
- Jiang Q, He M, Guan S, Ma M, Wu H, et al. (2016)MicroRNA-100 suppresses the migration and invasion of breast cancer cells by targeting FZD-8 and inhibitingWnt/β-catenin signaling pathway. Tumour Biol 37: 5001-5011.
- Morata-Tarifa C, Jiménez G, García MA, Entrena JM, Griñán-Lisón C, et al.(2016) Low adherent cancer cell subpopulations are enriched in tumorigenic and metastatic epithelial-to-mesenchymal transition-induced cancer stem-like cells. Sci Rep 6:18772.
- Cao YH, Zhang HH, Xu HF, Duan YJ, Li Q, et al. (2015) Prognostic role of microRNA-100 in patients with bladder cancer. Genet Mol Res 14:15948-15954.
- Luan Y, Zhang S, Zuo L, Zhou L (2015) Overexpression of miR-100 inhibits cell proliferation, migration, and chemosensitivity in human glioblastoma through FGFR3. Onco Targets Ther 8:3391-3400.
- Lauvrak SU, Munthe E, Kresse SH, Stratford EW, Namlos HM, et al. (2013) Functional characterisation of osteosarcoma cell lines and identification of mRNAs and miRNAs associated with aggressive cancer phenotypes. Br J Cancer 109:2228-2236.
- de Melo Mia B, Lavorato-Rocha AM, Rodrigues LS, Coutinho-Camillo CM (2013) microRNAportraits in human vulvar carcinoma. Cancer Prev Res (Phila) 6:1231-1241.
- Blondeau JJ, Deng M, Syring I, Schrödter S, Schmidt D, et al. (2015) Identification of novel long non-coding RNAs in clear cell renal cell carcinoma. Clin Epigenetics 7: 10.
- Liu Y, Xu N, Liu B, Huang Y, Zeng H, et al. (2016) Long noncoding RNA RP11-838N2.4 enhances the cytotoxic effects of temozolomide by inhibiting the functions of miR-10a in glioblastoma cell lines.Oncotarget7: 43835-43851.
- Wang SH, Zhang WJ, Wu XC, Zhang MD, Weng MZ, et al.(2016)Long non-coding RNA Malat1 promotes gallbladder cancer development by acting as a molecular sponge to regulate miR-206. Oncotarget 7: 37857-37867.
Open Access Journals
- Aquaculture & Veterinary Science
- Chemistry & Chemical Sciences
- Clinical Sciences
- Engineering
- General Science
- Genetics & Molecular Biology
- Health Care & Nursing
- Immunology & Microbiology
- Materials Science
- Mathematics & Physics
- Medical Sciences
- Neurology & Psychiatry
- Oncology & Cancer Science
- Pharmaceutical Sciences
