Effect of Low Carbohydrate Diet (LCD) for Diabetic Patients with Hypertriglycemia
Koji Ebe1, Hiroshi Bando2*, Tetsuo Muneta3, Masahiro Bando4 and Yoshikazu Yonei5
2Tokushima University/Medical Research, Tokushima, Japan
3Muneta Maternity Clinic, Chiba, Japan
4Department of Nutrition and Metabolism, Institute of Biomedical Sciences, Tokushima University Graduate School, Tokushima, Japan
5Anti-Aging Medical Research Center, Graduate School of Life and Medical Sciences, Doshisha University, Kyoto, Japan
- *Corresponding Author:
- Hiroshi Bando
MD, PhD, FACP
Tokushima University/Medical Research
Tokushima, Japan
Tel: +81-90-3187-2485
E-mail: pianomed@bronze.ocn.ne.jp
Received date: 16 August 2017; Accepted date: 26 August 2017; Published date: 02 September 2017
Citation: Koji Ebe, Hiroshi Bando, Tetsuo Muneta, Masahiro Bando, Yoshikazu Yonei (2017) Effect of Low Carbohydrate Diet (LCD) for Diabetic Patients With Hypertriglycemia. Endocrinol Metab. Vol. 1 No. 1:104.
Copyright: © 2017 Koji Ebe, et al. This is an open-access article distributed under the terms of the creative Commons attribution License, which permits unrestricted use, distribution and reproduction in any medium, provided the original author and source are credited.
Abstract
Background: Arguments have continued for long concerning low carbohydrate diet and calorie restriction (calorie-restricted diet). Authors have reported clinical studies of low carbohydrate diet on ketone bodies, glucose variability and Morbus value so far.
Subjects and methods: Subjects are 28 patients with Type 2 diabetes mellitus, which were 20/8 (M/F) with 48.3 ± 13.9 years old with serum triglyceride more than 250 mg/dL on blood sampling with overnight fasting. They were admitted for 14 days and the protocol was as follows: 1) calorie-restricted diet on day 1 and 2, which had 60% carbohydrates, 2) low carbohydrate diet on day 3-14 days which is so-called super-low carbohydrate diet formula with 12% carbohydrates.
Results: Mean HbA1c was 8.0 ± 1.7% and mean fasting glucose was 177 ± 52 mg/dL. Median data days 2 to 4 were 208 to 147 mg/dL in average glucose, 146 to 21 in Morbus (M) value and 123 to 94.5 mg/day in urinary Cpeptide. Median data days 2 to 14 were 366 to 159 mg/dL in Triglyceride, 46 to 42 mg/dL in HDL-C and 111 to 120 mg/dL in LDL-C. Remnant-like particle cholesterol on day 2 was 15.9 mg/dL in median. Significant correlations on day 2 were shown between Triglyceride and HDL-C (p<0.05), Triglyceride and LDL-C (p<0.05). Remnant-like particle cholesterol-C showed significant positive correlation with Atherogenic Index (AI) and triglyceride (p<0.01), significant negative correlation with HDL (p<0.05). Significant correlations were shown on day 2 and 14 in Triglyceride and LDL-C/HDL-C Ratio (p<0.01).
Discussion and conclusion: Decrease of blood glucose indicated short effect of low carbohydrate diet only for 2 days from calorie restriction to low carbohydrate diet. Apparent large decrease of M value would be useful for clinical management and research. Analyses of correlations among RLP-C, triglyceride, HDL-C, LDL-C, AI and LDL-C/HDL-C Ratio would become the fundamental data for clinical research and give the hint for research direction in the future.
Keywords
Hypertriglycemia; Low carbohydrate diet; Morbus value; Type 2 diabetes mellitus; Remnant-like particle cholesterol
Abbreviation
LCD: Low-Carbohydrate Diet; CRD: Calorie- Restricted Diet; CR: Calorie Restriction; T2DM: Type 2 Diabetes Mellitus; T1DM: Type 1 Diabetes Mellitus; M value: Morbus value; MAGE: Mean Amplitude of Glycemic Excursions; IRI: Immuno-Reactive Insulin; CPR: C-Peptide Immunoreactivity; HOMA-R: Homeostasis Model Assessment-Insulin Resistance; HOMA-β: Homeostasis Model Assessment of β-cell Function; HDL-C: High Density Lipoprotein Cholesterol; LDL-C: Low Density Lipoprotein Cholesterol; RLP-C: Remnant-Like Particle Cholesterol; CVD: Cardiovascular Disease; CHD: Coronary Heart Disease; CAD: Coronary Artery Disease; DAIS: Diabetes Atherosclerosis Intervention Study; AUCs: Area Under the Curves; AI: atherogenic Index; L/H ratio: LDL-C/HDL-C Ratio
Introduction
For years, Low Carbohydrate Diet (LCD) has been more prevalent and evaluated with clinical efficacy for various disease and states. Recent reports have included various evidence of LCD such as randomized controlled trials, systematic review and meta-analyses [1-5].
From the historical discussion of LCD and calorie restriction (CR) diet (calorie restricted diet, CRD), Atkins and Bernstein originally have begun to introduce LCD in European and North American region [6,7]. Consecutively, clinical predominance of LCD has been shown by investigators [8-13].
LCD has been recently applied widely to several diseases and impaired states. They include metabolic syndrome (Met- S), obesity, nonalcoholic fatty liver disease (NAFLD), obstructive sleep apnea, diabetic nephropathy, cardiovascular disease and hyperlipidemia [1,4,14-17]. Thus, broad application of LCD would necessitate the integrated research covering glucose and lipid metabolism.
On the other hand, the author have firstly introduced and reported LCD for T2DM in Japan [18,19]. Subsequently, we reported clinical studies of LCD in the light of elevated ketone bodies, formular diet and Morbus (M) value [20-24].
In current study, we investigated the effect of LCD for the patients with T2DM with high degree of hypertriglycemia, as well as the influence and correlation for glucose and lipid metabolism in short term.
Subjects and Methods
In this study, the subjects included 28 patients with Type 2 diabetes mellitus (T2DM), which were 20 males and 8 females. They are 18-74 years old with 48.3 ± 13.9 (mean ± SD) yo. in average, 50 yo. in the median value. The subjects included for this study were selected who showed the serum level of triglyceride more than 250 mg/dL, when the blood specimen were withdrawn in overnight fasting for 12 hours.
They were admitted for 14-15 days for the educational admission for treatment of T2DM, and received endocrine and metabolic evaluation. The protocol of diet therapy was as follows: 1) Calorie Restriction (CR) diet was provided on day 1 and 2, which had 60% carbohydrates, 25% lipids and 15% protein with 1400 kcal/day. 2) Low Carbohydrate Diet (LCD) was provided from 3 to 15 days, which had 12% carbohydrates, 64% lipids and 24% protein with 1400 kcal/day. 3) This LCD has been so-called “super-LCD formula” in our clinical research for LCD, which is one of the Very low-carbohydrate ketogenic diet (VLCKD) by the definitions of LCD [13,18-20,23].
The evaluation for glucose and lipid metabolism was performed as follows: 1) basal biomarkers measured for research, 2) several biomarkers on day 2 and 14 such as triglyceride, HDL-C and LDL-C, 3) daily profile of blood glucose on day 2 (CR) and 4 (LCD), 4) Morbus (M) value calculated from blood glucose, 5) correlations among several biomarkers obtained.
Analysis method and M value
M value is the index representing both blood sugar level and mean amplitude of glycemic excursions (MAGE) [25-28]. For the glucose variability, daily profiles of blood glucose were measured 7 times a day, and data were calculated for average glucose level and Morbus (M) value. Morus (M) value has been proposed for researching MAGE. This index has been calculated as a logarithmic transformation of the deviation of glycemia from an arbitrary assigned “ideal” glucose value, with an expression of both the mean glucose value and the effect of glucose swings [25-29].
M value is calculated by the formula as follows: M=MBS +MW, where MW= (maximum blood glucose-minimum glucose)/20; MBS=the mean of MBSBS; MBSBS=individual Mvalue for each blood glucose value calculated as (absolute value of [10 × log (blood glucose value/120)])3.
As to the interpretation of M value, the standard range is <180, borderline is 180-320 and abnormal is >320. Adequate sampling times a day have been argued for the detail and precise evaluation of glucose variability and MAGE. There were similar results on 7 times or 20 times of sampling per day [25,28,30], showing similar result in comparison with continuous glucose monitoring (CGM) [28,31,32].
Statistical analyses
In current study, data was represented as the mean ± standard deviation (SD) and also represented median, quartile of 25% and 75% in biomarkers. For statistical analyses, correlation coefficients were calculated using Pearson or Spearman test of the Microsoft Excel analytical tool, which is four steps Excel Statistics 4th edition [33].
Intergroup comparisons were made using the Wilcoxon rank sum test or the Bonferroni multiple comparisons (Lambert method). A significance level of less than 5% obtained using a two-tailed test was considered to be statistically significant.
Ethical considerations
This study was conducted in compliance with the ethical principles of the Declaration of Helsinki and Japan’s Act on the Protection of Personal Information along with the Ministerial Ordinance on Good Clinical Practice (GCP) for Drug (Ordinance of Ministry of Health and Welfare No. 28 of March 27, 1997).
No ethical committee meeting was held. Informed consent was obtained from the subjects concerning this questionnaire. The study was registered with UMIN #R000031211.
Results
Fundamental data
The basal data of the 28 patients were shown in Table 1. The mean HbA1c was 8.0 ± 1.7%, and urinary C-peptide excretion decreased from 123 mg/day to 94.5 mg/day in average from day 2 (CR) to, day 4 (LCD).
Table 1 Basal data of the subjects.
| Mean ± SD | Median [25%-75%] | |
|---|---|---|
| Subjects | ||
| Number | 28 | 28 |
| Sex (male/female) | 20-Aug | 20-Aug |
| Age (y.o.) | 48.3 ± 13.9 | 50 (39.5-60) |
| Glucose (basal) | ||
| HbA1c (%) | 8.0 ± 1.7 | 8.0 (6.5-9.4) |
| Fasting Glucose (mg/dL) | 177 ± 51.7 | 172 (127-213) |
| IRI (μU/mL) | 10.7 ± 7.9 | 7.4 (5.9-11.4) |
| HOMA-R | 4.4 ± 3.4 | 3.6 (2.1-5.1) |
| HOMA-β | 54.6 ± 74.6 | 29.0 (17.3-50.4) |
| Glucose (M value related) | ||
| Average glucose on day 2 (mg/dL) | 214.7 ± 70.9 | 208 (148-279) |
| Average glucose on day 4 (mg/dL) | 154.8 ± 44.2 | 147 (119-189) |
| M value on day 2 | 232 ± 233 | 146 (23.6-428) |
| M value on day 4 | 45.4 ± 57.9 | 21.0 (4.5-72.1) |
| Glucose (CPR excretion in urine) | ||
| Urinary CPR on day 2 (mg/day) | 123 ± 61.2 | 118 (78.4-147) |
| Urinary CPR on day 4 (mg/day) | 94.5 ± 41.9 | 97.5 (54.9-131) |
| Lipid Metabolism | ||
| Triglyceride on day 2 (mg/dL) | 499 ± 357 | 366 (290-488) |
| Triglyceride on day 14 (mg/dL) | 164 ± 83.6 | 159 (104-98) |
| HDL-C on day 2 (mg/dL) | 45.4 ± 10.9 | 45.5 (38-50) |
| HDL-C on day 14 (mg/dL) | 43.8 ± 10.0 | 42.0 (36.8-47.5) |
| LDL-C on day 2 (mg/dL) | 117 ± 50.1 | 111 (80.3-139) |
| LDL-C on day 14 (mg/dL) | 148 ± 51.1 | 120 (110-141) |
| RLP-C on day 2 (mg/dL) | 20.1 ± 22.9 | 15.9 (9.2-21.1) |
The results were expressed by the data of mean ± standard deviation and also median and [25%-75%] in left and right column, respectively.
Changes of glucose and lipid biomarkers
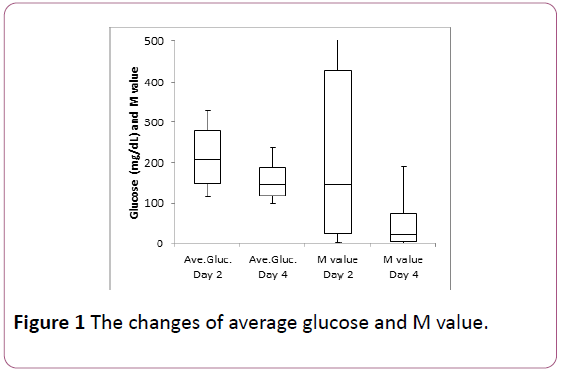
Average glucose from day 2 to day 4 decreased significant difference statistically (p<0.05) (Figure 1). M value apparently decreased from 2 to day 4, in which significant difference could not calculated for large standard deviation (SD) compared to average value.
Average glucose and M value decreased from day 2 to day 4 apparently. The former showed significant decrease (p<0.05). The latter showed larger standard deviation compared to the average level, and then significant difference could not calculated. Maximum data of M value on day 2 was 783.
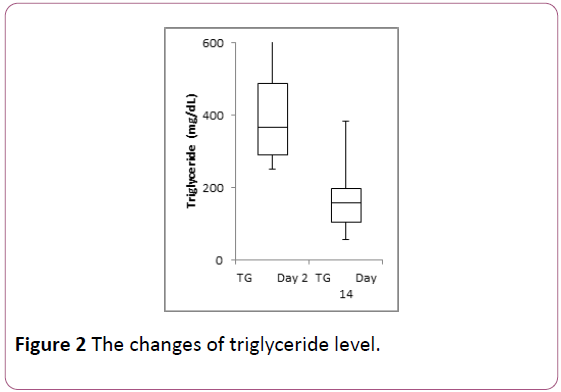
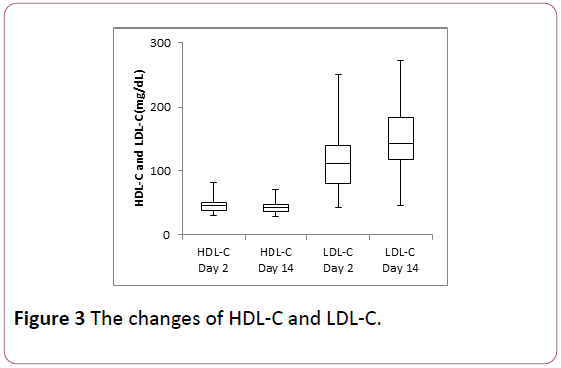
Triglyceride level apparently decreased from day 2 to day 14. The median value was from 366 mg/dL to 169 mg/dL (Figure 2). HDL-C and LDL-C did not show significant changes statistically (Figure 3).
Serum triglyceride level decreased from day 2 to day 14 with significant difference (p<0.01). Maximum data of triglyceride on day 2 was 1564.
Serum levels of HDL-C and LDL-C showed no significant changes from day 2 to day 14.
Correlations among glucose and lipid biomarkers
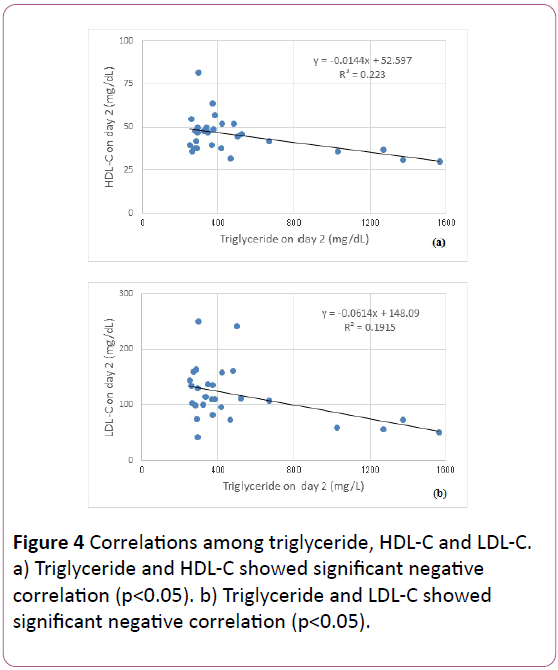
There were significant negative correlation between Triglyceride and HDL-C on day 2 (p<0.05), and between triglyceride and LDL-C on day 2 (p<0.05) (Figure 4).
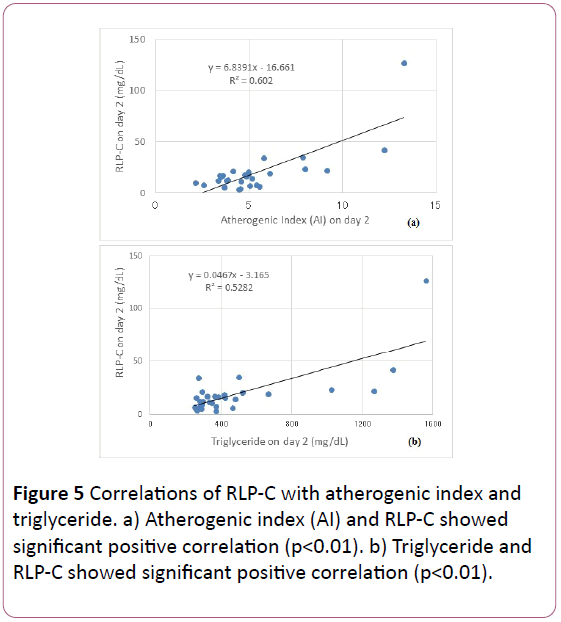
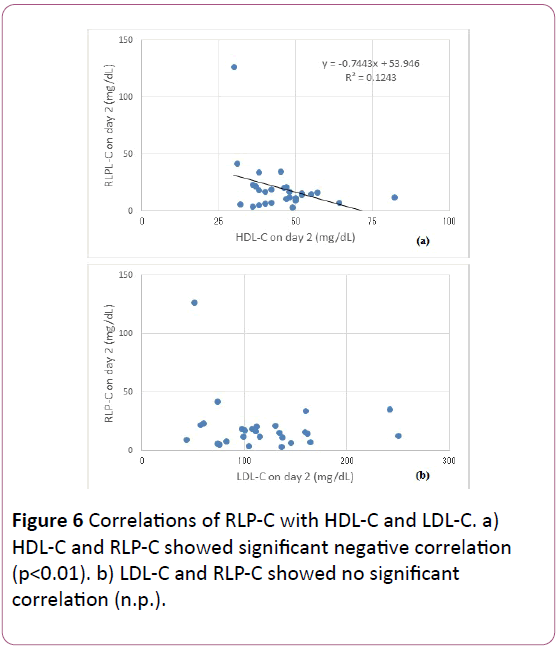
RLP-C showed significant positive correlation with AI and Triglyceride (p<0.01), significant negative correlation with HDL (p<0.05), and no significant correlation with LDL-C (Figures 5 and 6).
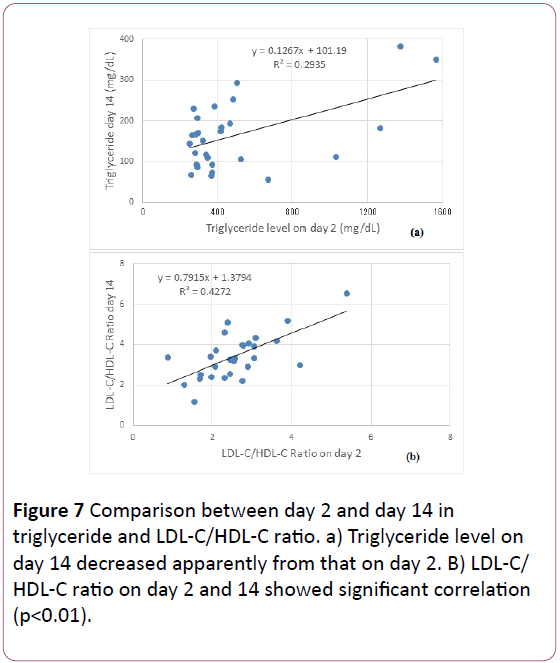
Correlation of the data on day 2 and day 14 in triglyceride and LDL-C/HDL-C ratio are shown in Figure 7. Both revealed significant positive correlation (p<0.01).
Discussion
We have investigated and reported concerning LCD in the light of weight reduction, formular LCD diet, ketone bodies and Morbus (M) value [19,20,21,22,24]. In current study, we investigated the effect of LCD and the influence for glucose and lipid metabolism in the patients with T2DM with high degree of hypertriglycemia. We adopted super-LCD formula including 42 g of carbohydrate per day [18,23], which is far smaller dose from 130 g/day [13,34].
Average glucose and M value were apparently decreased due to LCD for only 2 days, indicating rapid glucose lowering efficacy of LCD. M value represents both elevated glucose level and increased fluctuation of MAGE. The changes for numerical level of M value are expressed larger than that of glucose, and then the improvement of glucose variability would be easily estimated. In type 1 diabetes mellitus (T1DM), glucose variability and M value were investigated by continuous glucose monitoring (CGM) or frequent sampling [35,36].
As the LCD become prevalent and developed, the research focus would be the cardiovascular risk factors and the relationship between glucose and lipids metabolism [1,37-39].
Triglyceride level in all 28 cases apparently decreased in only 12 days, and the regression curve showed y=0.127x+101.2, indicating the degree of decrease. On contrast, HDL-C and LDLC showed no remarkable changes in only 12 days. When LCD is continued for more than several months, HDL-C will be increased [1,12,13].
LDL-C/HDL-C Ratio (L/H ratio) has been used for the evaluation of arteriosclerosis. L/H ratio is especially important index for diabetes and Met-S, because both states are characteristic for elevated triglyceride, decreased HDL and existing small dense LDL. L/H ratio value is said to correlate with the development of plaque in the vessels.
The standard range of L/H ratio would be 2.0 and 1.5 is the ideal value for patients with T2DM or hypertension. Target point of L/H ratio would be 2.0 in primary prevention of coronary heart disease (CHD), and 1.5 in secondary prevention with the past history of CHD.
From the results of 28 cases, 7 cases (25%) showed L/H ratio less than 2.0 on day 2, and only 1 case (3.6%) on day 14.
Current results would give the fundamental data of the influence of LCD in short period for lipid metabolism and the research direction in this field.
Remnant-like particles (RLPs) was isolated and investigated as an atherogenic agent [40]. Through epidemiologic studies, RLP-C levels showed associations with atherosclerosis, cardiovascular disease (CVD), and coronary heart disease (CHD) [41,42]. Furthermore, it would be an independent risk factor for CVD in women, and provides significantly more information than triglyceride [43,44].
RLP-C value has been elevated in T2DM [43-45]. RLP-C and Triglyceride levels were significantly higher in diabetic coronary artery disease (CAD) group than non-diabetic CAD group on Diabetes Atherosclerosis Intervention Study (DAIS) [46]. In addition, The AUCs of TG or RLP-C showed a correlation with the AUCs of plasma insulin, with the correlation for the insulin resistance index [47,48].
From the results, RLP-C level correlated with atherogenic index (AI), TG and HDL, but not with LDL-C. AI is calculated as total-C-HDL-C/HDL-C, and is expressed for the tendency of atherosclerosis with its standard range less than 4.0. Out of 28 cases, 9 cases showed AI less than 4.0.
This study included the patients whose triglyceride was more than 250 mg/dL. Our current study would be useful for research direction to clarify the pathophysiological mechanism concerning glucose and lipid metabolism in T2DM.
Conclusion
In current study, we reported the efficacy of LCD for T2DM by glucose and M value, and analyzed the relationship among glucose, lipids such as RLP-C, triglyceride, HDL-C. LDL-C, L/H ratio and AI. These findings would become the fundamental data for clinical research and treatment of T2DM in the future.
Acknowledgement
The part of the content of this article was presented at the 89th and 90th Scientific Meeting of Japan Endocrine Society (JES) Annual Congress, Kyoto, 2016 and 2017.
The authors would like to thank the patients and staffs for their cooperation and support.
Conflicts of Interest
The authors declare that they have no conflicts of interest.
References
- Meng Y, Bai H, Wang S, Li Z, Wang Q, et al. (2017) Efficacy of low carbohydrate diet for type 2 diabetes mellitus management: A systematic review and meta-analysis of randomized controlled trials. Diabetes Res Clin Pract 131: 124-131.
- Namazi N, Larijani B, Azadbakht L (2017) Low-carbohydrate-diet score and its association with the risk of diabetes: a systematic review and meta-analysis of cohort studies. Horm Metab Res 49: 565-571.
- Snorgaard O, Poulsen GM, Andersen HK, Astrup A (2017) Systematic review and meta-analysis of dietary carbohydrate restriction in patients with type 2 diabetes. BMJ Open Diabetes Res Care 5: e000354.
- Mirmiran P, Asghari G, Farhadnejad H, Eslamian G, Hosseini-Esfahani F, et al. (2017) Low carbohydrate diet is associated with reduced risk of metabolic syndrome in Tehranian adults. Int J Food Sci Nutr 68: 358-365.
- van Wyk HJ, Davis RE, Davies JS (2016) A critical review of low-carbohydrate diets in people with Type 2 diabetes. Diabet Med 33: 148-57.
- Atkins R (1998) Dr. Atkin’s new diet revolution. Avon Books, New York.
- Bernstein RK (2007) Dr. Bernstein’s Diabetes solution: The complete guide to achieving normal blood sugars. Little, Brown US, New York.
- Shai I, Schwarzfuchs D, Henkin Y, Shahar DR, Witkow S, et al. (2008) Weight loss with a low-carbohydrate, mediterranean, or low-fat diet. N Engl J Med 359: 229-241.
- Accurso A, Bernstein RK, Dahlqvist A, Draznin B, Feinman RD, et al. (2008). Dietary carbohydrate restriction in type 2 diabetes mellitus and metabolic syndrome: time for a critical appraisal. Nutr Metab 5: 9.
- Schwarzfuchs D, Golan R, Shai I (2012) Four-year follow-up after two-year dietary interventions. N Engl J Med 367: 1373-1374.
- Atallah R, Filion KB, Wakil SM, Genest J, Joseph L, et al. (2014) Long-term effects of 4 popular diets on weight loss and cardiovascular risk factors: a systematic review of randomized controlled trials. Circ Cardiovasc Qual Outcomes 7: 815-827.
- Nakamura Y, Okuda N, Okamura T, Kadota A, Miyagawa N, et al. (2014) Low-carbohydrate diets and cardiovascular and total mortality in Japanese: a 29-year follow-up of NIPPON DATA80. Br J Nutr 112: 916-24.
- Feinman RD, Pogozelski WK, Astrup A, Bernstein RK, Fine EJ, et al. (2015) Dietary carbohydrate restriction as the first approach in diabetes management: Critical review and evidence base. Nutrition 31: 1-13.
- Hashimoto Y, Fukuda T, Oyabu C, Tanaka M, Asano M, et al. (2016) Impact of low-carbohydrate diet on body composition: Meta-analysis of randomized controlled studies. Obes Rev 17: 499-509.
- Haghighatdoost F, Salehi-Abargouei A, Surkan PJ, Azadbakht L (2016) The effects of low carbohydrate diets on liver function tests in nonalcoholic fatty liver disease: A systematic review and meta-analysis of clinical trials. J Res Med Sci 21: 53.
- Tokuchi Y, Nakamura Y, Munekata Y, Tokuchi F (2016) Low carbohydrate diet-based intervention for obstructive sleep apnea and primary hypothyroidism in an obese Japanese man. Asia Pac Fam Med 15: 4.
- Oyabu C, Hashimoto Y, Fukuda T, Tanaka M, Asano M, et al. (2016). Impact of low-carbohydrate diet on renal function: a meta-analysis of over 1000 individuals from nine randomised controlled trials. Br J Nutr 116: 632-638.
- Ebe K, Ebe Y, Yokota S, Matsumoto T, Hashimoto M, et al. (2004) Low carbohydrate diet (LCD) treated for three cases as diabetic diet therapy. Kyoto Medical Association Journal 51: 125-129.
- Bando H, Nakamura T (2008) Carbo-count therapy and low carbohydrate diet (LCD). J Ther 90: 3105-3111.
- Bando H, Ebe K, Nakamura T, Bando M, Yonei Y (2016) Low carbohydrate diet (LCD): Long and short-term effects and hyperketonemia. Glycative Stress Research 3: 193-204.
- Muneta T, Kawaguchi E, Nagai Y, Matsumoto M, Ebe K, et al. (2016) Ketone body elevation in placenta, umbilical cord, newborn and mother in normal delivery. Glycative Stress Research 3: 133-140.
- Bando H, Ebe K, Muneta T, Bando M, Yonei Y (2017) Effect of low carbohydrate diet on type 2 diabetic patients and usefulness of M-value. Diabetes Res Open J 3: 9-16.
- Bando H, Ebe K, Muneta T, Bando M, Yonei Y (2017) Clinical effect of low carbohydrate diet (lcd): Case report. Diabetes Case Rep 2: 124.
- Bando H, Ebe K, Muneta T, Bando M, Yonei Y (2017) Investigation of uric acid and cystatin C on low-carbohydrate diet (LCD). Diabetes Res Open J 3: 31-38.
- Schlichtkrull J, Munck O, Jersild M (1965) The M-value, an index of blood sugar control in diabetics. Acta Med Scand 177: 95-102.
- Service FJ, Molnar GD, Rosevear JW, Ackerman E, Gatewood LC, et al. (1970) Mean amplitude of glycemic excursions, a measure of diabetic instability. Diabetes 19: 644-655.
- Moberg E, Kollind M, Lins PE, Adamson U (1993) Estimation of blood-glucose variability in patients with insulin-dependent diabetes mellitus. Scand J Clin Lab Invest 53: 507-514.
- Siegelaar SE, Holleman F, Hoekstra JBL, Devries JH (2010) Glucose variability; does it matter? Endocr Rev 31: 171-182.
- Service FH (2013) Glucose variability. Diabetes 62: 1398-1404.
- Monnier L, Colette C (2011) Glycemic variability: can we bridge the divide between controversies? Diabetes Care 34: 1058-1059.
- Baghurst P (2011) Calculating the mean amplitude of glycemic excursion from continuous glucose monitoring data: an automated algorithm. Diabetes Technol Ther 13: 296-302.
- McDonnell CM, Donath SM, Vidmar SI, Werther GA, Cameron FJ (2005) A novel approach to continuous glucose analysis utilizing glycemic variation. Diabetes Technol Ther 7: 253-263.
- Yanai H (2015) Four step excel statistics (4th edn). Seiun-sha Publishing Co. Ltd., Tokyo.
- Sato J, Kanazawa A, Makita S, Hatae C, Komiya K, et al. (2017) A randomized controlled trial of 130 g/day low-carbohydrate diet in type 2 diabetes with poor glycemic control. Clin Nutr 36: 992-1000.
- Kusunoki Y, Katsuno T, Nakae R, Watanabe K, Akagami T, et al. (2015) Evaluation of blood glucose fluctuation in Japanese patients with type 1 diabetes mellitus by self-monitoring of blood glucose and continuous glucose monitoring. Diabetes Res Clin Pract 108: 342-9.
- Ranjan A, Schmidt S, Damm-Frydenberg C, Holst JJ, Madsbad S, et al. (2017) Short-term effects of a low carbohydrate diet on glycaemic variables and cardiovascular risk markers in patients with type 1 diabetes: A randomized open-label crossover trial. Diabetes Obes Metab 2017: 1-6.
- Hu T, Yao L, Reynolds K, Whelton PK, Niu T, et al. (2015) The effects of a low-carbohydrate diet vs. a low-fat diet on novel cardiovascular risk factors: A randomized controlled trial. Nutrients 7: 7978-7994.
- Chen JH, Ouyang C, Ding Q, Song J, Cao W, et al. (2015) moderate low-carbohydrate low-calorie diet improves lipid profile, insulin sensitivity and adiponectin expression in rats. Nutrients 7: 4724-4738.
- Mansoor N, Vinknes KJ, Veierød MB, Retterstøl K (2016) Effects of low-carbohydrate diets v. low-fat diets on body weight and cardiovascular risk factors: a meta-analysis of randomised controlled trials. Br J Nutr 115: 466-479.
- Cohn JS, Marcoux C, Davignon J (1999) Detection, quantification, and characterization of potentially atherogenic triglyceride-rich remnant lipoproteins. Arterioscler Thromb Vasc Biol 19: 2474-2486.
- Hamano M, Saito M, Eto M, Nishimatsu S, Suda H, et al. (2004) Serum amyloid A, C-reactive protein and remnant-like lipoprotein particle cholesterol in type 2 diabetic patients with coronary heart disease. Ann Clin Biochem 41: 125-129.
- Imke C, Rodriguez BL, Grove JS, McNamara JR, Waslien C, et al. (2005) Are remnant-like particles independent predictors of coronary heart disease incidence? The honolulu heart study. Arterioscler Thromb Vasc Biol 25: 1718-1722.
- McNamara JR, Shah PK, Nakajima K, Cupples LA, Wilson PW, et al. (2001) Remnant-like particle (RLP) cholesterol is an independent cardiovascular disease risk factor in women: results from the Framingham Heart Study. Atherosclerosis 154: 229-36.
- Schaefer EJ, McNamara JR, Shah PK, Nakajima K, Cupples LA, et al. (2002) Elevated remnant-like particle cholesterol and triglyceride levels in diabetic men and women in the framingham offspring study. Diabetes Care 25: 989-994.
- Yoshida H, Hirowatari Y, Kurosawa H, Manita D, Yanai H, et al. (2012). Estimation of lipoprotein profile in patients with type II diabetes and its relevance to remnant lipoprotein cholesterol levels. Atherosclerosis 222: 541-544.
- Tsunoda F, Asztalos IB, Horvath KV, Steiner G, Schaefer EJ, et al. (2016) Fenofibrate, HDL, and cardiovascular disease in Type-2 diabetes: The DAIS trial. Atherosclerosis 247: 35-39.
- Nakamura A, Monma Y, Kajitani S, Noda K, Nakajima S, et al. (2016) Effect of glycemic state on postprandial hyperlipidemia and hyperinsulinemia in patients with coronary artery disease. Heart Vessels 31: 1446-1455.
- Nguyen SV, Nakamura T, Uematsu M, Fujioka D, Watanabe K, et al. (2017) Remnant lipoproteinemia predicts cardiovascular events in patients with type 2 diabetes and chronic kidney disease. J Cardiol 69: 529-535.

Open Access Journals
- Aquaculture & Veterinary Science
- Chemistry & Chemical Sciences
- Clinical Sciences
- Engineering
- General Science
- Genetics & Molecular Biology
- Health Care & Nursing
- Immunology & Microbiology
- Materials Science
- Mathematics & Physics
- Medical Sciences
- Neurology & Psychiatry
- Oncology & Cancer Science
- Pharmaceutical Sciences
